Introduction
Niobium oxides offer rich chemistry, existing in many chemical forms with variable stoichiometries, leading to a large variety of structures, properties, and applications.[Reference Wachs, Jehng, Deo, Hu and Arora1–Reference Nowak and Ziolek3] Anodization is an attractive method for fabricating oxides, including those of niobium, because of the possibility of creating self-organized structures with a high degree of order. While far less studied than aluminum, anodization of niobium has been reported to result in structures ranging from random porous films[Reference Yoo, Park, Cha and Choi4] and sunflower formations[Reference Nagahara, Sakairi, Takahashi, Matsumoto, Takayama and Oda5] to granular forms[Reference Tzvetkov, Bojinov and Girginov6] and membranes with smooth, linear pores[Reference Lee, Yang, Yang and Schmuki7] or with rough, vein-like pores.[Reference Ou, Rani, Ham, Field, Zhang, Zheng, Reece, Zhuiykov, Sriram, Bhaskaran, Kaner and Kalantar-Zadeh8] A particularly intriguing morphology is that of microcones, which appears to be unique to anodized niobium. The niobia microcone morphology was first reported by Karlinsey, resulting from anodization in an aqueous electrolyte of HF[Reference Karlinsey9] or HF plus NaF.[Reference Karlinsey10] Habazaki and co-workers have subsequently shown that microcones can also be generated from anodization in a hot glycerol electrolyte containing both K2HPO4 and K3PO4.[Reference Yang, Habazaki, Fujii, Aoki, Skeldon and Thompson11, Reference Oikawa, Minami, Mayama, Tsujii, Fushimi, Aoki, Skeldon, Thompson and Habazaki12] Where crystallinity has been examined (by diffraction), it has been found that microcone niobium oxide is crystalline as grown, in contrast to the majority of other oxides formed by anodization, which are typically amorphous. Though the microstructural characteristics have not yet been studied in detail, microconical niobium oxide has the appearance of rough nanowires or needles that extend from the underlying substrate and clump into tent-like hillocks.[Reference Karlinsey10, Reference Jeong and Jung13] The high surface area, morphological regularity, and as-grown crystallinity of this structure render it attractive for a variety of applications. In particular, it has been considered for biomedical applications, displaying favorable nucleation activity for biological minerals,[Reference Karlinsey and Yi14] as a coating to create surfaces of tuned wettability,[Reference Yang, Habazaki, Fujii, Aoki, Skeldon and Thompson11, Reference Oikawa, Minami, Mayama, Tsujii, Fushimi, Aoki, Skeldon, Thompson and Habazaki12] and as a photoanode in dye-sensitized solar cells.[Reference Jeong and Jung13] These features may also be relevant to electrochromic response, which has emerged as a new area of application for anodized niobia.[Reference Yao, Rani, O'Mullane, Kalantar-zadeh and Ou15]
The relative scarcity of information regarding the crystallization behavior of microcone anodized niobia motivates a greater examination of the process. In particular, we explore here the role of NaF concentration in aqueous electrolytes containing both NaF and HF on morphology and crystallinity, as a parameter that is easily modified but for which clear trends are not yet known. The influence of post-growth annealing is also explored.
Experimental methods
Niobium foil (Sigma Aldrich 99.8%, 0.25 mm in thickness) was cut into pieces (2 × 1 cm2), and then ultrasonically cleaned in acetone, ethanol, and deionized water, respectively. A two-electrode electrochemical cell was used for anodization in which the Nb metal foil was the positive electrode and a platinum foil was the negative electrode. Both electrodes were connected to a DC voltage power supply and immersed in 50 ml of electrolyte solutions containing different concentrations of NaF (Sigma Aldrich, 99.99%) and HF (Sigma Aldrich, 48% assay in H2O) in deionized water. In a series of five solutions, the HF concentration was fixed at 1 wt% and the NaF molarity varied from 0 to 1 M. An additional solution with 1 M NaF and no HF was also examined. All samples were anodized at 40 V for 20 min under continuous stirring. The temperature of the solution, which was neither heated nor cooled, was monitored by insertion of a thermometer. The oxide formed under 1 M NaF (and 1 wt% HF) was further evaluated after annealing under stagnant air at 440 °C for 20 min.
The surface morphology of the resulting structures, a layer of anodized material supported on remaining metal, was studied using a field-emission scanning electron microscope (FESEM—Zeiss SEM Ultra60). The structures were further investigated using an x-ray diffractometer (XRD; PANalytical X'Pert PRO diffractometer with Cu Kα radiation). Raman measurements were performed on a Raman microscope (ProRaman-L Analyzer) with an excitation laser wavelength of 532 nm. Preliminary measurements of steady-state photocurrent density were carried out in 1 M Na2SO4 under AM 1.5 illumination at an applied voltage of 0.5 VAg/AgCl.
Results and discussions
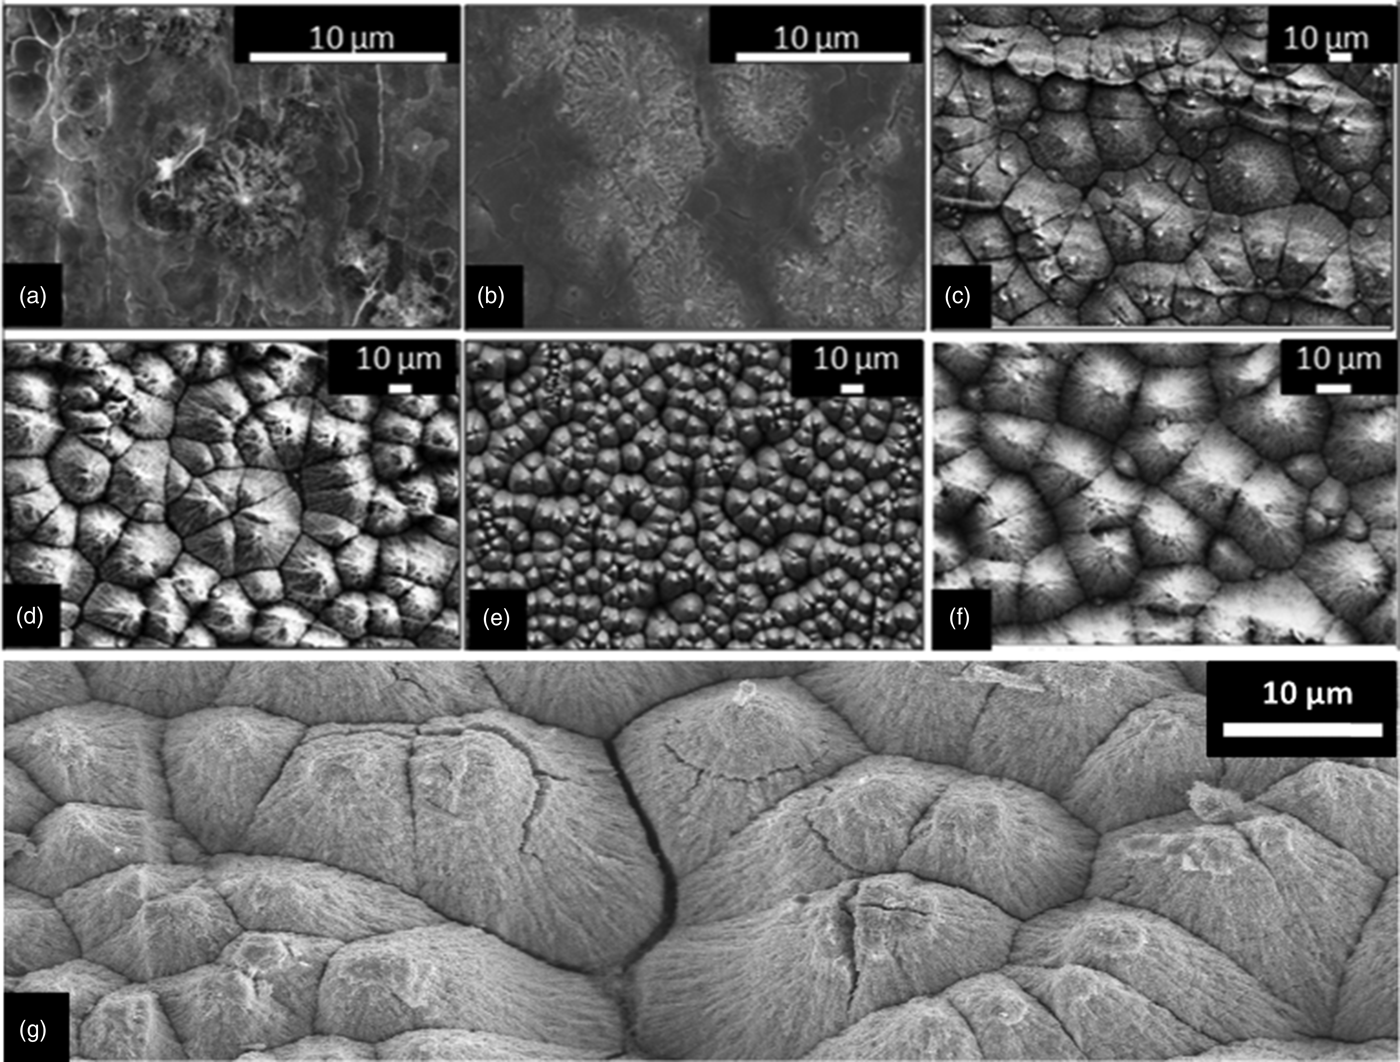
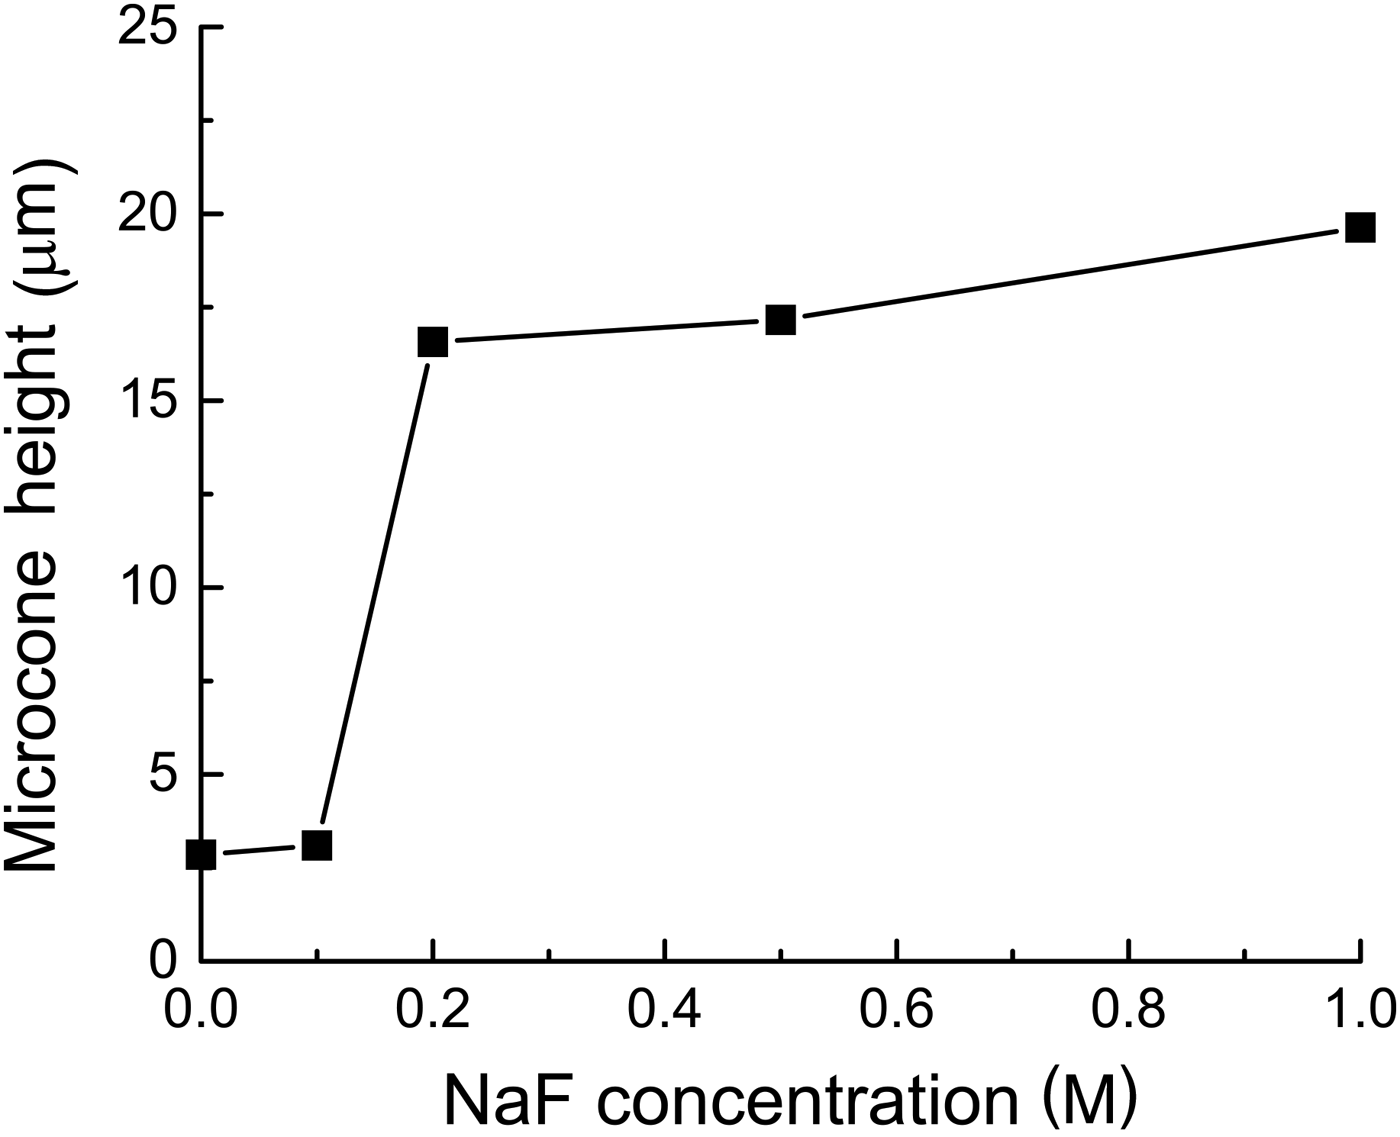
Figures 1(a)–1(e) show FESEM images of as-anodized niobium oxide microcones fabricated in aqueous electrolytes containing HF (1 wt%) and different concentrations of NaF (0–1 M); the length of these microcones is summarized in Fig. 2. In the absence of NaF or at low NaF concentrations (≤0.1 M), despite the presence of HF, very few microcones form. The oxide adopts a random morphology, Figs. 1(a) and 1(b), and the thickness of this layer is 2–3 μm. In contrast, solutions with NaF concentration from 0.2 to 1 M show well-developed microcones, with heights between 17 and 20 μm. Surprisingly, even in the absence of HF, the 1 M NaF electrolyte produces a uniform surface of well-developed microcones [Fig. 1(f)]. This behavior, which is the first report of microcone formation from a slightly basic solution (1 M NaF in water results in a pH of 8.6), is advantageous since it avoids the extreme safety precautions required when handling HF. Annealing the as-grown structures produces few morphological changes, as evident from a comparison of Figs. 1(e) and 1(g).
FESEM of the niobium oxide microcones obtained via anodization at 40 V for 20 min in aqueous electrolytes containing (a–e) 1 wt% HF and (a) 0, (b) 0.1, (c) 0.2, (d) 0.5, (e) 1 M NaF; (f) 1 M NaF + 0 wt% HF, and (g) 1 M NaF + 1 wt% HF after being annealed in air at 440 °C for 20 min.

Variation of the height of the microcones as a function of NaF concentration in the aqueous electrolyte (1 wt% HF, 40 V, 20 min).
The XRD patterns obtained from the niobium oxide structures shown in Fig. 1 are presented in Fig. 3. In the absence of NaF (pattern a), only Nb metal peaks are detected, indicating the oxide layer formed from the electrolyte containing only HF [Fig. 1(a)] is either not crystalline or too small in quantity to detect. Upon introduction of NaF, diffraction peaks appear at approximately 28° and 49.9° 2θ, with intensities that generally increase with increasing NaF concentration (patterns b–e). These are identified as the (2 0 0) and (0 16 0) peaks, respectively, of orthorhombic T-Nb2O5.[Reference Kato and Tamura16–Reference Kobayashi, Hata, Salama and Mallouk18] In addition, a low-angle shoulder on the (2 0 0) peak, distinct from the (1 8 0) peak, is also evident. The pattern from the material obtained by anodization in only NaF (pattern f) is similar to the others, corroborating the conclusion from the microstructural investigations that HF is not essential to the formation of crystalline microcones. On annealing (pattern g), all residual Nb metal peaks disappear. Moreover, the low-angle shoulder on the (2 0 0) peak, evident in the patterns of the as-prepared samples, also disappears, a factor discussed below.
XRD patterns of the niobium oxide microcones obtained via anodization at 40 V for 20 min in aqueous electrolytes containing (a–e) 1 wt% HF and (a) 0, (b) 0.1, (c) 0.2, (d) 0.5, (e) 1 M NaF, (f) 1 M NaF + 0 wt% HF, and (g) 1 M NaF + 1 wt% HF after being annealed in air at 440 °C for 20 min.
Beyond the clear increase of oxide phase fraction with NaF concentration, a striking feature of the diffraction data is the high degree of preferred orientation. In comparison with the expected pattern for randomly oriented T-Nb2O5, the diffraction patterns recorded here display extremely enhanced intensity of the (2 0 0) and (0 16 0) peaks. For example, in the absence of preferred orientation, the (1 8 0) peak will have the highest intensity, followed closely by the (0 0 1) peak, and the (0 16 0) will have an intensity approximately a tenth of that. The result obtained here is interpreted as follows. T-Nb2O5 has a layered structure with edge-shared NbO6 and NbO7 polyhedra forming a layer in the (a–b) plane. These layers are linked by corner sharing of the polyhedra along the z-direction.[Reference Kobayashi, Hata, Salama and Mallouk18] Enhanced intensity of the only significant (h 0 0) and (0 k 0) peaks in the patterns of the anodized niobia suggests that the layers stand essentially on edge, with the c-axis of the structure lying parallel to the underlying Nb substrate. With increasing NaF concentration the preference for the (0 k 0) orientation relative to the (h 0 0) orientation increases, as evident from a slight increase in the relative intensity of the (0 16 0) peak. The occurrence of the (0 0 1) peak in pattern c indicates that the precise orientation adopted may depend on other, unidentified experimental factors.
The low-angle shoulder on the (2 0 0) peaks is interpreted to reflect the existence of a slightly reduced T-Nb2O5−x minority phase. A shift of the (2 0 0) peak toward a smaller 2Θ value is consistent with lattice expansion reported for Nb2O5−x.[Reference Murakami, Wada and Morikawa19] Annealing [Fig. 3(g)] removes the shoulder and any evidence of the reduced phase. While not a central aspect of this study, it can be concluded that the as-anodized samples consist of a mixture of partially reduced and fully oxidized phases, and the heat treatment results in full oxidation. From the peak widths (in combination with the Scherer equation[Reference Patterson20]), the crystallite sizes are estimated to be ~15 nm in the fully oxidized phase and slightly smaller, ~14 nm, in the partially reduced phase. Moreover, the relative intensity of the shoulder indicates that the reduced phase accounts for 1/3 to 2/5 of the oxide content in the as-anodized films. Annealing has no detectable effect on the crystallite size in the fully oxidized T-Nb2O5. While the preferred orientation, phase coexistence and particle size induced peak-broadening introduce challenges for detailed evaluation of the diffraction data, Rietveld analysis (PANalytical X'Pert Plus commercial software package) was carried out to estimate the phase fractions of niobia (including both the fully oxidized and slightly reduced forms) and Nb phases sampled by the X-radiation. The results, Fig. 4, show the oxide phase fraction to increase monotonically with NaF concentration in the electrolyte (as immediately evident from the raw diffraction patterns). For electrolyte solutions with 0.5 M NaF or greater (in 1 wt% HF), the underlying Nb foil is barely detectable.
Weight fraction of Nb2O5−x and Nb phases as a function of NaF concentration in the aqueous electrolyte (1 wt% HF, 40 V, 20 min).
The Raman spectra for two samples, specifically, those anodized using 1 M NaF and 1 wt% HF, without and with a post-anodization annealing step, are presented in Fig. 5. The spectra for other samples (none of which were annealed) were similar to that of the as-anodized sample and are omitted for clarity. Both spectra shown, with peaks at ~ 235, ~ 315, and ~ 700 cm−1, are in excellent agreement with those reported in the literature for T-Nb2O5.[Reference Ou, Rani, Ham, Field, Zhang, Zheng, Reece, Zhuiykov, Sriram, Bhaskaran, Kaner and Kalantar-Zadeh8, Reference Soares, Leite, Nico, Peres, Fernandes, Graca, Matos, Monteiro, Monteiro and Costa21, Reference Brayner and Bozon-Verduraz22] The two low wave-number peaks have been loosely ascribed to Nb–O–Nb bending modes and that at ~700 cm−1 to Nb–O stretching modes. As shown in Fig. 5, the features of the bending mode peaks do not change on annealing, whereas the stretching mode peak sharpens and shifts to higher wave number, from 690 to 708 cm−1. These are interpreted to reflect, respectively, an increase in crystallinity (without change in crystallite size) and the increase in oxidation state discussed above. A clear correlation between Raman stretching frequencies and Nb–O bond distances has been observed in niobium oxide compounds, with increasing frequency correlating to decreasing bond distance, which, in turn, implies, by bond valence arguments, an increase in the oxidation state.[Reference Hardcastle and Wachs23]
Raman spectra of the niobium oxide microcones obtained via anodization at 40 V for 20 min in an aqueous electrolyte containing 1 wt% HF and 1 M NaF, as-grown and after annealing in air at 440 °C for 20 min (as labeled).
Perhaps the most significant findings of this study are that increasing the NaF concentration in the electrolyte solution favors microcone formation, and that under these favorable conditions, well-defined microcone structures are obtained within 20 min. As discussed above, the morphology of the microcones suggests that they are always obtained in the crystalline form, and, thus, factors that favor crystallization may inherently favor microcone formation. The in situ crystallization of anodized niobia has been the subject of much discussion,[Reference Lim, Park and Choi24, Reference Habazaki, Ogasawara, Konno, Shimizu, Nagata, Skeldon and Thompson25] and, indeed, niobium oxide is known to undergo field crystallization much more readily than, for example, tantalum oxide.[Reference Jackson and Hendy26] Although not all crystalline anodized niobia adopts the microcone morphology, where mechanistic investigations have been carried out, microcone[Reference Yang, Habazaki, Fujii, Aoki, Skeldon and Thompson11, Reference Zhao, Wang, Xu, Mi and Li27] and related “sunflower”[Reference Habazaki, Ogasawara, Konno, Shimizu, Nagata, Skeldon and Thompson25] structures have been found to be associated with the crystallization process. A key factor that favors crystallization is increased temperature. Here it was observed that the addition of NaF to the HF-containing electrolytes results in an increase in temperature during anodization (Fig. 6), specifically rising to ~40 °C after 20 min for solutions containing 0.5 M NaF. In contrast, for the electrolyte with only HF, the temperature is unchanged even after 50 min. The highly exothermic oxidation reaction (with a standard enthalpy of reaction between Nb and H2O to form Nb2O5 and H2 of −2370 kJ/mol Nb2O5[Reference Wagman, Evans, Parker, Schumm, Halow, Bailey, Churney and Nuttall28]) is presumably the source of the heat, and apparently NaF catalyzes this reaction much more effectively than does HF. Local heating, the dissipation of which will depend on the details of the experimental configuration, may explain some slight discrepancies between the present work and earlier literature results. For example, Karlinsey suggested that introducing NaF (at an unspecified concentration) in an electrolyte of 2.5 wt% HF retards microcone growth,[Reference Karlinsey10] and Jeong and Jung have reported that at least 30 min is required to achieve visible microcone growth for anodization in a solution of 1 M NaF and 1 wt% HF using 40 V.[Reference Jeong and Jung13] In the present work, well-defined, crystalline microcones, 17 μm in height were obtained from a nominally identical solution within 20 min. Agreement with the present study, however, is found in the work of Zhao et al., who reported that in the absence of NaF almost 60 min of anodization is required in order to nucleate microcones when using a solution of 2 wt% HF, albeit at a relatively low voltage of 20 V.[Reference Zhao, Wang, Xu, Mi and Li27]
Variation in the electrolyte temperature during the anodization of niobium at 40 V for 50 min in 1 wt% HF without and with 0.5 M NaF as indicated.
The microstructural control afforded by changing the electrolyte composition can be expected to impact the behavior of the microcone niobia in any application of interest. Here we found that the photocatalytic performance of the as-anodized microcones, upon their use as photoanodes to split water, increased with increasing concentration of NaF used in the anodization (Fig. 7). This behavior may be a result of the concomitant increase in the amount of oxide formed and surface area available for the photocatalysis. The monotonic increase in photocurrent density suggests that Na or F impurities, which would otherwise likely result in electron-scattering sites,[Reference Rani, Zoolfakar, Ou, Ab Kadir, Nili, Latham, Sriram, Bhaskaran, Zhuiykov, Kaner and Kalantar-Zadeh29] are not enhanced with increasing NaF concentration. Nevertheless, studies directly aimed at quantifying impurity content will be an important part of future efforts. The highest photocurrent density obtained here, 12 μA/cm2, is comparable with or higher than previously reported values for N-doped Nb2O5 measured under similar conditions: 13 μA/cm2 in the case of planar films (at 0.5 V versus Ag/AgCl)[Reference Ruff, Hahn, Killian, Asoh, Ono and Schmuki30] and 7 μA/cm2 for material prepared in the ordered mesoporous form (at 1.2 V versus Ag/AgCl).[Reference Huang, Wang, Huang, Wang, Du and Yang31] Though not yet competitive with materials such as BiVO4 and WO3, for which current densities of order of 0.5 mA/cm2 have been reported,[Reference Gan, Lu and Tong32] this study reveals the tunability of properties afforded by control of the microcone growth conditions.
Steady-state photocurrent generated from as-anodized niobia microcones, fabricated in electrolytes containing different NaF concentrations, tested in 1 M Na2SO4 under AM 1.5 illumination at an applied voltage of 0.5 V Ag/AgCl.
Conclusions
In summary, we demonstrate the rapid growth of crystalline niobium oxide microcones several microns in length via anodization of niobium metal. In contrast to earlier suggestions in the literature, introduction of NaF into the aqueous HF electrolyte solution enhances crystallization and microcone formation. For solutions containing ≥0.2 M NaF well-developed microcones are distributed homogenously over the entire surface. Even in the absence of HF, microcones can be synthesized in 1 M NaF aqueous solution, and this unexpected result will be the subject of future studies. The XRD and Raman analysis showed that the as-anodized microcones are crystalline and slightly reduced, and that a mild heat treatment in air results in full oxidation. We observed an increase in the electrolyte temperature during anodization in solutions containing NaF, in contrast to those containing only HF, a factor which is presumed to contribute to effective microcone formation in the presence of NaF. A preliminary investigation of the photocatalytic activity of the as-anodized microcones revealed the determinant effect of NaF concentration. The structures deliver photocurrent densities comparable with or exceeding those of N-doped counterparts.
Acknowledgments
B. S. acknowledges financial support from the American University in Cairo via a graduate student research grant. Additional support was provided by LiOx Power Inc. and by the California Institute of Technology.