1 Introduction
Among the various types of instability that are known to befall internal gravity waves in continuously stratified fluids (Sonmor & Klaassen Reference Sonmor and Klaassen1997; Dauxois et al. Reference Dauxois, Joubaud, Odier and Venaille2018, and references therein), parametric subharmonic instability (PSI) has been widely studied in past decades. In its most idealized form, PSI involves transfer of energy from a primary sinusoidal wavetrain to two subharmonic perturbations via a weakly nonlinear resonant triad interaction (Staquet & Sommeria Reference Staquet and Sommeria2002). Furthermore, for nearly inviscid flows, the most unstable perturbations have short wavelengths relative to the primary wave, and frequencies equal to half that of the primary wave. In view of this transfer of energy into smaller scales, PSI emerges as a possibly significant factor in the dissipation of oceanic internal waves and could provide a pathway for their contribution to mixing (see, for example, Hibiya, Nagasawa & Niwa Reference Hibiya, Nagasawa and Niwa2002; MacKinnon & Winters Reference MacKinnon and Winters2005; Young, Tsang & Balmforth Reference Young, Tsang and Balmforth2008).
However, oceanic observations of PSI (Alford et al.
Reference Alford, MacKinnon, Zhao, Pinkel, Klymak and Peacock2007; MacKinnon et al.
Reference MacKinnon, Alford, Sun, Pinkel, Zhao and Klymak2013) and detailed numerical simulations (Hazewinkel & Winters Reference Hazewinkel and Winters2011) have found only modest energy transfer rates compared with the idealized theory. To account for this discrepancy, it is possible that the presence of mesoscale flow features, such as background mean flows, may alter the dynamics of PSI. For instance, recent numerical experiments (Richet, Muller & Chomaz Reference Richet, Muller and Chomaz2017) indicate that near-inertial PSI around the critical latitude is weakened by a background mean flow. To support these findings, Richet et al. (Reference Richet, Muller and Chomaz2017) argue that, due to the Doppler shift of the frequency of a sinusoidal plane wave by the background mean flow, the primary wave frequency can fall below
 $2f$
(where
 $f$
is the inertial frequency); in such a case, the subharmonic perturbations with half the primary frequency would be subinertial and hence forbidden by the dispersion relation, preventing PSI.
Recent work on PSI has also shifted attention from sinusoidal plane waves to plane waves with locally confined spatial profiles (Clark & Sutherland Reference Clark and Sutherland2010; Bourget et al.
Reference Bourget, Dauxois, Joubaud and Odier2013, Reference Bourget, Scolan, Dauxois, Le Bars, Odier and Joubaud2014; Karimi & Akylas Reference Karimi and Akylas2014, Reference Karimi and Akylas2017). Such wave beams provide a more realistic setting for PSI (Sutherland Reference Sutherland2013), as they arise from the interaction of the barotropic tide with bottom topography in oceans (see, for example, Lamb Reference Lamb2004; Peacock, Echeverri & Balmforth Reference Peacock, Echeverri and Balmforth2008; Johnston et al.
Reference Johnston, Rudnick, Carter, Todd and Cole2011) and can also be generated by thunderstorms in the atmosphere (see, for example, Fovell, Durran & Holton Reference Fovell, Durran and Holton1992). The finite width of an internal wave beam imposes additional constraints on PSI because subharmonic perturbations, which propagate across the beam with their group velocity, will eventually leave the beam (Bourget et al.
Reference Bourget, Scolan, Dauxois, Le Bars, Odier and Joubaud2014; Karimi & Akylas Reference Karimi and Akylas2014, Reference Karimi and Akylas2017). As a result, PSI is only possible if a beam: (i) has a nearly monochromatic profile so as to allow fine-tuned triad interactions similar to a sinusoidal plane wave; and (ii) is sufficiently wide so that subharmonic perturbations can stay in contact with the beam for a long enough time (Karimi & Akylas Reference Karimi and Akylas2014). These conditions also hold in the presence of background rotation, unless the primary beam frequency happens to be close to
 $2f$
, in which case it is possible for beams of general profile to be subject to PSI. In this instance, subharmonic perturbations with half the primary frequency are near-inertial and have nearly vanishing group velocity, which prolongs their contact with the primary beam and thus enhances PSI (Karimi & Akylas Reference Karimi and Akylas2017).
The present paper seeks to further advance our understanding of PSI in more realistic scenarios. Specifically, we explore the effect of a constant uniform background mean flow on PSI of finite-width internal wave beams in the absence of background rotation. These flow conditions preclude near-inertial PSI and, in view of the findings of Karimi & Akylas (Reference Karimi and Akylas2014), attention is focused on nearly monochromatic beams. We first discuss how the mean flow affects the beam profile itself and then derive evolution equations for fine-scale subharmonic perturbations. The analysis considers a ‘distinguished limit’ where resonant triad interactions, dispersion, viscous dissipation and the background mean flow partake in the perturbation dynamics on an equal footing; to this end, it will be necessary to assume that the mean flow is small. The main effect of the background mean flow is to advect the subharmonic perturbations, which modifies their group velocity and generally hinders their capacity to extract energy from a finite-width beam. Specifically, for PSI to arise in the presence of the mean flow, unstable perturbations must propagate in opposite directions across the beam. This constraint stabilizes very short-scale perturbations and can in fact weaken PSI dramatically, as demonstrated by calculating the growth rates and range of unstable wavenumbers for a nearly monochromatic beam profile with a ‘top-hat’ envelope. These findings for a finite-width beam are in stark contrast to the case of a purely sinusoidal plane wave, where the presence of a uniform background mean flow has no effect on PSI once the Doppler shift of the wave frequencies has been taken into account.
2 Formulation
2.1 Preliminaries
Our analysis assumes two-dimensional disturbances in an unbounded, incompressible, uniformly stratified Boussinesq fluid with constant buoyancy frequency
 $N_{\ast }$
, and will use non-dimensional variables with
 $1/N_{\ast }$
as the time scale and
 $L_{\ast }$
as the length scale, to be specified later. We take
 $x$
to be the horizontal coordinate,
 $y$
the vertical coordinate pointing antiparallel to gravity, and
 $\overline{\boldsymbol{u}}=\overline{u}\,\hat{\boldsymbol{e}}_{x}$
the horizontal uniform background mean flow with respect to a fixed reference frame. In this frame, the streamfunction
 $\unicode[STIX]{x1D713}$
for the velocity field
 $(\unicode[STIX]{x1D713}_{y},-\unicode[STIX]{x1D713}_{x})$
, and the reduced density
 $\unicode[STIX]{x1D70C}$
are governed by
 $$\begin{eqnarray}\displaystyle & \displaystyle \left(\unicode[STIX]{x2202}_{t}+\overline{u}\,\unicode[STIX]{x2202}_{x}\right)\unicode[STIX]{x1D70C}+\unicode[STIX]{x1D713}_{x}+J(\unicode[STIX]{x1D70C},\unicode[STIX]{x1D713})=0, & \displaystyle\end{eqnarray}$$
 $$\begin{eqnarray}\displaystyle & \displaystyle \left(\unicode[STIX]{x2202}_{t}+\overline{u}\,\unicode[STIX]{x2202}_{x}\right)\unicode[STIX]{x1D6FB}2\unicode[STIX]{x1D713}-\unicode[STIX]{x1D70C}_{x}+J(\unicode[STIX]{x1D6FB}2\unicode[STIX]{x1D713},\unicode[STIX]{x1D713})-\unicode[STIX]{x1D708}\unicode[STIX]{x1D6FB}^{4}\unicode[STIX]{x1D713}=0. & \displaystyle\end{eqnarray}$$
 $J(a,b)=a_{x}b_{y}-a_{y}b_{x}$
stands for the Jacobian and
 $\unicode[STIX]{x1D708}=\unicode[STIX]{x1D708}_{\ast }/N_{\ast }L_{\ast }^{2}$
is an inverse Reynolds number, where
 $\unicode[STIX]{x1D708}_{\ast }$
is the fluid kinematic viscosity.
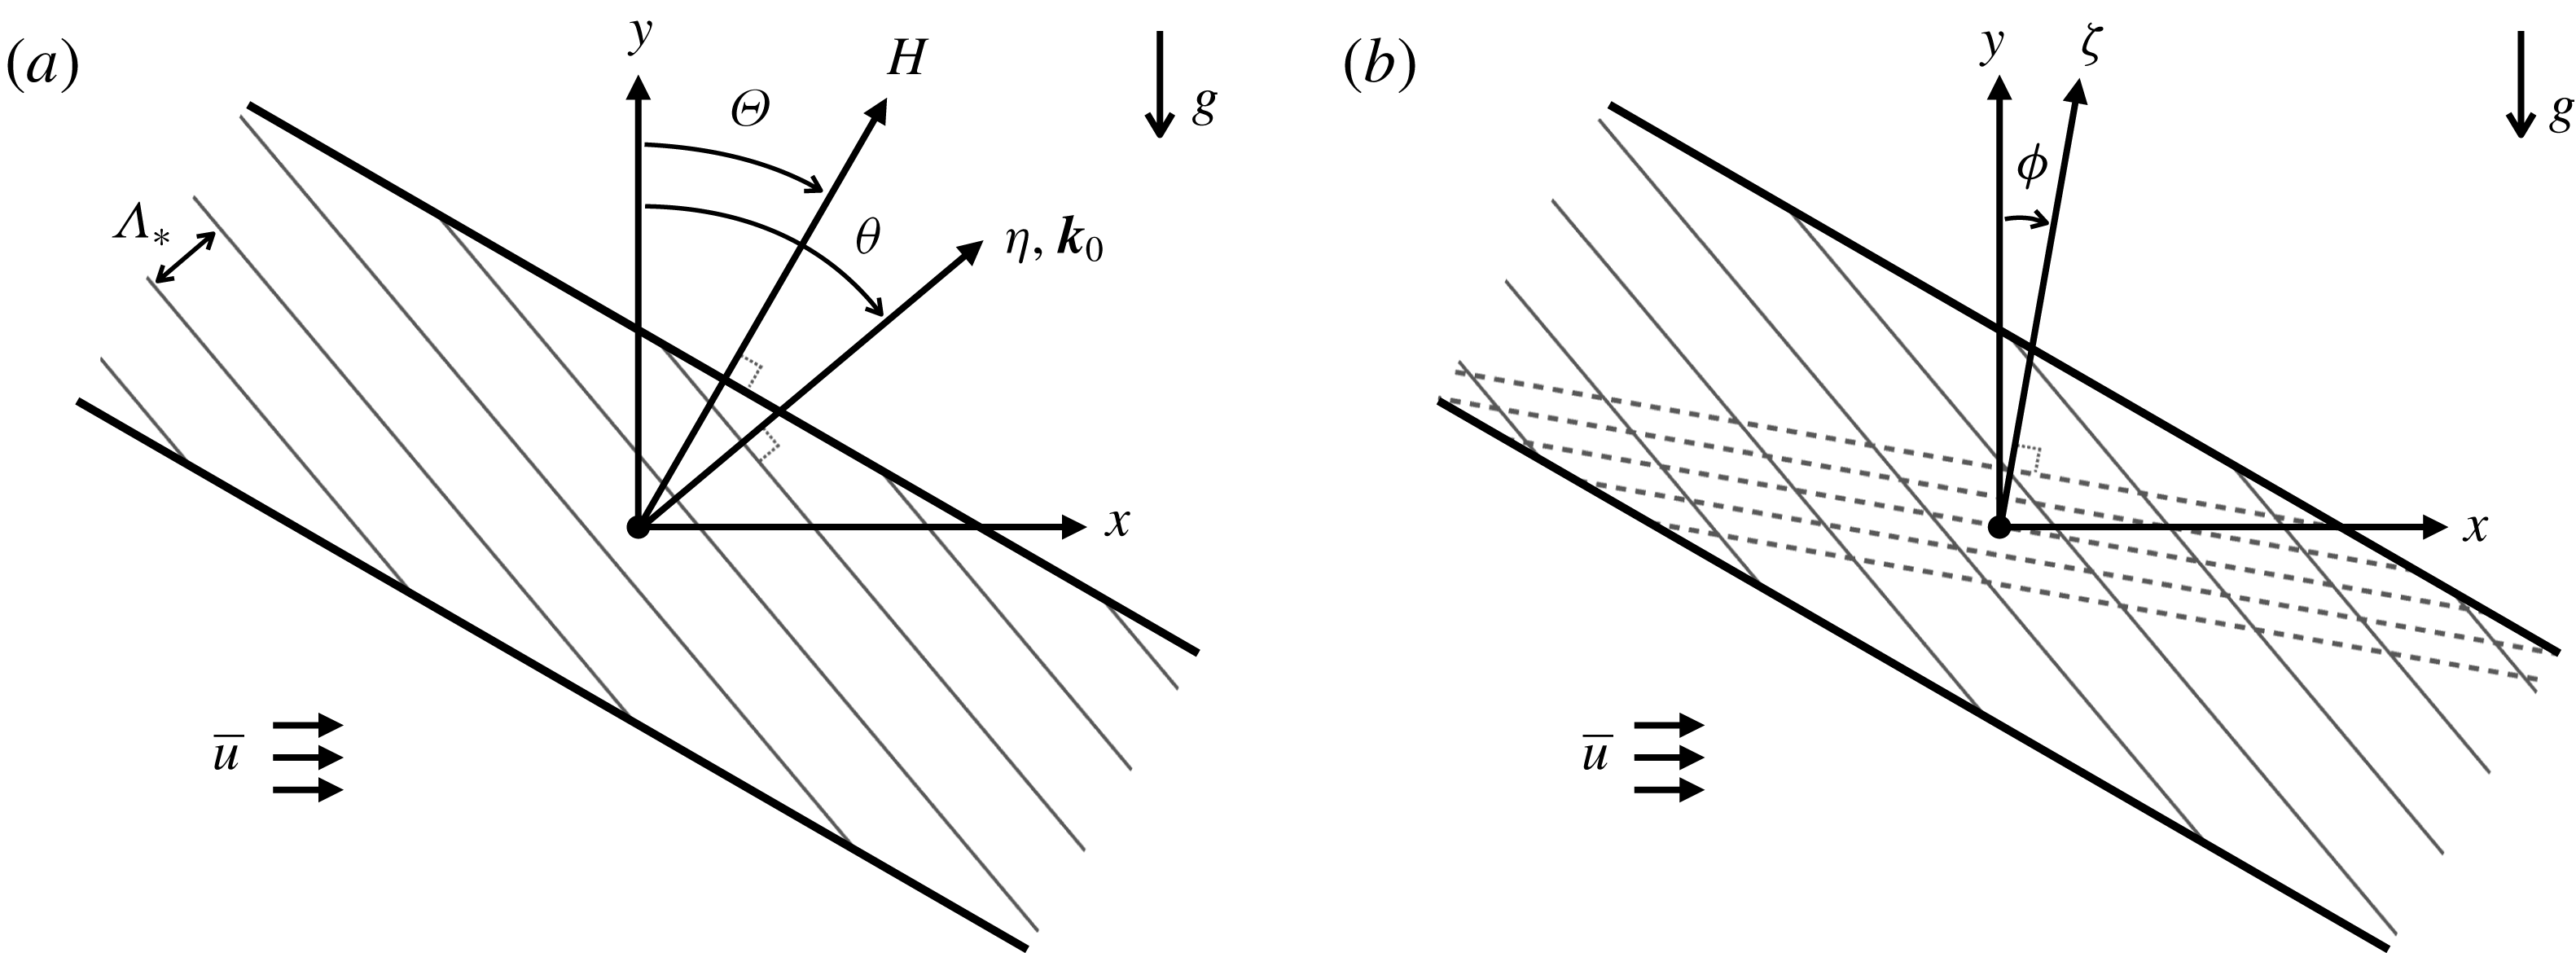
Schematic of the PSI geometry. (a) Nearly monochromatic primary wave beam of frequency
 $\unicode[STIX]{x1D714}_{0}$
in the presence of a background mean flow
 $\overline{u}$
. The carrier wavevector
 $\boldsymbol{k}_{0}=\hat{\boldsymbol{e}}_{\unicode[STIX]{x1D702}}$
is inclined to the vertical by
 $\unicode[STIX]{x1D703}$
, determined by the Doppler-shifted dispersion relation (2.4). Thin solid lines indicate lines of constant phase (for example, crests) of the carrier with
 $\unicode[STIX]{x1D6EC}_{\ast }$
as the dimensional carrier wavelength, while thick solid lines indicate the finite extent of the envelope. According to (2.5), due to the mean flow, the modulation coordinate
 $H$
is inclined to the vertical by an angle
 $\unicode[STIX]{x1D6E9}$
different from
 $\unicode[STIX]{x1D703}$
. (b) Subharmonic perturbations are short-scale wavepackets with lines of constant phase (dashed lines) inclined to the horizontal by the angle
 $\unicode[STIX]{x1D719}$
given by (2.12).

In the linear, inviscid limit (
 $\unicode[STIX]{x1D708}=0$
), equations (2.1) admit sinusoidal plane wave solutions that obey the dispersion relation
 $$\begin{eqnarray}(\unicode[STIX]{x1D714}-\overline{u}\,|\boldsymbol{k}|\sin \unicode[STIX]{x1D703})^{2}=\sin ^{2}\unicode[STIX]{x1D703},\end{eqnarray}$$
where
 $\unicode[STIX]{x1D714}$
is the wave frequency,
 $|\boldsymbol{k}|$
is the magnitude of the wavevector
 $\boldsymbol{k}$
and
 $\unicode[STIX]{x1D703}$
is the inclination of
 $\boldsymbol{k}$
to the vertical (figure 1
a). It is useful to note that in (2.2), the quantity in parentheses is the (Doppler shifted) frequency of the wave in the reference frame moving with the background mean flow. In the case of
 $\overline{u}=0$
, equation (2.2) reduces to the well-known internal wave dispersion relation, where the inclination of the wavevector to the vertical alone determines the frequency. For a locally confined time-harmonic source, it is then possible to construct infinitely long uniform wave beam solutions by superposing sinusoidal plane waves with the same frequency as the source but general
 $|\boldsymbol{k}|$
spectrum, and these solutions are also exact nonlinear states (Tabaei & Akylas Reference Tabaei and Akylas2003). In contrast, for
 $\overline{u}\neq 0$
, the wave frequency is no longer independent of
 $|\boldsymbol{k}|$
and exact uniform beam solutions are not possible. In this case, each wavevector
 $\boldsymbol{k}$
generated by a general, locally confined source with fixed frequency will be affected by the mean flow to a varying degree, resulting in a two-dimensional wake-like wave pattern far away from the forcing (Lighthill Reference Lighthill1978, § 4.12).
2.2 Primary wave beam
Our interest here is on flow conditions that permit the generation of beams for
 $\overline{u}\neq 0$
, that will be used later in the PSI analysis. To this end, keeping also in mind that beams with nearly monochromatic spatial profiles are the only ones that can suffer from PSI in the absence of background rotation (Karimi & Akylas Reference Karimi and Akylas2014), we shall focus on waves generated by a time-harmonic source whose spatial profile consists of a sinusoidal carrier modulated by a locally confined envelope. The steady-state response to such a source is expected to also be time-harmonic and have nearly monochromatic spatial dependence. Accordingly, without getting into the detailed generation process, we take as characteristic length scale
 $L_{\ast }=\unicode[STIX]{x1D6EC}_{\ast }/2\unicode[STIX]{x03C0}$
, where
 $\unicode[STIX]{x1D6EC}_{\ast }$
is the dimensional carrier wavelength of the generated wave disturbance. The carrier wavevector
 $\boldsymbol{k}_{0}$
is then simply given by
 $$\begin{eqnarray}\boldsymbol{k}_{0}=\hat{\boldsymbol{e}}_{\unicode[STIX]{x1D702}},\end{eqnarray}$$
where
 $\hat{\boldsymbol{e}}_{\unicode[STIX]{x1D702}}$
is a unit vector pointing along
 $\unicode[STIX]{x1D702}=x\sin \unicode[STIX]{x1D703}+y\cos \unicode[STIX]{x1D703}$
, and in view of (2.2),
 $\unicode[STIX]{x1D703}$
is related to the source frequency
 $\unicode[STIX]{x1D714}_{0}$
by
 $$\begin{eqnarray}\unicode[STIX]{x1D714}_{0}=(1+\overline{u})\sin \unicode[STIX]{x1D703}.\end{eqnarray}$$
Furthermore, owing to the modulations of the source profile, the wave response involves sidebands,
 $\boldsymbol{k}=\boldsymbol{k}_{0}+\unicode[STIX]{x1D707}\boldsymbol{q}$
(
 $0<\unicode[STIX]{x1D707}\ll 1$
) that modulate the sinusoidal carrier
 $\boldsymbol{k}_{0}$
with a slowly varying envelope. For
 $\overline{u}\neq 0$
, it is clear from (2.2) that each of these sidebands will point in a slightly different direction than
 $\boldsymbol{k}_{0}$
. Expanding (2.2) about
 $\boldsymbol{k}_{0}$
gives
 $\unicode[STIX]{x1D714}_{0}-\overline{u}(\boldsymbol{k}_{0}+\unicode[STIX]{x1D707}\boldsymbol{q})\boldsymbol{\cdot }\hat{\boldsymbol{e}}_{x}=\sin \unicode[STIX]{x1D703}+\unicode[STIX]{x1D707}\boldsymbol{c}_{g}\boldsymbol{\cdot }\boldsymbol{q}$
to leading order in
 $\unicode[STIX]{x1D707}$
, and taking into account (2.4), we find that
 $\boldsymbol{c}_{g}\boldsymbol{\cdot }\boldsymbol{q}+\overline{u}\,\boldsymbol{q}\boldsymbol{\cdot }\hat{\boldsymbol{e}}_{x}=0$
, where the group velocity
 $\boldsymbol{c}_{g}$
of
 $\boldsymbol{k}_{0}$
is taken in the fluid frame. Thus, the slowly varying envelope of the wave response can be described by the stretched coordinate
 $H$
, which is inclined to the vertical by the angle
 $\unicode[STIX]{x1D6E9}$
such that
 $$\begin{eqnarray}H=\unicode[STIX]{x1D707}(x\sin \unicode[STIX]{x1D6E9}+y\cos \unicode[STIX]{x1D6E9}),\quad \tan \unicode[STIX]{x1D6E9}=\frac{-c_{g,y}}{c_{g,x}+\overline{u}}=\frac{\sin \unicode[STIX]{x1D703}}{\cos \unicode[STIX]{x1D703}+\overline{u}/\cos \unicode[STIX]{x1D703}},\end{eqnarray}$$
where
 $\unicode[STIX]{x1D707}^{-1}$
sets the envelope length scale, and
 $c_{g,x}$
and
 $c_{g,y}$
are the horizontal and vertical components of
 $\boldsymbol{c}_{g}$
. It should be noted that the mean flow rotates the modulation direction
 $\hat{\boldsymbol{e}}_{H}$
relative to the carrier direction
 $\hat{\boldsymbol{e}}_{\unicode[STIX]{x1D702}}$
(figure 1
a), an effect that depends on the sign of
 $\overline{u}$
and the orientation of
 $\boldsymbol{k}_{0}$
.
From the above kinematic analysis, it is concluded that the response to the assumed wave source in a background mean flow is a nearly monochromatic beam in the form
 $$\begin{eqnarray}\unicode[STIX]{x1D713}_{0}=\unicode[STIX]{x1D70C}_{0}=\unicode[STIX]{x1D716}\left\{Q(H)\text{e}^{\text{i}(\unicode[STIX]{x1D702}-\unicode[STIX]{x1D714}_{0}t)}+\text{c.c.}\right\}+\cdots \,,\end{eqnarray}$$
where the envelope
 $Q(H)$
is related to the source spatial profile, and the amplitude parameter
 $\unicode[STIX]{x1D716}=U_{\ast }/(N_{\ast }L_{\ast })\ll 1$
, with
 $U_{\ast }$
being the dimensional peak beam velocity. It should be noted that unlike uniform beams in the absence of mean flows, which are exact inviscid nonlinear states, equation (2.6) is only an approximate weakly nonlinear solution of equations (2.1). Specifically, due to the dispersive effects of the mean flow, the beam envelope will also feature variations in the direction orthogonal to
 $\hat{\boldsymbol{e}}_{H}$
. Such ‘along-beam’ modulations, however, have an
 $O(\unicode[STIX]{x1D707}^{-2})$
length scale, as can be verified from expanding (2.2) about
 $\boldsymbol{k}_{0}$
correct to
 $O(\unicode[STIX]{x1D707}^{2})$
, and will be neglected in the PSI stability analysis in comparison with the ‘cross-beam’
 $O(\unicode[STIX]{x1D707}^{-1})$
modulations in
 $H$
. Furthermore, weakly nonlinear effects on the beam solution (2.6) itself, owing to self-interactions with its mean and higher harmonics, will not be considered either because they act over an
 $O(\unicode[STIX]{x1D707}^{-1}\unicode[STIX]{x1D716}^{-2})$
time scale at best (B. Fan, PhD thesis in preparation), and thus are less important than nonlinear triad interactions with subharmonic perturbations, as discussed in the following sections. Finally, viscous dissipation affects predominately these perturbations, since they are of fine scale relative to the underlying beam (see § 2.3).
2.3 Subharmonic perturbations
To examine the linear stability of (2.6) to PSI, we now specify the form of the subharmonic perturbations. According to the standard PSI analysis for sinusoidal wavetrains in the case of no mean flow, the most unstable perturbations (
 $\boldsymbol{k}_{+},\unicode[STIX]{x1D714}_{+}$
) and (
 $\boldsymbol{k}_{-},\unicode[STIX]{x1D714}_{-}$
) correspond to short-scale disturbances relative to the primary wave (
 $|\boldsymbol{k}_{\pm }|\gg |\boldsymbol{k}_{0}|$
) and satisfy the triad resonance conditions
 $$\begin{eqnarray}\displaystyle \boldsymbol{k}_{+}+\boldsymbol{k}_{-} & = & \displaystyle \boldsymbol{k}_{0},\end{eqnarray}$$
 $$\begin{eqnarray}\displaystyle \unicode[STIX]{x1D714}_{+}+\unicode[STIX]{x1D714}_{-} & = & \displaystyle \unicode[STIX]{x1D714}_{0}\end{eqnarray}$$
 $\overline{\boldsymbol{u}}\boldsymbol{\cdot }\boldsymbol{k}$
due to the mean flow, the triad resonance conditions in the fluid frame are equivalent to (2.7) in the stationary frame.
With these considerations in mind, we now turn to the beam (2.6) as the primary wave. Here, the subharmonic perturbations are taken in the form of fine-scale wavepackets that are modulated by the underlying beam (figure 1
b). Furthermore, we consider the ‘distinguished limit’ where triad nonlinear interactions, dispersion, viscous dissipation and the background mean flow are equally important in the evolution of such perturbations. From prior experience (Karimi & Akylas Reference Karimi and Akylas2014), a balance of nonlinear and dispersive effects, acting on an
 $O(\unicode[STIX]{x1D716}^{-1})$
time scale, is achieved when
 $$\begin{eqnarray}\unicode[STIX]{x1D707}=\unicode[STIX]{x1D716}^{1/2}\end{eqnarray}$$
and the perturbations have carrier wavevectors
 $\boldsymbol{k}_{\pm }=O(\unicode[STIX]{x1D716}^{-1/2})$
. Thus, to satisfy the wavevector resonance condition
 $\boldsymbol{k}_{+}+\boldsymbol{k}_{-}=\boldsymbol{k}_{0}$
, we write
 $$\begin{eqnarray}\boldsymbol{k}_{\pm }=\pm \frac{\unicode[STIX]{x1D705}}{\unicode[STIX]{x1D716}^{1/2}}\hat{\boldsymbol{e}}_{\unicode[STIX]{x1D701}}+\frac{1}{2}\boldsymbol{k}_{0},\end{eqnarray}$$
where
 $\hat{\boldsymbol{e}}_{\unicode[STIX]{x1D701}}$
is a unit vector along
 $\unicode[STIX]{x1D701}=x\sin \unicode[STIX]{x1D719}+y\cos \unicode[STIX]{x1D719}$
, with the inclination angle
 $\unicode[STIX]{x1D719}$
to be determined. Here, the parameter
 $\unicode[STIX]{x1D705}=O(1)$
, taken to be positive without loss of generality, controls the carrier wavenumber of the perturbation wavepackets and will play a central role in the determination of the maximum PSI growth rate. Additionally, in order for dispersion, which causes such perturbations to propagate with their
 $O(\unicode[STIX]{x1D716}^{1/2})$
group velocity across the envelope, to be as important as the advection due to the mean flow
 $\overline{u}$
, it is necessary to take the mean flow to be
 $O(\unicode[STIX]{x1D716}^{1/2})$
:
 $$\begin{eqnarray}\overline{u}\rightarrow \unicode[STIX]{x1D716}^{1/2}\overline{u}.\end{eqnarray}$$
As a result, the effects of the mean flow on the primary beam, discussed in § 2.2, will be small.
Substituting (2.3), (2.9) and (2.10) into the dispersion relation (2.2), we find the following expressions for the subharmonic frequencies
 $$\begin{eqnarray}\unicode[STIX]{x1D714}_{\pm }=\sin \unicode[STIX]{x1D719}(1\pm \overline{u}\unicode[STIX]{x1D705})\pm \unicode[STIX]{x1D716}^{1/2}\left\{\frac{1}{2\unicode[STIX]{x1D705}}(\sin \unicode[STIX]{x1D703}-\sin \unicode[STIX]{x1D719}\cos \unicode[STIX]{x1D712})\pm \frac{\overline{u}\sin \unicode[STIX]{x1D703}}{2}\right\},\end{eqnarray}$$
where
 $\unicode[STIX]{x1D712}=\unicode[STIX]{x1D703}-\unicode[STIX]{x1D719}$
. As argued earlier, these wave frequencies have to form a resonant triad with the beam frequency in the reference frame moving with the mean flow, which happens to be equivalent to forming a resonant triad in the stationary frame (viz. equation (2.7b
)). Making use of (2.3), (2.4), (2.9) and (2.11), the triad resonance condition (2.7b
) determines
 $\unicode[STIX]{x1D719}$
:
 $$\begin{eqnarray}\sin \unicode[STIX]{x1D719}=\frac{\sin \unicode[STIX]{x1D703}}{2}.\end{eqnarray}$$
2.4 Evolution equations
At this point, we introduce infinitesimal subharmonic perturbations in the form discussed above to the primary wave beam (2.6),
 $$\begin{eqnarray}\displaystyle & \displaystyle \unicode[STIX]{x1D713}=\unicode[STIX]{x1D713}_{0}+\frac{\unicode[STIX]{x1D716}^{1/2}}{\unicode[STIX]{x1D705}}\left\{A(H,T)\text{e}^{\text{i}(\boldsymbol{k}_{+}\boldsymbol{\cdot }\boldsymbol{x}-\unicode[STIX]{x1D714}_{+}t)}+B(H,T)\text{e}^{\text{i}(\boldsymbol{k}_{-}\boldsymbol{\cdot }\boldsymbol{x}-\unicode[STIX]{x1D714}_{-}t)}+\text{c.c.}\right\}, & \displaystyle\end{eqnarray}$$
 $$\begin{eqnarray}\displaystyle & \displaystyle \unicode[STIX]{x1D70C}=\unicode[STIX]{x1D70C}_{0}+\left\{F(H,T)\text{e}^{\text{i}(\boldsymbol{k}_{+}\boldsymbol{\cdot }\boldsymbol{x}-\unicode[STIX]{x1D714}_{+}t)}+G(H,T)\text{e}^{\text{i}(\boldsymbol{k}_{-}\boldsymbol{\cdot }\boldsymbol{x}-\unicode[STIX]{x1D714}_{-}t)}+\text{c.c.}\right\}. & \displaystyle\end{eqnarray}$$
 $A,B,F,G$
are modulated in
 $H$
owing to their interaction with the primary beam, and
 $T=\unicode[STIX]{x1D716}t$
is the slow time on which dispersion, nonlinear interactions and the mean flow affect the perturbations. Furthermore, as in Karimi & Akylas (Reference Karimi and Akylas2014), we scale the inverse Reynolds number,
 $\unicode[STIX]{x1D708}=2\unicode[STIX]{x1D6FC}\unicode[STIX]{x1D716}^{2}$
, where
 $\unicode[STIX]{x1D6FC}$
is an
 $O(1)$
viscous parameter, to bring dissipation to the same level as these effects. Note that in view of (2.5) and (2.10),
 $H=\unicode[STIX]{x1D716}^{1/2}\unicode[STIX]{x1D702}+O(\unicode[STIX]{x1D716})$
, which simplifies the ensuing calculations significantly. Inserting (2.13) into (2.1), linearizing with respect to the perturbations, grouping terms according to each subharmonic, and eliminating
 $F$
and
 $G$
, we obtain the following coupled evolution equations for
 $A$
and
 $B$
,
 $$\begin{eqnarray}\displaystyle & \displaystyle A_{T}+\frac{1}{D}\left(\frac{c}{\unicode[STIX]{x1D705}}+\overline{u}\sin \unicode[STIX]{x1D703}\right)A_{H}+\text{i}\frac{c^{\prime }}{8\unicode[STIX]{x1D705}^{2}}A+\unicode[STIX]{x1D6FC}\unicode[STIX]{x1D705}^{2}A-\text{i}\unicode[STIX]{x1D705}^{2}\unicode[STIX]{x1D6FF}|Q|^{2}A-\unicode[STIX]{x1D6FE}QB^{\ast }=0, & \displaystyle\end{eqnarray}$$
 $$\begin{eqnarray}\displaystyle & \displaystyle B_{T}-\frac{1}{D}\left(\frac{c}{\unicode[STIX]{x1D705}}-\overline{u}\sin \unicode[STIX]{x1D703}\right)B_{H}+\text{i}\frac{c^{\prime }}{8\unicode[STIX]{x1D705}^{2}}B+\unicode[STIX]{x1D6FC}\unicode[STIX]{x1D705}^{2}B-\text{i}\unicode[STIX]{x1D705}^{2}\unicode[STIX]{x1D6FF}|Q|^{2}B-\unicode[STIX]{x1D6FE}QA^{\ast }=0, & \displaystyle\end{eqnarray}$$
 $$\begin{eqnarray}\left.\begin{array}{@{}c@{}}c=\sin \unicode[STIX]{x1D703}-\sin \unicode[STIX]{x1D719}\cos \unicode[STIX]{x1D712},\quad c^{\prime }=3\sin \unicode[STIX]{x1D719}\cos ^{2}\unicode[STIX]{x1D712}-2\sin \unicode[STIX]{x1D703}\cos \unicode[STIX]{x1D712}-\sin \unicode[STIX]{x1D719},\\ \unicode[STIX]{x1D6FF}={\displaystyle \frac{\sin ^{2}\unicode[STIX]{x1D712}}{2\sin \unicode[STIX]{x1D719}}},\quad \unicode[STIX]{x1D6FE}=\sin \unicode[STIX]{x1D712}\cos ^{2}\left({\displaystyle \frac{\unicode[STIX]{x1D712}}{2}}\right).\end{array}\right\}\end{eqnarray}$$
Here, in order to bring out the effect of the finite width of the primary beam, we have taken
 $Q(H)$
to have fixed
 $O(1)$
width by rescaling
 $H\rightarrow H/D$
, where
 $D=2\unicode[STIX]{x03C0}N\unicode[STIX]{x1D716}^{1/2}$
is the non-dimensional width of the beam envelope and
 $N=O(\unicode[STIX]{x1D716}^{-1/2})$
is the number of carrier wavelengths contained in the beam. In (2.14), the first two terms represent the propagation of the subharmonic wavepackets across the beam with the projection of their group velocity on the modulation direction. The third term corresponds to envelope dispersion, the fourth to viscous dissipation, the fifth to nonlinear refraction, and the sixth to nonlinear energy transfer from the primary wave. Thus, the leading-order effect of the small mean flow is to advect each subharmonic wavepacket and modify its group velocity. In the limit
 $\overline{u}\rightarrow 0$
, we recover the results of Karimi & Akylas (Reference Karimi and Akylas2014). Furthermore, if
 $Q$
is not locally confined, i.e. in the limit of
 $D\rightarrow \infty$
, the group velocity and the effect of
 $\overline{u}$
vanish, and we recover the PSI of a sinusoidal wavetrain.
3 Stability eigenvalue problem
We now proceed to solve (2.14) for a locally confined beam envelope (
 $Q\rightarrow 0$
as
 $H\rightarrow \pm \infty$
) in order to examine the effect of the background mean flow on PSI. To this end, we first make the substitution
 $$\begin{eqnarray}(A,B^{\ast })\rightarrow (A,B^{\ast })\exp \left[\text{i}\frac{D\unicode[STIX]{x1D705}}{c}\left(\frac{c^{\prime }\overline{u}\sin \unicode[STIX]{x1D703}}{8\unicode[STIX]{x1D705}^{2}D}T-\frac{c^{\prime }}{8\unicode[STIX]{x1D705}^{2}}H+\unicode[STIX]{x1D705}^{2}\unicode[STIX]{x1D6FF}\int ^{H}|Q|^{2}\text{d}H^{\prime }\right)\right],\end{eqnarray}$$
which eliminates in (2.14) the dispersive terms proportional to
 $c^{\prime }$
and the part of the nonlinear refraction term that does not involve
 $\overline{u}$
. Next, we search for normal mode solutions
 $$\begin{eqnarray}(A,B^{\ast })=(a,b^{\ast })\text{e}^{\unicode[STIX]{x1D706}T},\end{eqnarray}$$
where
 $\unicode[STIX]{x1D706}=\unicode[STIX]{x1D706}_{r}+\text{i}\unicode[STIX]{x1D706}_{i}$
and
 $\unicode[STIX]{x1D706}_{r}>0$
implies instability. Thus, we obtain the eigenvalue problem
 $$\begin{eqnarray}\displaystyle & \displaystyle (1+\hat{u} )a_{H}+(\hat{\unicode[STIX]{x1D706}}+\text{i}\hat{\unicode[STIX]{x1D6FF}}\hat{u} \hat{\unicode[STIX]{x1D705}}^{3}|Q|^{2})a-\hat{\unicode[STIX]{x1D705}}Qb^{\ast }=0, & \displaystyle\end{eqnarray}$$
 $$\begin{eqnarray}\displaystyle & \displaystyle (1-\hat{u} )b_{H}^{\ast }-(\hat{\unicode[STIX]{x1D706}}+\text{i}\hat{\unicode[STIX]{x1D6FF}}\hat{u} \hat{\unicode[STIX]{x1D705}}^{3}|Q|^{2})b^{\ast }+\hat{\unicode[STIX]{x1D705}}Q^{\ast }a=0, & \displaystyle\end{eqnarray}$$
 $$\begin{eqnarray}\displaystyle & \displaystyle (a,b^{\ast })\rightarrow 0\quad (H\rightarrow \pm \infty ), & \displaystyle\end{eqnarray}$$
 $$\begin{eqnarray}\hat{u} =\frac{\unicode[STIX]{x1D705}\sin \unicode[STIX]{x1D703}}{c}\overline{u},\quad \hat{\unicode[STIX]{x1D706}}=\frac{D\unicode[STIX]{x1D705}}{c}(\unicode[STIX]{x1D706}+\unicode[STIX]{x1D6FC}\unicode[STIX]{x1D705}^{2}),\quad \hat{\unicode[STIX]{x1D6FF}}=\frac{c^{2}\unicode[STIX]{x1D6FF}}{D^{2}\unicode[STIX]{x1D6FE}^{3}},\quad \hat{\unicode[STIX]{x1D705}}=\frac{D\unicode[STIX]{x1D6FE}}{c}\unicode[STIX]{x1D705}.\end{eqnarray}$$
For given beam envelope profile
 $Q(H)$
, background mean flow
 $\overline{u}$
and perturbation wavenumber
 $\unicode[STIX]{x1D705}$
, solving (3.3) determines the eigenvalue spectrum
 $\hat{\unicode[STIX]{x1D706}}$
, and instability arises (
 $\unicode[STIX]{x1D706}_{r}>0$
) only if
 $\hat{\unicode[STIX]{x1D706}}_{r}(\unicode[STIX]{x1D705})>\unicode[STIX]{x1D6FC}D\unicode[STIX]{x1D705}^{3}/c$
. Thus,
 $\hat{\unicode[STIX]{x1D706}}_{r}$
is proportional to the inviscid growth rate (
 $\hat{\unicode[STIX]{x1D706}}_{r}\propto \unicode[STIX]{x1D706}_{r}$
if
 $\unicode[STIX]{x1D6FC}=0$
), whereas the actual growth rate
 $\unicode[STIX]{x1D706}_{r}$
takes into account the effect of viscous dissipation.
As a simple example to illustrate the effect of the background mean flow on PSI, we solve the eigenvalue problem (3.3) for the ‘top-hat’ envelope profile
 $$\begin{eqnarray}Q(H)=\left\{\begin{array}{@{}ll@{}}1/2\quad \quad & (|H|\leqslant 1/2)\\ 0\quad \quad & (|H|>1/2),\end{array}\right.\end{eqnarray}$$
corresponding to a beam that comprises a uniform sinusoidal wave with peak amplitude
 $\unicode[STIX]{x1D716}$
and finite width. Because
 $Q$
is piecewise constant, it is possible to solve (3.3) analytically in
 $|H|>1/2$
and
 $|H|\leqslant 1/2$
. Then, matching these solutions to ensure that
 $a$
and
 $b^{\ast }$
are continuous at
 $H=\pm 1/2$
leads to the characteristic equation for
 $\hat{\unicode[STIX]{x1D706}}$
.
First, consider the case where
 $|\hat{u} |<1$
. The solution to (3.3) can be expressed, up to a normalization constant, as
 $$\begin{eqnarray}\displaystyle & \displaystyle (a,b^{\ast })=(1,0)\text{e}^{-\hat{\unicode[STIX]{x1D706}}H/(1+\hat{u} )}\quad (H>1/2), & \displaystyle\end{eqnarray}$$
 $$\begin{eqnarray}\displaystyle & \displaystyle (a,b^{\ast })=\mathbb{D}(0,1)\text{e}^{\hat{\unicode[STIX]{x1D706}}H/(1-\hat{u} )}\quad (H<-1/2), & \displaystyle\end{eqnarray}$$
 $$\begin{eqnarray}\displaystyle & \displaystyle (a,b^{\ast })=\left\{\mathbb{D}_{+}(1,\mathbb{B}_{+})\text{e}^{\text{i}\unicode[STIX]{x1D70E}H}+\mathbb{D}_{-}(1,\mathbb{B}_{-})\text{e}^{-\text{i}\unicode[STIX]{x1D70E}H}\right\}\text{e}^{\overline{\unicode[STIX]{x1D706}}\hat{u} H/(1-\hat{u} ^{2})}\quad (|H|<1/2), & \displaystyle\end{eqnarray}$$
 $$\begin{eqnarray}\overline{\unicode[STIX]{x1D706}}=\hat{\unicode[STIX]{x1D706}}+\text{i}\frac{\hat{\unicode[STIX]{x1D6FF}}\hat{u} \hat{\unicode[STIX]{x1D705}}^{3}}{4},\quad \unicode[STIX]{x1D70E}=\sqrt{\frac{1}{1\!-\!\hat{u} ^{2}}\left(\frac{\hat{\unicode[STIX]{x1D705}}^{2}}{4}-\frac{\overline{\unicode[STIX]{x1D706}}^{2}}{1\!-\!\hat{u} ^{2}}\right)},\quad \mathbb{B}_{\pm }=\frac{2}{\hat{\unicode[STIX]{x1D705}}(1\!-\!\hat{u} )}\left(\overline{\unicode[STIX]{x1D706}}\pm \text{i}(1\!-\!\hat{u} ^{2})\unicode[STIX]{x1D70E}\right).\end{eqnarray}$$
Here,
 $\mathbb{D},\mathbb{D}_{+},\mathbb{D}_{-}$
are constants determined by enforcing continuity of
 $a$
and
 $b^{\ast }$
at
 $H=\pm 1/2$
. For a non-trivial solution to exist, we obtain the characteristic equation
 $$\begin{eqnarray}\frac{\overline{\unicode[STIX]{x1D706}}}{1-\hat{u} ^{2}}\sin \unicode[STIX]{x1D70E}+\unicode[STIX]{x1D70E}\cos \unicode[STIX]{x1D70E}=0\end{eqnarray}$$
that determines
 $\overline{\unicode[STIX]{x1D706}}$
; then,
 $\hat{\unicode[STIX]{x1D706}}$
and
 $\unicode[STIX]{x1D706}$
follow directly via (3.7) and (3.4), respectively. It is worth noting that
 $\overline{\unicode[STIX]{x1D706}}_{r}=\hat{\unicode[STIX]{x1D706}}_{r}$
, so the nonlinear refraction term
 $\propto \!\hat{\unicode[STIX]{x1D6FF}}$
plays no role in the stability of the beam. In addition, is it easy to verify that (3.8) does not depend on the sign of
 $\overline{u}$
. Thus, for a given envelope profile
 $Q(H)$
, the growth rates are symmetric in
 $\overline{u}$
. On the other hand, in view of (2.5), for a given wave source, the envelope profile
 $Q(H)$
will differ depending on the sign of
 $\overline{u}$
, but these effects will be small given the small mean flow (viz. (2.10)).
Turning next to the case
 $|\hat{u} |>1$
, the solution to (3.3) in each region where
 $Q$
is constant can again be readily obtained and has similar form as (3.6). However, upon matching these piecewise solutions, it is concluded that no non-trivial solutions exist with
 $\hat{\unicode[STIX]{x1D706}}_{r}>0$
. Therefore, all disturbances are stable, regardless of viscosity. For
 $|\hat{u} |=1$
, it is also readily shown by returning to (3.3) that no unstable solutions exist either. Therefore, PSI only exists when
 $|\hat{u} |<1$
, or equivalently,
 $$\begin{eqnarray}\unicode[STIX]{x1D705}<\left|\frac{c}{\overline{u}\sin \unicode[STIX]{x1D703}}\right|.\end{eqnarray}$$
Importantly, this condition arises only for finite beam width
 $D$
and, in view of the group velocity terms in (2.14), can be physically interpreted as a requirement that the two subharmonic wavepackets propagate in opposite directions. Furthermore, equation (3.9) suggests that the range of possible unstable wavenumbers shrinks to zero as
 $\overline{u}\rightarrow \infty$
, consistent with the arguments made later (see § 5) that no instability is possible for a dimensionless mean flow of
 $O(1)$
magnitude. Although derived for the top-hat profile, it is possible to show that the necessary condition for instability (3.9) holds for any profile with compact support, by using a similar piecewise solution procedure as above (B. Fan, PhD thesis in preparation).
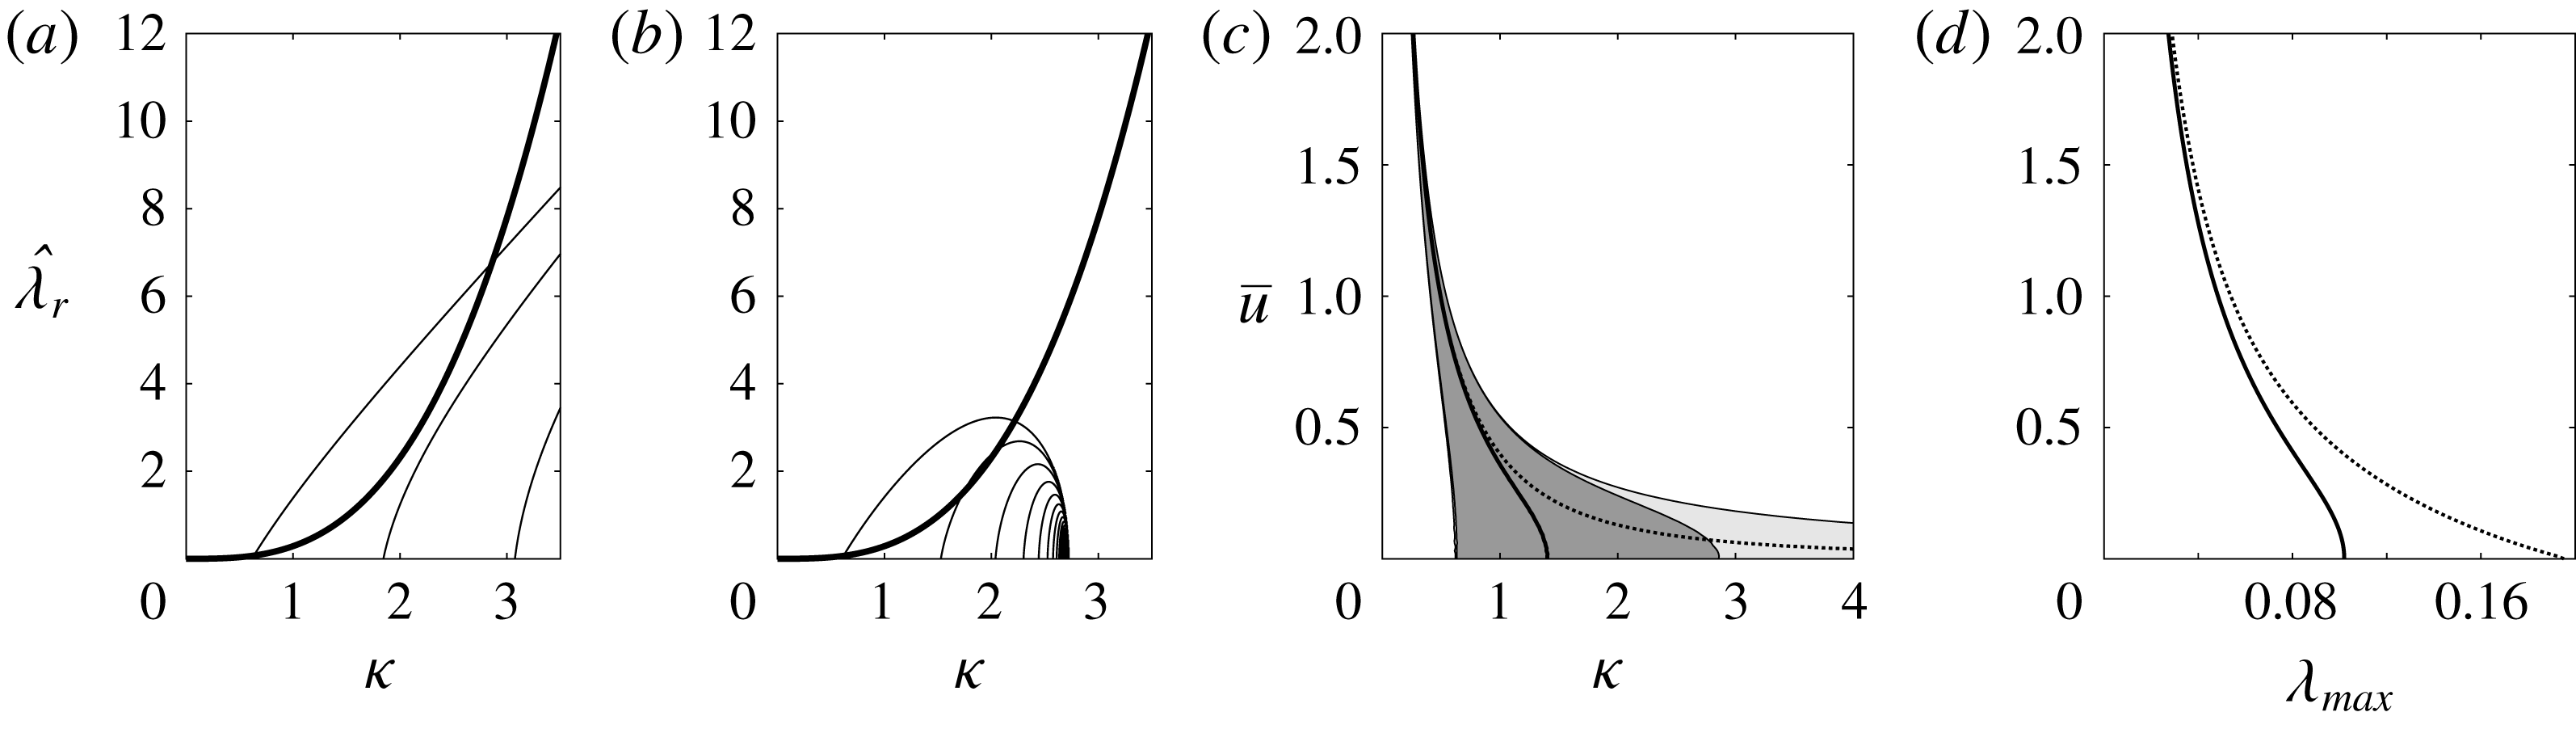
Eigenvalues and growth rates for the top-hat profile with
 $\unicode[STIX]{x1D703}=\unicode[STIX]{x03C0}/4$
,
 $\unicode[STIX]{x1D716}=0.3$
,
 $\unicode[STIX]{x1D708}=0.004$
, and
 $D=5$
. When varying
 $\overline{u}$
, the beam inclination angle
 $\unicode[STIX]{x1D703}$
was fixed. (a) Plot of the real eigenvalue branches
 $\hat{\unicode[STIX]{x1D706}}_{r}(\unicode[STIX]{x1D705})$
for
 $\overline{u}=0$
(thin lines), as well as the cubic
 $\unicode[STIX]{x1D6FC}D\unicode[STIX]{x1D705}^{3}/c$
(thick line) that controls viscous dissipation. Instability arises if
 $\hat{\unicode[STIX]{x1D706}}_{r}>\unicode[STIX]{x1D6FC}D\unicode[STIX]{x1D705}^{3}/c$
. (b) Same as (a), but for
 $\overline{u}=0.2$
. (c) Range of unstable wavenumbers (shaded in dark grey) as
 $\overline{u}$
is varied. The wavenumber with the maximum growth rate is indicated by the thick black line. The corresponding range for
 $\unicode[STIX]{x1D708}=0$
is shown in light grey (which completely contains the dark grey region), with the maximum growth rate locus indicated by the dotted line. (d) Plot of the maximum PSI growth rate
 $\unicode[STIX]{x1D706}_{max}$
as a function of
 $\overline{u}$
. The corresponding growth rates for
 $\unicode[STIX]{x1D708}=0$
are plotted with the dotted line.

4 Results
We now present stability results based on the characteristic equation (3.8) for the specific parameter values
 $\unicode[STIX]{x1D703}=\unicode[STIX]{x03C0}/4$
,
 $\unicode[STIX]{x1D716}=0.3$
,
 $\unicode[STIX]{x1D708}=0.004$
,
 $D=5$
, and various
 $\overline{u}\geqslant 0$
(for example, for
 $\unicode[STIX]{x1D708}_{\ast }=10^{-6}~\text{m}^{2}~\text{s}^{-1}$
, corresponding to water, and
 $N_{\ast }=1~\text{rad}~\text{s}^{-1}$
, taking
 $\unicode[STIX]{x1D708}=0.004$
implies
 $\unicode[STIX]{x1D6EC}_{\ast }\approx 10$
cm). These values are representative of laboratory flow conditions (see, for example, Bourget et al.
Reference Bourget, Scolan, Dauxois, Le Bars, Odier and Joubaud2014). Earlier analyses of finite-width PSI with no mean flow (Bourget et al.
Reference Bourget, Scolan, Dauxois, Le Bars, Odier and Joubaud2014; Karimi & Akylas Reference Karimi and Akylas2014) focused on the importance of the width
 $D$
, and in particular, the existence of a critical value
 $D=D_{c}$
below which no PSI is possible (Karimi & Akylas Reference Karimi and Akylas2014). As the emphasis here is on the effects of the background mean flow
 $\overline{u}$
on PSI growth, we take
 $D=5$
such that
 $D>D_{c}\approx 2$
for the chosen parameters. Furthermore, as
 $\overline{u}$
is varied, the beam inclination angle
 $\unicode[STIX]{x1D703}$
is kept fixed and the forcing frequency
 $\unicode[STIX]{x1D714}_{0}$
is allowed to adjust accordingly via (2.4), as opposed to the other way around. This makes it possible to compare the effect of the mean flow for a fixed primary wave beam, although given the small mean flow, both choices produce qualitatively similar results. Figure 2(a,b) shows the eigenvalue branches
 $\hat{\unicode[STIX]{x1D706}}_{r}$
as functions of
 $\unicode[STIX]{x1D705}$
for
 $\overline{u}=0$
and
 $\overline{u}=0.2$
, as well as the cubic
 $\unicode[STIX]{x1D6FC}D\unicode[STIX]{x1D705}^{3}/c$
. It is clear that as a whole, the addition of the background mean flow has decreased the eigenvalues and therefore reduced the growth rates for PSI.
For
 $\overline{u}=0$
(figure 2
a), equation (3.8) admits a countably infinite number of eigenvalue branches that bifurcate at discrete non-zero values along the
 $\unicode[STIX]{x1D705}$
-axis. As shown by Karimi & Akylas (Reference Karimi and Akylas2014), when
 $\unicode[STIX]{x1D705}$
is much greater than the first bifurcation point, the first eigenvalue branch (lowest mode) has the highest growth rate and behaves as
 $\hat{\unicode[STIX]{x1D706}}_{r}\sim D\unicode[STIX]{x1D6FE}\unicode[STIX]{x1D705}/(2c)$
. Therefore, for non-zero viscosity, the cubic
 $\unicode[STIX]{x1D6FC}D\unicode[STIX]{x1D705}^{3}/c$
will always exceed
 $\hat{\unicode[STIX]{x1D706}}_{r}$
for large enough
 $\unicode[STIX]{x1D705}$
, restricting unstable wavenumbers to a finite range of
 $\unicode[STIX]{x1D705}$
. In the inviscid limit (
 $\unicode[STIX]{x1D6FC}=0$
), there is then no upper bound to the range of unstable wavenumbers. On the other hand, for
 $\overline{u}=0.2$
(figure 2
b), there exists an upper bound on the range of eigenvalues with positive
 $\hat{\unicode[STIX]{x1D706}}_{r}$
, suggesting that very short-scale perturbations are stabilized by the mean flow even in the absence of viscosity. This can be understood in view of the necessary condition for instability (3.9) noted earlier. Moreover, for the top-hat profile (3.5), the first bifurcation point can be found analytically
 $$\begin{eqnarray}\unicode[STIX]{x1D705}=\frac{\unicode[STIX]{x03C0}c}{\sqrt{D^{2}\unicode[STIX]{x1D6FE}^{2}+\unicode[STIX]{x03C0}^{2}\overline{u}^{2}\sin ^{2}\unicode[STIX]{x1D703}}},\end{eqnarray}$$
and provides a lower bound to the unstable range of wavenumbers.
Figure 2(c,d) plots the range of unstable wavenumbers as well as the maximum PSI growth rates for various values of
 $\overline{u}$
, indicating that the presence of mean flow significantly shrinks the range of unstable wavenumbers and decreases the PSI growth rates. For instance, according to figure 2(d) the maximum instability growth rate is cut approximately in half by taking
 $\overline{u}=1$
, which corresponds to a dimensional mean flow of approximately
 $9~\text{mm}~\text{s}^{-1}$
. However, in spite of this dramatic weakening of PSI, the mean flow never completely eliminates the instability, as there always exists a small but finite range of unstable wavenumbers for any
 $\overline{u}$
(figure 2
c). We suspect that this is a limitation of our asymptotic theory as the unstable wavenumber range shifts towards
 $\unicode[STIX]{x1D705}\ll 1$
when
 $\overline{u}$
is increased, in keeping with (3.9), invalidating the scaling assumptions made earlier.
While the mean flow weakens PSI for beams with
 $D>D_{c}$
, as shown by the above example, it is also possible with the addition of sufficient mean flow to induce PSI for beams with
 $D<D_{c}$
that would be entirely stable in the absence of mean flow. To explain this apparent anomaly, we note that increasing
 $\overline{u}$
decreases the lower bound for instability, namely (4.1), and shifts the range of unstable wavenumbers to smaller
 $\unicode[STIX]{x1D705}$
(as seen in figure 2
c). Because the effects of viscous dissipation are weaker for smaller
 $\unicode[STIX]{x1D705}$
, it is now possible for these low-wavenumber modes to overcome viscous damping and lead to PSI. However, this mean-flow-induced PSI is extremely weak. For instance, using the same parameters as in figure 2 (
 $\unicode[STIX]{x1D703}=\unicode[STIX]{x03C0}/4$
,
 $\unicode[STIX]{x1D716}=0.3$
,
 $\unicode[STIX]{x1D708}=0.004$
) but with
 $D=1.5<D_{c}\approx 2$
, the maximum PSI growth rate attained as
 $\overline{u}$
is varied is
 $\unicode[STIX]{x1D706}_{max}\approx 0.01$
, while the range of unstable wavenumbers (difference in
 $\unicode[STIX]{x1D705}$
) is quite narrow (approximately 0.1).
5 Concluding remarks
We have studied the effect of a background constant horizontal mean flow on the PSI of finite-width nearly monochromatic internal wave beams. As in Karimi & Akylas (Reference Karimi and Akylas2014), the subharmonic perturbations are in the form of short-scale wavepackets that are modulated by the underlying beam and can also extract energy via resonant triad interactions. In order for the advection by the mean flow to be as important as the propagation of such disturbances with their group velocity across the beam, and to also achieve a balance with the effects of triad nonlinearity and viscous dissipation, it is necessary to take the mean flow to be small. This distinguished limit is governed by the same evolution equations as those derived in Karimi & Akylas (Reference Karimi and Akylas2014), with the exception of a mean flow term that affects the group velocity of the subharmonic perturbations. This new term stabilizes very short-scale perturbations in keeping with the necessary condition for instability (3.9), and thus shifts the most unstable disturbance to longer wavelengths even for inviscid or nearly inviscid flow conditions. Physically, this necessary condition implies that unstable perturbations must propagate in opposite directions across the beam in order for PSI to arise in the presence of the mean flow. As a result, it is possible for a small amount of mean flow to weaken PSI dramatically. These results are unique to finite-width beams (
 $D$
finite in (2.14)), as the background mean flow has no effect on the PSI of a purely sinusoidal plane wave once the Doppler shift of the wave frequency has been taken into account (viz. (2.4)).
It is worth mentioning that for
 $O(1)$
mean flow (i.e.
 $\overline{u}=O(1)$
instead of
 $\overline{u}=O(\unicode[STIX]{x1D716}^{1/2})$
in (2.10)), it is still possible to balance the mean flow advection of subharmonic perturbations and nonlinear energy transfer over the same
 $O(\unicode[STIX]{x1D716}^{-1})$
time scale by assuming a larger beam envelope scale, namely
 $1/\unicode[STIX]{x1D707}=1/\unicode[STIX]{x1D716}$
instead of
 $1/\unicode[STIX]{x1D707}=1/\unicode[STIX]{x1D716}^{1/2}$
in (2.8). The evolution equations obtained under these alternative scalings are nearly identical to (2.14) with the exception that the effect of the group velocity is rendered negligible relative to the advection by the mean flow. As a result, the perturbations are advected in the same direction across the beam and, according to the necessary condition for PSI noted above, no instability is possible in this instance.
The present theory assumes waves with nearly monochromatic spatial profile and ignores the effects of background rotation. These flow conditions preclude direct comparisons with oceanic internal waves, although a rough estimate for the dimensional mean flow strength needed to impact PSI can still be obtained. Using
 $\unicode[STIX]{x1D703}=\unicode[STIX]{x03C0}/4,\unicode[STIX]{x1D716}=0.3$
, and
 $D=5$
as in § 4, but with the choice
 $\unicode[STIX]{x1D708}\approx 0$
relevant to the oceanic case, the maximum instability growth rate is cut approximately in half by taking
 $\overline{u}=0.5$
, which corresponds to a rather small dimensional mean flow of approximately
 $2~\text{cm}~\text{s}^{-1}$
(using
 $N_{\ast }=10^{-3}~\text{s}^{-1}$
and
 $\unicode[STIX]{x1D6EC}_{\ast }=500$
m as representative oceanic values). A separate theory that accounts for background mean flow in the presence of rotation and focuses on near-inertial PSI, which is most relevant to oceanic internal waves, will be presented elsewhere.
Acknowledgements
This work was supported in part by the US National Science Foundation under grant DMS-1512925 and a Graduate Research Fellowship (grant 1122374) to B.F.