Introduction
Geochronology is fundamental to geological research, and the U-Th-Pb system is particularly valued for its well-established analytical framework and wide applicability (Abduriyim and Kitawaki, Reference Abduriyim and Kitawaki2006; Chew et al., Reference Chew, Petrus and Kamber2014). Recent advances in in situ microanalytical techniques have further improved the efficiency of these analytical methods. Laser ablation-inductively coupled plasma-mass spectrometry (LA-ICP-MS) is now the most widely used approach for geochronology, owing to its high throughput, comparatively low capital cost, and minimal sample preparation (Li et al., Reference Li, Liu, Liu, Su, Sun, Huang and Yi2015; Chen et al., Reference Chen, Hu, Jia, Li, Li, Li, Li, Long, Tang and Xia2021; Luo and Hu, Reference Luo and Hu2022). Although zircon remains the principal phase for U-Pb geochronology, its absence, or poor crystallinity in certain lithologies such as highly evolved alkaline systems or ultramafic-mafic suites can limit its utility. Accordingly, U-Th-Pb age determination using LA-ICP-MS has been extended increasingly to other accessory minerals, including apatite (Chew et al., Reference Chew, Sylvester and Tubrett2011; Apen et al., Reference Apen, Wall, Cottle, Schmitz, Kylander-Clark and Seward2022; Metcalfe et al., Reference Metcalfe, Strachan, Darling, Fowler, Chapman and Dunlop2024), titanite (Yuan et al., Reference Yuan, Sun, Zhao, Fan, Hu and Zhan2016), garnet (Wang et al., Reference Wang, Zhang, Zhang, Liang, Kong, Hu, Wang, Wang and Cai2022, Reference Wang, Cao, Zhang, Yi, Hu, Yang, Cai, Zhang, Yuan and Pan2023), rutile (Zhang et al., Reference Zhang, Wu, Tu, Wu, Li, Xia and Ren2019), monazite (Aleinikoff et al., Reference Aleinikoff, Schenck, Plank, Srogi, Fanning, Kamo and Bosbyshell2006; Zhang et al., Reference Zhang, Zhao, Liu, Pan, Zhu, Liu and Zhang2022), and calcite (Zhang et al., Reference Zhang, Zhu, Xie, Wang, Kamo, Rochín-Bañaga and Xiao2023), thereby complementing and in some cases substituting for zircon-based geochronology.
Allanite [(Ca,REE,Th)2(Fe,Al)3[Si2O7][SiO4]O(OH)] is a common accessory mineral in magmatic, metamorphic and hydrothermal systems, and remains stable over a wide range of pressure-temperature conditions (Gieré and Sorensen, Reference Gieré and Sorensen2004; Gregory et al., Reference Gregory, Rubatto, Hermann, Berger and Engi2012; Fu et al., Reference Fu, Sun, Li, Lin and Lai2017). It may host >90% of the light rare earth element (LREE) budget of a rock, incorporate Th4+ efficiently, and can be enriched in U4+, making it a suitable phase for U-Th-Pb geochronology (Hermann, Reference Hermann2002; Guo, Reference Guo2014). With continued improvements in in situ microanalysis, LA-ICP-MS allanite age-determination has advanced alongside the development of allanite reference materials (Table 1). Most available allanite reference materials, however, contain substantial common Pb (‘common Pb’ is Pb of non radiogenic origin) from ∼5–90%, which can compromise calibration and age accuracy (Luo et al., Reference Luo, Wang, Zhu, Qing and Hu2025b). Zircon reference materials typically contain low levels of common Pb and are more readily available than allanite. Hence, coupled with their stable behaviour during laser ablation (Nasdala et al., Reference Nasdala, Corfu, Valley, Spicuzza, Wu, Li, Yang, Fisher, Münker, Kennedy, Reiners, Kronz, Wiedenbeck, Wirth, Chanmuang, Zeug, Váczi, Norberg, Häger, Kröner and Hofmeister2016), they are increasingly being used for non-matrix-matched calibration (e.g. zircon reference materials 91500 and GJ-1) yielding credible allanite U-Th-Pb ages in multiple studies (Darling et al., Reference Darling, Storey and Engi2012; Fu et al., Reference Fu, Sun, Li, Lin and Lai2017; Stumpf et al., Reference Stumpf, Skrzypek and Stüwe2024). However, the overall reliability and limitations of this strategy have not yet been evaluated systematically.
Summary of international reference materials for allanite U-Th-Pb geochronology

Table 1 Long description
The table lists nine allanite reference materials used for uranium thorium lead geochronology, giving each sample’s age in millions of years, analytical method, uranium and thorium concentrations, common lead fractions for lead 206 and lead 208, and literature sources. Ages range from about 30 million years for Bona and SISS to about 2646 million years for LE40010, with intermediate ages near 275 million years for AVC and CAP, about 288 million years for Mucrone, about 336 million years for ASP, about 415 million years for Tara, and about 1530 million years for AMK. Methods include isotope dilution thermal ionization mass spectrometry using either lead 208 over thorium 232 or lead 206 over uranium 238, and sensitive high resolution ion microprobe using lead 208 over thorium 232. Thorium is generally much higher than uranium for the younger lead 208 over thorium 232 materials, reaching roughly 9000 to 30,000 micrograms per gram, while uranium commonly spans tens to hundreds of micrograms per gram. Common lead fractions vary widely: Bona and SISS have high common lead 206 (about 55 to 88 percent) and moderate common lead 208 (about 12 to 25 percent), whereas AVC, CAP, and Tara show lower common lead 206 (about 12 to 30 percent) and very low common lead 208 (about 0.5 to 1.4 percent). Mucrone shows the broadest spread in common lead, from a few percent up to about 92 percent for lead 206 and up to about 64 percent for lead 208, indicating strong variability within that material. For the lead 206 over uranium 238 materials, LE40010 has very low common lead (about 0.51 percent for lead 206 and 0.13 percent for lead 208), AMK reports common lead 206 below 0.8 percent with no common lead 208 value listed, and ASP reports common lead 206 around 2.5 to 5.5 percent with no common lead 208 value listed. Some entries provide ranges while others provide single values or missing fields, so comparisons should consider differences in reporting style and method.
Notes: f206 is the amount of common 206Pb expressed as a fraction of the total 206Pb; f208 = is the proportion of common 208Pb. ID-TIMS = isotope dilution thermal ionization mass spectrometry; SHRIMP = sensitive high-resolution ion microprobe.
In this study, allanite from two Cretaceous granite plutons in the northern Taihang Mountains was selected to assess the feasibility and robustness of zircon-allanite non-matrix-matched LA-ICP-MS U-Th-Pb age determination. Using two zircon reference materials (91500 and Plešovice) and four laser spot sizes (24, 32, 44 and 60 μm), we systematically evaluate the influence of laser spot-size variation on age reproducibility and accuracy as the spot size is among the most easily reproducible parameters across different analytical setups. The regional geological evidence indicates the absence of post-magmatic hydrothermal alteration, therefore zircon and allanite from the same pluton in the northern Taihang Mountains are expected to yield concordant ages, providing a natural benchmark for method validation. Complementary LA-ICP-MS U-Pb age determination of coexisting zircon allows direct comparison of zircon and allanite ages from the same plutons, enabling a rigorous assessment of the non-matrix-matched approach and offering methodological guidance for its broader application.
Sample description and analytical methods
Geological setting
As one of the principal Archaean cratonic blocks, preserving crustal components as old as ca. 3.8 Ga, the North China Craton occupies a key position in studies of Precambrian continental evolution and the Phanerozoic tectonic framework of East Asia. Covering ∼1.5 million km2, this long-lived lithospheric domain provides an important record of the assembly and subsequent modification of the Chinese continental collage through multiple episodes of cratonisation and subsequent reactivation (Fig. 1a) (Duan et al., Reference Duan, Mao, Xie, Chen, Ma, Wang, Chen and Li2016; Tong et al., Reference Tong, Ye, Yang, Guo, Hou and Li2016; Zhang and Zhang, Reference Zhang and Zhang2016). The Taihang Orogen marks the boundary between the eastern and central segments of the North China Craton (Fig. 1b) and represents the westernmost expression of Mesozoic magmatism (Zhai and Santosh, Reference Zhai and Santosh2011). It extends for ∼700 km north-south and ∼50–100 km east-west, forming a key tectonic link between the Qinling-Dabie orogenic belt to the south and the Yanshan fold-and-thrust belt to the north (Xue et al., Reference Xue, Santosh, Tsunogae, Yang, Tan, Chen, Li and Xu2023).
Schematic map of the North China Craton and sampling locations. (a) Simplified tectonic map of the North China Craton, with the study area indicated by a boxed inset. (b) Distribution of Cretaceous granites in the northern Taihang Orogen, corresponding to the boxed area in (a) (modified after Zhai and Santosh, Reference Zhai and Santosh2011). (c) Sketch map showing the tectonic setting of the study area in (b).

Figure 1 Long description
Part a shows the region is in the North West of China. Part b shows patchy areas of Archean rocks in red with some large fault lines surrounding the area defining the cratonic block. Part c shows the rock types in detail and that the sampling for both samples was from granites. The area of the block is about 1000 km wide
The Wanganzhen pluton (N39°13′21″, E114°50′54″) crops out over ∼600 km2 and forms the north-eastern part of the Laiyuan magmatic complex. It represents the largest composite batholith in the northern sector of the Mesozoic magmatic belt of the Taihang Orogen. This multi-phase intrusive body records successive emplacement from the Late Jurassic to the Early Cretaceous, which has been subdivided into three stages (Chen et al., Reference Chen, Tian, Zhai and Arakawa2005, Reference Chen, Liu and Tian2006, Reference Chen, He and Ma2009). Lithologically, it is dominated by intermediate-to-felsic intrusive rocks, with subordinate coeval mafic intrusions and syn-magmatic volcanic units (Wang and Wang, Reference Wang and Wang1985; Wang, Reference Wang2013; Shen et al., Reference Shen, Hou, Yu, Chen, Li, Ma, Ge and Wang2015). The Heigoubei pluton (N39°26′56″, E113°51′15″) is exposed northwest of Wangzhuangpu, Hunyuan County, within the central segment of the north-south gravity-gradient zone. It consists of Early Cretaceous intrusions, is elongated in a NNW-SSE direction, and covers an exposed area of ∼40 km2 (Gao, Reference Gao2018; Zhang et al., Reference Zhang, Li and Lu2018; Zhao et al., Reference Zhao, Tang, Zheng, Yu, Cao, Wang and Zhou2019). Both plutons cooled rapidly after emplacement, and regional thermal-history constraints indicate no significant post-emplacement heating or thermal overprinting (Xu et al., Reference Xu, Ji, Tu and Hou2015; Lin et al., Reference Lin, Wang, Yang, Wang, Zhang, Yang and Shi2019; Zhao et al., Reference Zhao, Wei, Zhang, Yan, Gao and Du2024).
Sample description
Samples 10581-1 and 10426-1 were collected from two distinct Mesozoic magmatic belts within the northern Taihang Orogen, specifically from the Wanganzhen pluton and the Heigoubei granitic pluton, respectively. These representative samples were taken from fresh outcrops in the core zones of Yanshanian intrusive bodies. Sampling locations and field relationships are documented in Fig. 1c. Petrographic observations show that both samples are medium- to coarse-grained granites, in which allanite occurs as euhedral-to-subhedral crystals associated closely with major rock-forming minerals. In sample 10581-1 from the Wanganzhen pluton, allanite occurs as euhedral grains in association with amphibole, clinopyroxene, and quartz (Fig. 2a). Sample 10426-1 from the Heigoubei pluton, by comparison, contains euhedral allanite associated with biotite, amphibole, plagioclase and quartz (Fig. 2b). In both samples, allanite grains are embedded within the magmatic mineral assemblage and show no evidence of secondary alteration or resorption, supporting a primary magmatic origin.
Photomicrographs (plane-polarized light) of the Wanganzhen pluton (sample 10581-1) and the Heigoubei pluton (sample 10426-1). (a) Sample 10581-1, showing a mineral assemblage of clinopyroxene (Cpx), amphibole (Am), quartz (Qtz) and allanite (Aln). (b) Sample 10426-1, showing a mineral assemblage of Am, biotite (Bt), plagioclase (Pl), Qtz and Aln.

The collected granite samples (10581-1 and 10426-1) were crushed and subjected to standard mineral-separation procedures. The crushed material was concentrated by density separation to remove low-density phases, followed by magnetic separation to isolate magnetic fractions. Allanite and zircon were hand-picked using a binocular microscope, selecting well-formed grains free of visible fractures and inclusions. Selected grains were mounted in epoxy resin and progressively ground and polished to expose grain interiors. Both samples were characterised by transmitted- and reflected-light microscopy, and by scanning electron microscopy (SEM) with cathodoluminescence (CL) imaging. Representative CL images of allanite grains with size and locations of laser-ablation spots indicated are shown in Fig. 3. CL images of all analysed grains and spot locations are provided in Supplementary Fig. S1. The CL images indicate that the allanite grains display predominantly uniform internal textures, with no obvious zoning or alteration domains. No evidence of metamictization was observed, and all analytical spots were positioned away from visible cracks and inclusions.
CL images of allanite samples 10581-1 and 10426-1, with representative laser-ablation spot sizes and locations indicated. U-Pb age determination was performed at all four spot sizes, whereas trace-element analyses were conducted only at a beam diameter of 32 μm.

Analytical methods
Trace-element analysis of allanite
Trace-element analyses of allanite by LA-ICP-MS were carried out at the Key Laboratory of Palaeomagnetism and Tectonic Reconstruction, Ministry of Natural Resources (Beijing, China), using a GeoLasHD ArF excimer laser system (Coherent Inc.; 193 nm) coupled to an Agilent 7900 quadrupole ICP-MS (Agilent Technologies) (Wang et al., Reference Wang, Zhang, Zhang, Liang, Kong, Hu, Wang, Wang and Cai2022). Helium was used as the carrier gas and argon as the make-up gas to optimise sensitivity; the gases were mixed via a T-connector prior to entering the ICP torch. Each analysis lasted 80 s, comprising 20 s of background acquisition, 40 s of ablation and 20 s of washout. Operating conditions were a 32 μm spot size, a 5 Hz repetition rate, and a fluence of 5.0 J cm–2. All measured masses are listed in Supplementary Table S1, and the integration time for each was 6 ms. Detailed instrumental settings are provided in Table 2. NIST SRM 610 and NIST SRM 612 glass RMs (Jochum et al., Reference Jochum, Weis, Stoll, Kuzmin, Yang, Raczek, Jacob, Stracke, Birbaum, Frick, Günther and Enzweiler2011) were used for calibration and quality control, with NIST SRM 610 as the primary calibration standard and NIST SRM 612 as the monitoring standard (a semi-quantitative single-external-standard calibration method). A sample-standard bracketing protocol was adopted, whereby NIST SRM 610 and NIST SRM 612 were each analysed once after every eight unknown analyses. In total, five analyses of NIST SRM 610 were used as the external standard to quantify the elemental mass fractions for 32 unknown spots. Offline data reduction, including selection of background and signal intervals, correction for instrumental drift, and calculation of element concentrations, was performed using Iolite (Paton et al., Reference Paton, Hellstrom, Paul, Woodhead and Hergt2011) following the procedures described therein.
Principal operating conditions for LA-ICP-MS analyses

Table 2 Long description
The table lists operating conditions for a laser ablation system and an inductively coupled plasma mass spectrometer used together in LA-ICP-MS analysis. Laser ablation uses a 193 nm wavelength with an energy density of 5 joules per square centimeter and a stripping frequency of 5 hertz. The laser is set to 200 pulses and offers spot diameters of 24, 32, 44, or 60 micrometers. Helium gas flow for the laser ablation cell is 0.4 liters per minute. On the ICP-MS side, plasma flow is 15 liters per minute with RF output 1550 watts and RF match 1.8 volts. Sampling depth is 6.0 millimeters, dwell time per isotope is 6 milliseconds, and carrier gas flow rate is 0.8 liters per minute. Values are presented as fixed instrument settings and do not indicate performance outcomes or variability across samples.
U-Pb age determination of allanite and zircon
Allanite and zircon U-(Th)-Pb age determination by LA-ICP-MS was conducted at the Key Laboratory of Palaeomagnetism and Tectonic Reconstruction, Ministry of Natural Resources (Beijing, China). Analytical conditions were identical to those used for trace-element analyses of allanite, except for the laser spot diameter. For the non-matrix-matched allanite experiments, four spot sizes (24, 32, 44 and 60 μm) were employed, and the same spot size was used for both zircon reference materials and allanite unknowns within each run. To minimise potential bias associated with unequal analytical coverage, 32 spots were analysed for each spot-size condition. For verification of U-Pb analyses of zircon unknowns, a 32 μm spot size was used. Zircon 91500 (Wiedenbeck et al., Reference Wiedenbeck, Allé, Corfu, Griffin, Meier, Oberli, Quadt, Roddick and Spiegel1995) and Plešovice (Sláma et al., Reference Sláma, Košler, Condon, Crowley, Gerdes, Hanchar, Horstwood, Morris, Nasdala, Norberg, Schaltegger, Schoene, Tubrett and Whitehouse2008) were used as primary calibration materials for U-Pb age determination of both allanite and zircon. A sample-standard bracketing protocol was applied, with a sequence of two 91500 analyses followed by one Plešovice analysis after every eight unknown spots, to correct instrumental drift and mass bias and to monitor data quality. Zircon U-Pb data were reduced using ICPMSDataCal (Liu et al., Reference Liu, Hu, Gao, Günther, Xu, Gao and Chen2008) following the procedures described therein. Allanite U-(Th)-Pb data were reduced independently using Isoclock (Liu et al., Reference Liu, Zhao, Ulrich, Chen, Zhang, Li, Zhao, Zhang and Xia2023), with 91500 and Plešovice used in separate reductions as the primary calibrator to facilitate comparison between the two zircon standards. We applied a 207Pb-based correction (Luo et al., Reference Luo, Wang, Zhu, Qing and Hu2025b) to account for common Pb in allanite. Tera-Wasserburg concordia plots and 208Pb/232Th weighted-mean date diagrams for allanite, together with concordia plots and 206Pb/238U weighted-mean date plots for zircon, were generated using ISOPLOT 3.0 (Ludwig, Reference Ludwig2003).
Results
Trace elements of allanite
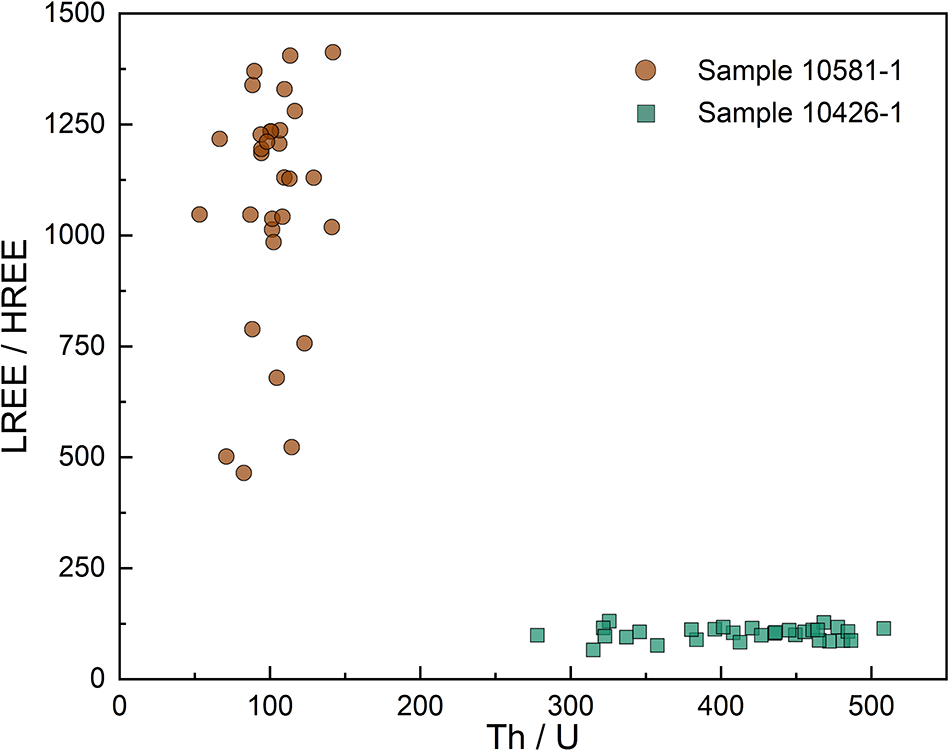
Trace-element contents of allanite were determined and are summarised in Table 3 (see Table S1 for the full dataset). Both samples (10581-1 and 10426-1) are strongly enriched in rare earth elements (ΣREE = 271,941 μg g–1 for 10581-1 and 264,511 μg g–1 for 10426-1), particularly the LREEs (La, Ce, Pr and Nd), as well as Th and U. The two samples display high La/Sm and Th/U ratios, but with marked differences between them: 10581-1 averages La/Sm = 162 and Th/U = 102, whereas 10426-1 yields La/Sm = 25.4 and Th/U = 413. Chondrite-normalised REE patterns are shown in Fig. 4. Both samples have pronounced negative Eu anomalies (Eu/Eu* = 0.12–0.45 for 10581-1 and 0.05–0.18 for 10426-1), where Eu* = (SmN+GdN)/2 and the subscript N denotes chondrite normalisation (Boynton, Reference Boynton and Henderson1984). Overall, the two allanites share broadly similar geochemical signatures of LREE enrichment, high Th/U, and negative Eu anomalies (Figs 4, 5), however 10581-1 has substantially higher La/Sm ratios (Table S1).
Chondrite-normalized REE patterns of allanite samples 10581-1 (a) and 10426-1 (b), with normalization values for chondritic meteorites after Boynton (Reference Boynton and Henderson1984).

Plot of Th/U versus light REE/heavy REE for allanite samples 10581-1 and 10426-1. LREE is calculated as the sum of La, Ce, Pr, Nd, Sm and Eu; HREE is calculated as the sum of Gd, Tb, Dy, Ho, Er, Tm, Yb, Lu and Y.

Figure 5 Long description
Sample 10581-1 is in red circles mostly plotting at 100 Th/U with varying LREE/HREE ratios. Sample 10426-1 is in green squares and plots in the bottom right corner at a very low LREE/HREE ratio but running from 300-500 Th/U
Summary of trace-element data for the two allanite samples (mean ± 2σ)

Table 3 Long description
The table reports average concentrations with two-sigma uncertainty for major oxides and trace elements in two allanite samples, 10581-1 and 10426-1. For major oxides, 10426-1 has higher Al2O3, SiO2, and TiO2, while 10581-1 is higher in MnO and FeO. Among trace elements, 10426-1 is strongly enriched in Y and many mid to heavy rare earth elements: Y is 556 micrograms per gram versus 82.2, Sm is 2165 versus 484, Gd is 775 versus 127, and Dy is 198 versus 19. Light rare earths are high in both samples; La is higher in 10581-1 at 119458 micrograms per gram versus 85904, while Ce is similar at about 130000 in both. Total rare earth content is comparable overall, about 271941 for 10581-1 and 264511 for 10426-1, indicating differences mainly in distribution rather than total abundance. 10581-1 has higher U at 59.8 versus 18.4, whereas 10426-1 has higher Th at 7535 versus 5853 and a much higher Th to U ratio. Derived ratios show 10581-1 has a much higher La to Sm ratio, consistent with stronger light rare earth enrichment relative to mid rare earths. Uncertainties are provided for most entries and should be considered when comparing values, especially where uncertainties are large, such as P in both samples.
Allanite U-Th-Pb age determination
Allanite U-Th-Pb analyses were performed using four laser spot sizes (24, 32, 44 and 60 μm), with zircon 91500 and Plešovice employed as external reference materials for age calibration. The results calibrated against zircon 91500 and Plešovice are reported in Tables S2 and S3, respectively.
Using zircon 91500 as the external standard, the 32 analyses of sample 10581-1 define well-constrained linear arrays on Tera-Wasserburg diagrams at all spot sizes (Fig. 6), spanning 238U/206Pb ratios of 1.56–38.19 and 207Pb/206Pb ratios of 0.25–0.97. Corresponding lower-intercept ages (interpreted as allanite crystallisation ages) are broadly consistent, yielding 128.0 ± 4.9 Ma (24 μm; Fig. 6a), 130.5 ± 7.8 Ma (32 μm; Fig. 6b), 133.3 ± 4.1 Ma (44 μm; Fig. 6c), and 135.0 ± 3.0 Ma (60 μm; Fig. 6d). Sample 10426-1 also shows an overall linear distribution, but the data are skewed towards low 238U/206Pb and relatively high 207Pb/206Pb, with most analyses plotting within 238U/206Pb = 0.08–22.91 and 207Pb/206Pb = 0.53–0.92. Two analyses (spots #4 and #19) plot anomalously and are characterised by elevated 204Pb, most likely reflecting ablation of fractures and/or inclusions. Excluding these outliers, the lower-intercept ages are 110.0 ± 26 Ma (24 μm; Fig. 6e), 110.0 ± 22 Ma (32 μm; Fig. 6f), 111.0 ± 16 Ma (44 μm; Fig. 6g) and 108.9 ± 9.9 Ma (60 μm; Fig. 6h).
U-Pb Tera-Wasserburg diagrams of allanite from Cretaceous granites in the northern Taihang Orogen obtained using different laser spot sizes (calibrated against zircon 91500). Panels (a–d) show results for sample 10581-1, and panels (e–h) show results for sample 10426-1. Spot sizes are 24 μm in (a, e), 32 μm in (b, f), 44 μm in (c, g), and 60 μm in (d, h). In the figure, the ellipses are defined by the U-Pb isotopic ratios of the analytical spots and their 2σ uncertainties. The length of the ellipse axis along the x-axis represents the value of the 238U/206Pb ratio of each analytical spot within its 2σ uncertainty, whereas the length of the ellipse axis along the y-axis represents the value of the 207Pb/206Pb ratio within its 2σ uncertainty. The curve shown as a solid line is the functional curve obtained by combining the two U-Pb decay equations, 206Pb = 238U (eλ238t − 1) and 207Pb = 235U (eλ235t − 1) and is referred to as the concordia curve. The straight dashed line is a linear regression line fitted through the centres of the error ellipses of the analytical spots, and is referred to as the discordia line. The shaded area around the dashed line represents the error envelope.

Figure 6 Long description
Intercept at 128.0 plus or minus 4.9 Ma N equals 32, MSWD equals 3.5 Zircon 91500-calibrated 10581-1 (24 micrometer) Intercept at 130.5 plus or minus 7.8 Ma N equals 32, MSWD equals 0.9 Zircon 91500-calibrated 10581-1 (32 micrometer) Intercept at 133.3 plus or minus 4.1 Ma N equals 32, MSWD equals 1.7 Zircon 91500-calibrated 10581-1 (44 micrometer) Intercept at 135.0 plus or minus 3.0 Ma N equals 32, MSWD equals 1.3 Zircon 91500-calibrated 10581-1 (60 micrometer) Intercept at 110.0 plus or minus 26 Ma N equals 30, MSWD equals 1.9 Zircon 91500-calibrated 10426-1 (24 micrometer) Intercept at 110.0 plus or minus 22 Ma N equals 31, MSWD equals 1.7 Zircon 91500-calibrated 10426-1 (32 micrometer) Intercept at 111.0 plus or minus 16 Ma N equals 32, MSWD equals 1.2 Zircon 91500-calibrated 10426-1 (44 micrometer) Intercept at 108.9 plus or minus 9.9 Ma N equals 31, MSWD equals 2.8 Zircon 91500-calibrated 10426-1 (60 micrometer) Eight scatter plots are arranged as (a) through (h). Each plot shows error ellipses, a dashed straight line and a shaded band around the dashed line. Each plot also shows a curved line with labels 2000 and 5000. Shared axes for all eight plots. The x-axis label is 238U/206Pb. The x-axis ranges from 0 to 60 with labeled ticks at 0, 10, 20, 30, 40, 50, 60. The y-axis label is 207Pb/206Pb. The y-axis ranges from 0.0 to 1.2 with labeled ticks at 0.0, 0.2, 0.4, 0.6, 0.8, 1.0, 1.2. Both axes are ratios and no units are shown. (a) 10581-1 (24 micrometer). Ellipses form a descending band from x near 5 to 10 with y near 0.9 to 1.0, through x near 15 to 25 with y near 0.6 to 0.7, to x near 25 to 35 with y near 0.4 to 0.5. (b) 10581-1 (32 micrometer). Ellipses cluster along a descending band mainly between x near 10 to 25 and y near 0.5 to 0.7, with a few ellipses extending toward x near 25 to 30 and y near 0.4 to 0.5. (c) 10581-1 (44 micrometer). Ellipses form a descending band from x near 10 to 15 with y near 0.7, through x near 15 to 25 with y near 0.5 to 0.6, to x near 25 to 35 with y near 0.25 to 0.4. (d) 10581-1 (60 micrometer). Ellipses form a descending band from x near 5 to 10 with y near 0.8 to 0.9, through x near 10 to 20 with y near 0.6 to 0.7, to x near 20 to 30 with y near 0.4 to 0.5. (e) 10426-1 (24 micrometer). Ellipses cluster mainly between x near 10 to 20 and y near 0.6 to 0.9. (f) 10426-1 (32 micrometer). Ellipses cluster mainly between x near 10 to 25 and y near 0.6 to 0.9. (g) 10426-1 (44 micrometer). Ellipses cluster mainly between x near 10 to 25 and y near 0.55 to 0.75. (h) 10426-1 (60 micrometer). Ellipses form a descending band mainly between x near 5 to 20 and y near 0.6 to 0.75, with a few ellipses near x around 20 to 25 and y around 0.55 to 0.6.
Calibration using zircon Plešovice yields comparable results (Fig. 7). For sample 10581-1, the analyses define a coherent array along the discordia, spanning 238U/206Pb ratios of 1.59–38.50 and 207Pb/206Pb ratios of 0.25–0.96, yielding lower-intercept ages of 123.9 ± 5.4 Ma (24 μm; Fig. 7a), 126.5 ± 7.7 Ma (32 μm; Fig. 7c) and 131.9 ± 4.0 Ma (44 μm; Fig. 7e). For sample 10426-1, the Plešovice-based results are similar to those obtained using zircon 91500, with 238U/206Pb = 0.081–22.92 and 207Pb/206Pb = 0.55–1.03, yielding lower-intercept ages of 100.0 ± 28 Ma (24 μm; Fig. 7b), 112.0 ± 21 Ma (32 μm; Fig. 7d) and 113.0 ± 15 Ma (44 μm; Fig. 7f). Overall, the Tera-Wasserburg lower-intercept ages show a modest increase with increasing spot size for sample 10581-1. In addition, the progressive reduction in ellipse size from 24 to 60 μm (Figs 6, 7) indicates improved analytical precision, consistent with reduced counting-statistical uncertainties and improved signal-to-noise ratios at larger spot diameters.
U-Pb Tera-Wasserburg diagrams of allanite from Cretaceous granites in the northern Taihang Orogen obtained using different laser spot sizes (calibrated against zircon Plešovice). Panels (a, c, e) show results for sample 10581-1, and panels (b, d, f) show results for sample 10426-1. Spot sizes are 24 μm in (a, b), 32 μm in (c, d), and 44 μm in (e, f).

Figure 7 Long description
Intercept at 123.9 plus or minus 5.4 Ma. N equals 32, MSWD equals 4.0. (a) Scatter plot with ellipse markers. Y-axis label: 207Pb over 206Pb (unitless isotope ratio). X-axis label: 238U over 206Pb (unitless isotope ratio). Y-axis tick labels: 0.0, 0.2, 0.4, 0.6, 0.8, 1.0, 1.2. X-axis tick labels: 0, 10, 20, 30, 40, 50, 60. Two diagonal reference lines are drawn, one dashed and one solid, with a broad shaded diagonal band. Text inside the plot reads: Zircon Plešovice-calibrated 10581-1 (24 micro-meter). Intercept at 100.0 plus or minus 28 Ma. N equals 30, MSWD equals 1.5. (b) Scatter plot with ellipse markers. Y-axis label: 207Pb over 206Pb (unitless isotope ratio). X-axis label: 238U over 206Pb (unitless isotope ratio). Y-axis tick labels: 0.0, 0.2, 0.4, 0.6, 0.8, 1.0, 1.2. X-axis tick labels: 0, 10, 20, 30, 40, 50, 60. Two diagonal reference lines are drawn, one dashed and one solid, with a broad shaded diagonal band. Text inside the plot reads: Zircon Plešovice-calibrated 10426-1 (24 micro-meter). Intercept at 126.5 plus or minus 7.7 Ma. N equals 32, MSWD equals 1.7. (c) Scatter plot with ellipse markers. Y-axis label: 207Pb over 206Pb (unitless isotope ratio). X-axis label: 238U over 206Pb (unitless isotope ratio). Y-axis tick labels: 0.0, 0.2, 0.4, 0.6, 0.8, 1.0, 1.2. X-axis tick labels: 0, 10, 20, 30, 40, 50, 60. Two diagonal reference lines are drawn, one dashed and one solid, with a broad shaded diagonal band. Text inside the plot reads: Zircon Plešovice-calibrated 10581-1 (32 micro-meter). Intercept at 112.0 plus or minus 21 Ma. N equals 31, MSWD equals 3.6. (d) Scatter plot with ellipse markers. Y-axis label: 207Pb over 206Pb (unitless isotope ratio). X-axis label: 238U over 206Pb (unitless isotope ratio). Y-axis tick labels: 0.0, 0.2, 0.4, 0.6, 0.8, 1.0, 1.2. X-axis tick labels: 0, 10, 20, 30, 40, 50, 60. Two diagonal reference lines are drawn, one dashed and one solid, with a broad shaded diagonal band. Text inside the plot reads: Zircon Plešovice-calibrated 10426-1 (32 micro-meter). Intercept at 131.9 plus or minus 4.0 Ma. N equals 32, MSWD equals 2.0. (e) Scatter plot with ellipse markers. Y-axis label: 207Pb over 206Pb (unitless isotope ratio). X-axis label: 238U over 206Pb (unitless isotope ratio). Y-axis tick labels: 0.0, 0.2, 0.4, 0.6, 0.8, 1.0, 1.2. X-axis tick labels: 0, 10, 20, 30, 40, 50, 60. Two diagonal reference lines are drawn, one dashed and one solid, with a broad shaded diagonal band. Text inside the plot reads: Zircon Plešovice-calibrated 10581-1 (44 micro-meter). Intercept at 113.0 plus or minus 15 Ma. N equals 32, MSWD equals 1.2. (f) Scatter plot with ellipse markers. Y-axis label: 207Pb over 206Pb (unitless isotope ratio). X-axis label: 238U over 206Pb (unitless isotope ratio). Y-axis tick labels: 0.0, 0.2, 0.4, 0.6, 0.8, 1.0, 1.2. X-axis tick labels: 0, 10, 20, 30, 40, 50, 60. Two diagonal reference lines are drawn, one dashed and one solid, with a broad shaded diagonal band. Text inside the plot reads: Zircon Plešovice-calibrated 10426-1 (44 micro-meter).
In addition, allanite commonly contains high Th concentrations, making it amenable to Th-Pb geochronology. Here we present a preliminary assessment of allanite Th-Pb age determination using zircon 91500 and Plešovice as alternative external calibrators. The analytical results and 208Pb/232Th weighted-mean date plots are provided in Tables S2, S3 and Fig. 8. When calibrated against zircon 91500, weighted-mean 208Pb/232Th ages for sample 10581-1 are 158.8 ± 2.9 Ma (Mean Square Weighted Deviation = 6.5; 24 μm), 129.5 ± 0.70 Ma (MSWD = 1.6; 32 μm), 153.8 ± 2.5 Ma (MSWD = 8.4; 44 μm), 135.2 ± 1.8 Ma (MSWD = 5.0; 60 μm). Corresponding ages for sample 10426-1 are 129.6 ± 1.6 Ma (MSWD = 3.0; 24 μm), 107.9 ± 0.96 Ma (MSWD = 2.0; 32 μm), 120.4 ± 0.76 Ma (MSWD = 1.2; 44 μm) and 108.1 ± 0.62 Ma (MSWD = 0.72; 60 μm). Calibration against zircon Plešovice yields broadly comparable 208Pb/232Th ages, with 147.7 ± 4.1 Ma (MSWD = 20; 24 μm), 130.0 ± 1.3 Ma (MSWD = 2.9; 32 μm), 148.6 ± 2.8 Ma (MSWD = 20; 44 μm) for sample 10581-1, and 123.4 ± 1.2 Ma (MSWD = 2.2; 24 μm), 110.1 ± 1.1 Ma (MSWD = 3.3; 32 μm) and 113.7 ± 0.56 Ma (MSWD = 0.93; 44 μm) for sample 10426-1. These results show a consistent pattern: Th-Pb ages obtained at 32 μm and 60 μm overlap, within analytical uncertainty, with the corresponding U-Pb ages (differences <2%). By contrast, Th-Pb ages obtained at 24 μm and 44 μm are decoupled from the U-Pb system, with discrepancies exceeding 10%.
208Pb/232Th weighted mean ages of allanite from Cretaceous granites in the northern Taihang Orogen calibrated against zircon 91500 (a, b) and Plešovice (c, d) using four laser spot sizes. Panels (a) and (c) show results for sample 10581-1, whereas panels (b) and (d) show results for sample 10426-1. In the figure, the centre of each vertical line represents the 208Pb/232Th age of the sample. This age corresponds to the value of t calculated from a series of measured U-Pb isotopic data using the decay equation: 208Pb = 232Th (eλ232t − 1). The length of each vertical line indicates the 2σ uncertainty range of the corresponding age. The horizontal line represents the weighted mean 208Pb/232Th age of these analytical spots. The red vertical lines indicate ages that fall outside the acceptable uncertainty range and were therefore excluded; these ages were not included in the calculation of the weighted mean age.

Figure 8 Long description
The image consists of four plots labeled (a), (b), (c) and (d), each representing Pb/Th ages of allanite samples calibrated against zircon 91500 and Plešovice. Plot (a) shows Sample 10581-1 calibrated with zircon 91500. The x-axis represents different laser spot sizes: 24 micrometers, 32 micrometers, 44 micrometers and 60 micrometers. The y-axis is labeled with age in million years (Ma), ranging from 150 to 210. The mean ages are 158.8 plus or minus 2.9 Ma, 129.5 plus or minus 0.70 Ma, 153.8 plus or minus 2.5 Ma and 135.2 plus or minus 1.8 Ma for each spot size, respectively. Red vertical lines indicate ages outside the acceptable uncertainty range. Plot (b) shows Sample 10426-1 calibrated with zircon 91500. The x-axis represents the same laser spot sizes and the y-axis ranges from 110 to 140 Ma. The mean ages are 129.6 plus or minus 1.6 Ma, 107.9 plus or minus 0.96 Ma, 120.4 plus or minus 0.76 Ma and 108.1 plus or minus 0.62 Ma. Red lines indicate excluded ages. Plot (c) shows Sample 10581-1 calibrated with zircon Plešovice. The x-axis represents laser spot sizes and the y-axis ranges from 140 to 180 Ma. The mean ages are 147.7 plus or minus 4.1 Ma, 130.0 plus or minus 1.3 Ma and 148.6 plus or minus 2.8 Ma. Red lines indicate excluded ages. Plot (d) shows Sample 10426-1 calibrated with zircon Plešovice. The x-axis represents laser spot sizes and the y-axis ranges from 105 to 125 Ma. The mean ages are 123.4 plus or minus 1.2 Ma, 110.1 plus or minus 1.1 Ma and 113.7 plus or minus 0.56 Ma. Red lines indicate excluded ages. Each plot includes vertical lines representing the 2 sigma uncertainty range, with horizontal lines indicating the weighted mean Pb/Th age.
Zircon U-Pb age determination
To assess the accuracy of the non-matrix-matched allanite U-Th-Pb ages, coexisting zircon from the same intrusions was analysed by LA-ICP-MS U-Pb geochronology. Thirty-one spots were analysed for each of samples 10581-1 and 10426-1, with the U-Pb isotopic data reported in Table S4.
For sample 10581-1, two discordant analyses (spots #20 and #25) were excluded, most likely due to ablation of micro-fractures and/or inclusions (Fig. 9a). The remaining 29 concordant analyses yield 206Pb/238U ages of 126–135 Ma, with 25 analyses clustering between 128 and 134 Ma (Fig. 9b). These data define a weighted-mean 206Pb/238U date of 132.0 ± 0.8 Ma (MSWD = 1.3; 95% confidence). For sample 10426-1, four analyses (spots #4, #7, #8 and #30) were rejected on geochemical and concordance criteria. Spots #4 and #7 yield anomalously old 206Pb/238U ages (>118 Ma), plausibly reflecting inherited zircon domains. Spots #8 and #30 show <90% concordance, consistent with radiation damage and/or secondary alteration (Fig. 9c). The remaining coherent population (n = 27) yields 206Pb/238U ages of 107–115 Ma, with 22 analyses concentrated between 108 and 112 Ma (Fig. 9d), giving a weighted-mean date of 110.3 ± 0.8 Ma (MSWD = 1.9; 95% confidence).
U-Pb concordia ages and weighted mean ages of zircons from Cretaceous granites in the northern Taihang Orogen. Samples 10581-1 are in (a), (b), samples 10426-1 are in (c), (d). In the concordia diagrams (a, c), the ellipses are defined by the U-Pb isotopic ratios of the analytical spots and their 2σ uncertainties. The length of the ellipse axis along the x-axis represents the 207Pb/235U value of each analytical spot within its 2σ uncertainty, whereas the length of the ellipse axis along the y-axis represents the 206Pb/238U value within its 2σ uncertainty. The dashed ellipses indicate the rejected data points. In the weighted mean age diagrams (b, d), the centre of each vertical line represents the 206Pb/238U age of the sample. This age corresponds to the value of t calculated from a series of measured U-Pb isotopic data using the decay equation: 206Pb = 238U (eλ238t − 1) The length of each vertical line indicates the 2σ uncertainty range of the corresponding age. The horizontal line represents the weighted mean 206Pb/238U age of these analytical spots.

Figure 9 Long description
The image consists of four diagrams labeled (a), (b), (c) and (d). Diagram (a) is a concordia plot for sample 10581-1, showing ellipses representing U-Pb isotopic ratios with 2 sigma uncertainties. The x-axis is labeled 207Pb/235U, ranging from 0.0 to 0.6 and the y-axis is labeled 206Pb/238U, ranging from 0.010 to 0.030. Two dashed ellipses, labeled 20 and 25, indicate rejected data points. The weighted mean 206Pb/238U age is 132.0 ± 0.8 Ma with 95 percent confidence, N=29, MSWD=1.3. Diagram (b) is a weighted mean age plot for the same sample, with vertical lines representing individual ages and uncertainties, centered around 132 Ma. Diagram (c) is a concordia plot for sample 10426-1, with similar axes as (a). It shows ellipses with some dashed, labeled 04, 08 and 30, indicating rejected data points. The weighted mean 206Pb/238U age is 110.3 ± 0.8 Ma with 95 percent confidence, N=27, MSWD=1.9. Diagram (d) is a weighted mean age plot for sample 10426-1, with vertical lines centered around 110 Ma, showing individual ages and uncertainties.
Discussion
Genesis of allanites from Cretaceous granite in the Northern Taihang Orogen
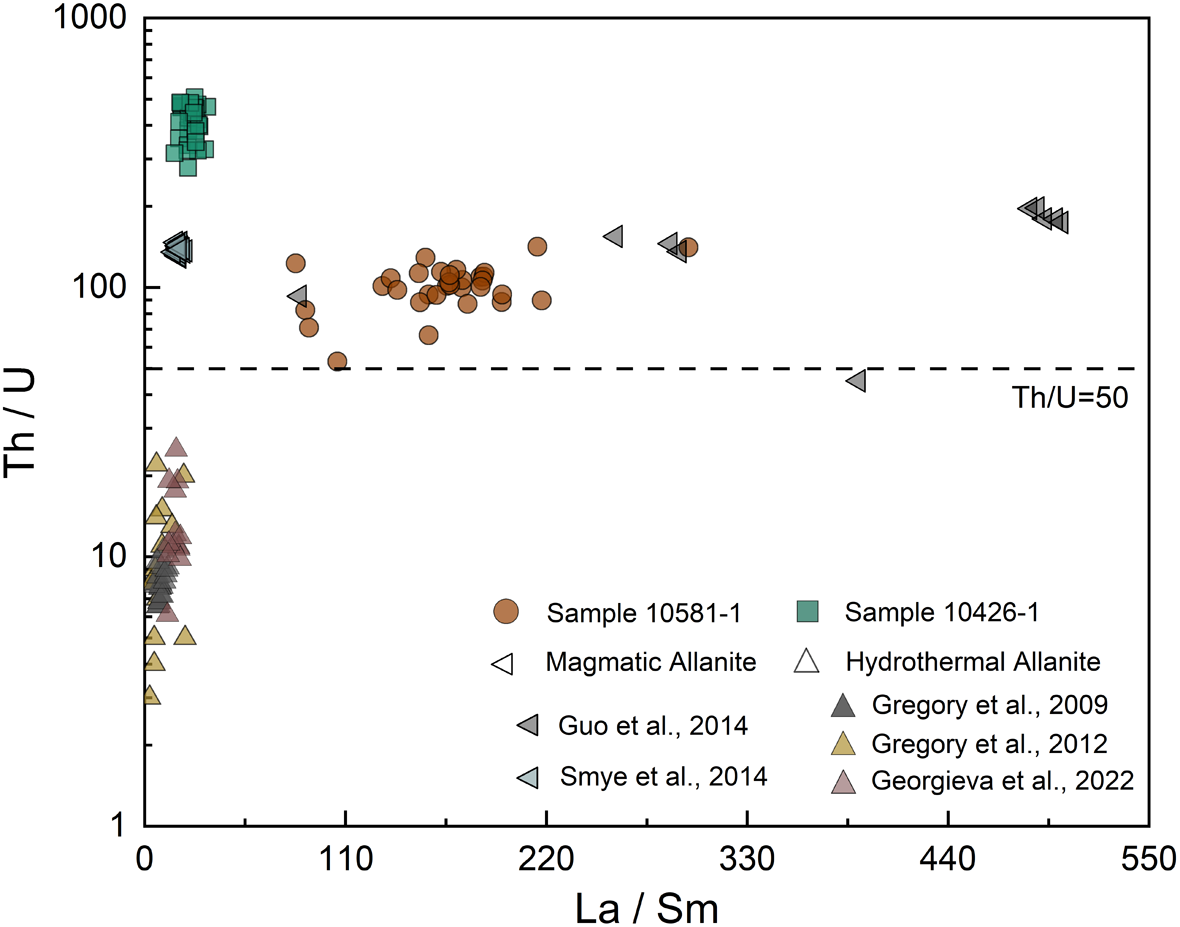
Allanite genesis is commonly described in terms of two end-member processes: (1) magmatic crystallisation from intermediate to felsic melts (Barth et al., Reference Barth, Oberli and Meier1994; Gregory et al., Reference Gregory, Rubatto, Allen, Williams, Hermann and Ireland2007); and (2) hydrothermal growth linked to metasomatism in fluid-dominated systems (Rubatto et al., Reference Rubatto, Müntener, Barnhoorn and Gregory2008; Gabudianu Radulescu et al., Reference Gabudianu Radulescu, Rubatto, Gregory and Compagnoni2009). Magmatic allanite is typically characterised by high Th/U ratios (commonly >50), pronounced LREE enrichment expressed by elevated La/Sm ratios (commonly >50), and strong negative Eu anomalies (Eu/Eu* <0.5) (Gregory et al., Reference Gregory, Rubatto, Hermann, Berger and Engi2012; Guo et al., Reference Guo, Xiao, Gu, Jian, Hou and Liu2014). These signatures essentially reflect magmatic differentiation and mineral-melt partitioning. Thorium is strongly compatible in allanite owing to its preferential incorporation into the A-site of the epidote-group structure. By contrast, uranium tends to remain relatively mobile in melt and/or coexisting fluids, particularly under comparatively oxidising magmatic conditions, producing characteristically high Th/U ratios (Hermann, Reference Hermann2002; Gieré and Sorensen, Reference Gieré and Sorensen2004). Allanite also has much higher partition coefficients for the LREEs than for the MREEs (Sm to Ho), leading to high La/Sm ratios, especially during crystallisation from evolved, LREE-enriched melts (Beard et al., Reference Beard, Sorensen and Gieré2006; Bea et al., Reference Bea, Gallastegui, Montero, Molina, Scarrow, Cuesta and González-Menéndez2021). Negative Eu anomalies in magmatic allanite are commonly inherited from the residual melt and reflect prior or coeval plagioclase fractionation, as plagioclase preferentially incorporates Eu2+ and thus depletes the melt in Eu (Gieré and Sorensen, Reference Gieré and Sorensen2004; Bea et al., Reference Bea, Gallastegui, Montero, Molina, Scarrow, Cuesta and González-Menéndez2021).
Establishing a magmatic origin for allanite is crucial for comparison with zircon from the same granitoids and for the non-matrix-matched calibration strategy applied in this study. As shown in Fig. 10 and Table S1, both samples exhibit high Th/U ratios and pronounced LREE enrichment. They are clearly distinct from hydrothermal allanite (Gregory et al., Reference Gregory, Buick, Hermann and Rubatto2009, Reference Gregory, Rubatto, Hermann, Berger and Engi2012; Georgieva et al., Reference Georgieva, Vassileva, Milenkov and Stefanova2022) and instead plot with previously reported magmatic allanite compositions (Guo et al., Reference Guo, Xiao, Gu, Jian, Hou and Liu2014; Syme et al., Reference Smye, Roberts, Condon, Horstwood and Parrish2014). Although La/Sm ratios >50 are not universal among magmatic allanites, Th/U has been shown to provide a more robust discriminator between magmatic and hydrothermal origins (Gregory et al., Reference Gregory, Rubatto, Hermann, Berger and Engi2012). Accordingly, despite its comparatively lower La/Sm ratio, sample 10426-1 is interpreted as magmatic on the basis of its exceptionally high Th/U ratio. Petrographic relationships (Fig. 2) further show allanite occurring in association with magmatic minerals in both samples. Together, these lines of evidence demonstrate that allanite in both samples is magmatic, providing a sound basis for direct comparison with zircon.
La/Sm versus Th/U diagram comparing samples 10581-1 and 10426-1 with other magmatic allanite (Guo et al., Reference Guo, Xiao, Gu, Jian, Hou and Liu2014; Smye et al., Reference Smye, Roberts, Condon, Horstwood and Parrish2014) and hydrothermal allanite (Gregory et al., Reference Gregory, Buick, Hermann and Rubatto2009, Reference Gregory, Rubatto, Hermann, Berger and Engi2012; Georgieva et al., Reference Georgieva, Vassileva, Milenkov and Stefanova2022).

Figure 10 Long description
Sample 10426-1 is in green squares and stands out from the others in the top left of the high Th/U, low La/Sm area. Sample 10581-1 is in red circles and is consistently above the Th/U ratio of 50, but varies from around La/Sm 110 to 330. See caption and text for information on how the other data compares in this plot
Influence of common Pb dispersion on Tera-Wasserburg regression and age precision
Common Pb is a critical factor in allanite U-Th-Pb geochronology because it can strongly influence the geometry of Tera-Wasserburg arrays and the robustness of discordia regression. During magmatic differentiation, allanite may co-crystallise with Pb-enriched phases such as K-feldspar and plagioclase, which preferentially sequester Pb from the melt. This geochemical partitioning significantly reduces Pb incorporation into the allanite crystal lattice (Gregory et al., Reference Gregory, Rubatto, Hermann, Berger and Engi2012). As a result, igneous allanite might have relatively low absolute Pb contents, yet its common-Pb proportion can be appreciable where allanite forms under melt-poor conditions (low melt fraction) and/or undergoes subsolidus re-equilibration, which promotes a higher contribution from initial (non-radiogenic) Pb (Gregory et al., Reference Gregory, Rubatto, Hermann, Berger and Engi2012). The proportion of common Pb is commonly expressed as f206, defined as the fraction of total 206Pb that is common:
 \begin{equation*}f206 = \frac{{{\text{ }}_{\text{ }}^{206}{\text{Pb}}_{{c}}^{\text{ }}}}{{{\text{ }}_{\text{ }}^{206}{\text{P}}{{\text{b}}_{{\text{Total}}}}}} = \frac{{{\text{ }}_{\text{ }}^{207}{\text{Pb}}/{\text{ }}_{\text{ }}^{206}{\text{Pb}}_{{m}}^{\text{ }} - {\text{ }}_{\text{ }}^{207}{\text{Pb}}/{\text{ }}_{\text{ }}^{206}{\text{Pb}}_{\text{ }}^{\text{*}}}}{{{\text{ }}_{\text{ }}^{207}{\text{Pb}}/{\text{ }}_{\text{ }}^{206}{\text{Pb}}_{{c}}^{\text{ }} - {\text{ }}_{\text{ }}^{207}{\text{Pb}}/{\text{ }}_{\text{ }}^{206}{\text{Pb}}_{\text{ }}^{\text{*}}}}\end{equation*}
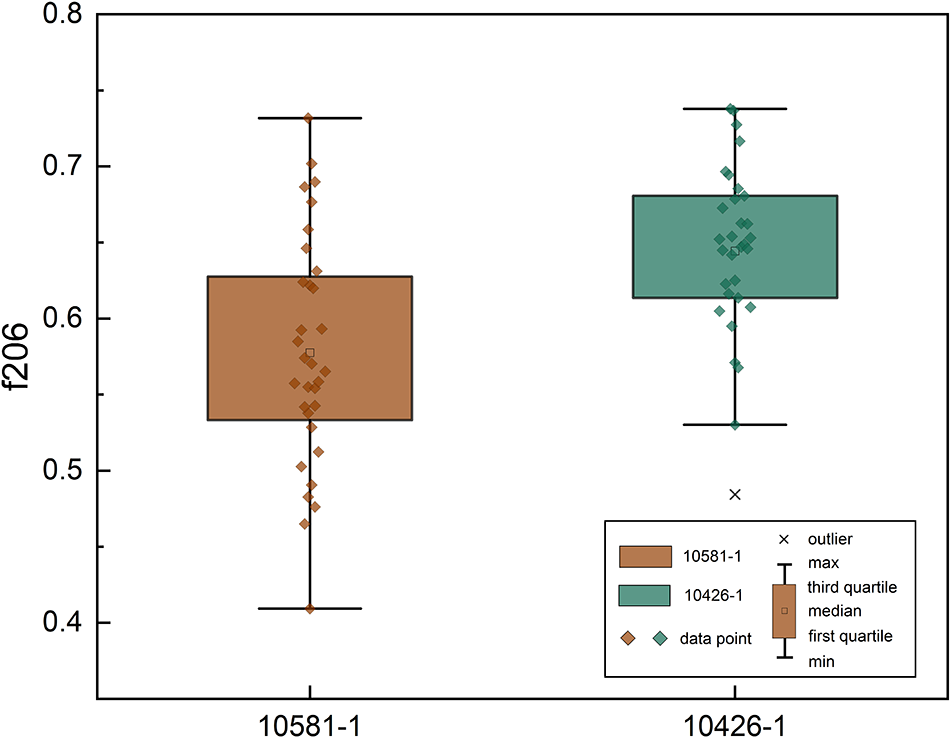
where f206 is the amount of common 206Pb expressed as a fraction of the total 206Pb, 207Pb/206Pbm is the measured ratio, 207Pb/206Pb* is the expected radiogenic ratio for the inferred age and 207Pb/206Pbc is the common Pb composition. In practice, the number of common Pb atoms is typically estimated by projecting a model Pb composition (Cumming and Richards, Reference Cumming and Richards1975) to concordia with the corresponding numbers of 207Pb and 208Pb atoms calculated using ratios from the same model. The radiogenic 206Pb/238U is obtained from: 206Pb*/238U = (1 – f206) × 206Pb238Um (Gregory et al., Reference Gregory, Rubatto, Allen, Williams, Hermann and Ireland2007). The f206 distributions of the two samples are compared in Fig. 11 (calculated for the 32 μm analyses using zircon 91500 as the reference material), revealing a clear contrast in common-Pb dispersion. Overall, both samples show appreciable common-Pb proportions, with f206 ranging from 0.41 to 0.73 for sample 10581-1 and from 0.53 to 0.74 for sample 10426-1. Such elevated f206 values are consistent with crystallisation in a differentiated, melt-poor magmatic environment and/or minor subsolidus re-equilibration that enhances the contribution of initial (non-radiogenic) Pb (Gregory et al., Reference Gregory, Rubatto, Hermann, Berger and Engi2012). Sample 10581-1 shows a markedly broader spread of f206 values, whereas sample 10426-1 defines a tighter, more concentrated distribution, consistent with a relatively homogeneous common-Pb component. This distinction is important because, in Tera-Wasserburg space, it is often the dispersion of common Pb—rather than its absolute abundance—that exerts a first-order control on the robustness of discordia regression.
Boxplots of common Pb content (f206) for allanite samples 10581-1 and 10426-1.

This interpretation is consistent with the Tera-Wasserburg plots in Figs 6, 7. For sample 10581-1, analyses are more evenly distributed along the discordia, indicating variable common-Pb contributions that provide strong leverage for regression. In contrast, analyses from sample 10426-1 cluster towards the upper-left portion of the array, implying a more uniform common-Pb composition. Such clustering reduces regression leverage and can yield larger uncertainties on the lower-intercept date (Ludwig, Reference Ludwig1998; Chew et al., Reference Chew, Petrus and Kamber2014). Accordingly, regardless of comparable analytical conditions, sample 10581-1 yields systematically smaller age uncertainties than sample 10426-1. For example, with zircon 91500 calibration at a 32 μm spot size, the relative age uncertainty is ∼6% for sample 10581-1, compared with ∼23% for sample 10426-1. These observations indicate that a more dispersed common-Pb component facilitates better-constrained discordia regression and, consequently, more precise age determination.
Non-matrix-matched U-Th-Pb age determination method of allanite
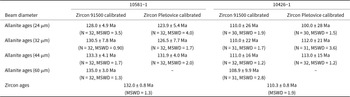
The foregoing discussion supports a magmatic origin for allanite in both plutons. Coexisting zircon is likewise interpreted as magmatic, on the basis of well-developed oscillatory zoning in CL images and Th/U ratios that are predominantly >0.4 (Table S4), consistent with igneous zircon (Wu and Zheng, Reference Wu and Zheng2004). As outlined in the geological background, the Wanganzhen and Heigoubei plutons cooled rapidly after emplacement and show no evidence of subsequent thermal overprinting. Under these conditions, zircon and allanite are expected to have crystallised broadly contemporaneously during the same magmatic event. We therefore determined the age of zircon from both intrusions to provide an independent temporal benchmark against which the allanite U-Pb results can be evaluated. Zircon 206Pb/238U ages of 132 Ma for sample 10581-1 and 110 Ma for sample 10426-1 are consistent, within analytical uncertainty, with previously reported emplacement ages for these plutons (Wang, Reference Wang2013; Gao, Reference Gao2018). These zircon ages thus provide a robust reference frame for assessing the feasibility of zircon-allanite non-matrix-matched LA-ICP-MS age determination. For ease of comparison, allanite U-Pb ages obtained under the various analytical conditions are summarised in Table 4.
U-Pb ages of allanite and co-genetic zircon at different spot sizes

Table 4 Long description
The table reports average concentrations with two-sigma uncertainty for major oxides and trace elements in two allanite samples, 10581-1 and 10426-1. For major oxides, 10426-1 has higher Al2O3, SiO2, and TiO2, while 10581-1 is higher in MnO and FeO. Among trace elements, 10426-1 is strongly enriched in Y and many mid to heavy rare earth elements: Y is 556 micrograms per gram versus 82.2, Sm is 2165 versus 484, Gd is 775 versus 127, and Dy is 198 versus 19. Light rare earths are high in both samples; La is higher in 10581-1 at 119458 micrograms per gram versus 85904, while Ce is similar at about 130000 in both. Total rare earth content is comparable overall, about 271941 for 10581-1 and 264511 for 10426-1, indicating differences mainly in distribution rather than total abundance. 10581-1 has higher U at 59.8 versus 18.4, whereas 10426-1 has higher Th at 7535 versus 5853 and a much higher Th to U ratio. Derived ratios show 10581-1 has a much higher La to Sm ratio, consistent with stronger light rare earth enrichment relative to mid rare earths. Uncertainties are provided for most entries and should be considered when comparing values, especially where uncertainties are large, such as P in both samples.
As shown in Table 4, allanite U-Pb ages obtained using the zircon-allanite non-matrix-matched approach overlap, within analytical uncertainty, with the zircon U-Pb ages of the corresponding plutons. This agreement is maintained irrespective of the zircon RM used (91500 or Plešovice) and across the range of laser spot sizes investigated (24, 32, 44 and 60 μm). Sample 10581-1 defines a well-developed linear array in Tera-Wasserburg space, yielding comparatively small relative age uncertainties (2.2–6.1%). In contrast, analyses of sample 10426-1 are more tightly clustered and do not define an equally well-constrained regression, resulting in larger uncertainties (9.1–24%). We attribute this difference primarily to the more homogeneous distribution of common Pb in sample 10426-1 (noted above), rather than to any inherent limitation of the non-matrix-matched calibration strategy. For samples with a concentrated common-Pb distribution, even matrix-matched approaches may yield poorly constrained lower-intercept ages unless independent common-Pb correction is applied (Ludwig, Reference Ludwig1998; Chew et al., Reference Chew, Petrus and Kamber2014; Luo et al., Reference Luo, Wang, Zhu, Qing and Hu2025b). Overall, this multi-parameter comparison demonstrates that, regardless of sample-dependent differences in regression geometry and achievable precision, zircon-allanite non-matrix-matched LA-ICP-MS age determination can produce reproducible and geologically meaningful ages over a broad range of analytical conditions, underscoring the robustness of the approach.
For the Th-Pb system, Fig. 8 shows that only the allanite Th-Pb ages obtained at spot sizes of 32 μm and 60 μm overlap, within analytical uncertainty, with the corresponding allanite U-Pb ages. In addition, their uncertainties are generally smaller than those of the U-Pb results (0.54–1.3%). This suggests that, under appropriate analytical conditions, allanite Th-Pb ages can be satisfactorily coupled with U-Pb ages and might, in some cases, provide higher-precision constraints. This behaviour probably reflects both the geochemical characteristics of allanite and the counting-statistical basis of radiometric age determination. Allanite is typically strongly enriched in Th but comparatively poor in U (Catlos et al., Reference Catlos, Sorensen and Harrison2000; Gieré and Sorensen, Reference Gieré and Sorensen2004), resulting in high Th/U ratios. Higher parent-element abundances generate more radiogenic Pb over a given interval and therefore reduce counting-statistical uncertainty, improving achievable precision (Parrish, Reference Parrish1990; Szentmiklósi et al., Reference Szentmiklósi, Maróti and Kis2023). By contrast, U-Pb age determination of allanite could be disadvantaged by lower U contents and, commonly, more complex common-Pb interference, which can increase analytical uncertainty. The decoupling between U-Pb and Th-Pb ages observed at other spot sizes may reflect several factors, including spatially variable initial common-Pb composition (Romer and Siegesmund, Reference Romer and Siegesmund2003; Oberli et al., Reference Oberli, Meier, Berger, Rosenberg and Gieré2004), partial isotopic resetting or pseudomorphic replacement (Barth et al., Reference Barth, Oberli and Meier1994; Airaghi et al., Reference Airaghi, Lanari, de Sigoyer and Guillot2017), and analytical complications related to matrix effect (Catlos et al., Reference Catlos, Sorensen and Harrison2000; Gregory et al., Reference Gregory, Rubatto, Hermann, Berger and Engi2012). The influence of laser spot diameter is discussed in detail in the following section.
Overall, the zircon-allanite non-matrix-matched U-Th-Pb approach yields reproducible and geologically meaningful ages across a wide range of analytical conditions, as demonstrated by the agreement between allanite and zircon ages obtained using different zircon reference materials and spot sizes. Where suitable allanite reference materials are unavailable, this strategy therefore offers a practical and effective alternative for allanite U-Th-Pb geochronology.
Exploration of the optimal beam spot diameter
Results from the zircon-allanite non-matrix-matched experiments using spot sizes of 24, 32, 44 and 60 μm show that allanite U-Pb ages obtained under different spot-size conditions are generally consistent with zircon ages from the same plutons, with no systematic date bias. This indicates that, within the present non-matrix-matched framework, spot size is not a threshold parameter governing method viability, but instead mainly influences analytical resolution and achievable precision. The discussion below focuses on the 91500-calibrated dataset. As shown in Fig. 6 and Table 4, relative date uncertainties decrease overall with increasing spot size from 24 to 60 μm (from 3.8% to 2.2% for sample 10581-1, and from 23.4% to 9.1% for sample 10426-1). Although the uncertainty for 10581-1 at 32 μm is slightly larger than at 24 μm, the reduction in single-spot uncertainties and the decline in MSWD values indicate that increasing spot size generally improves age precision.
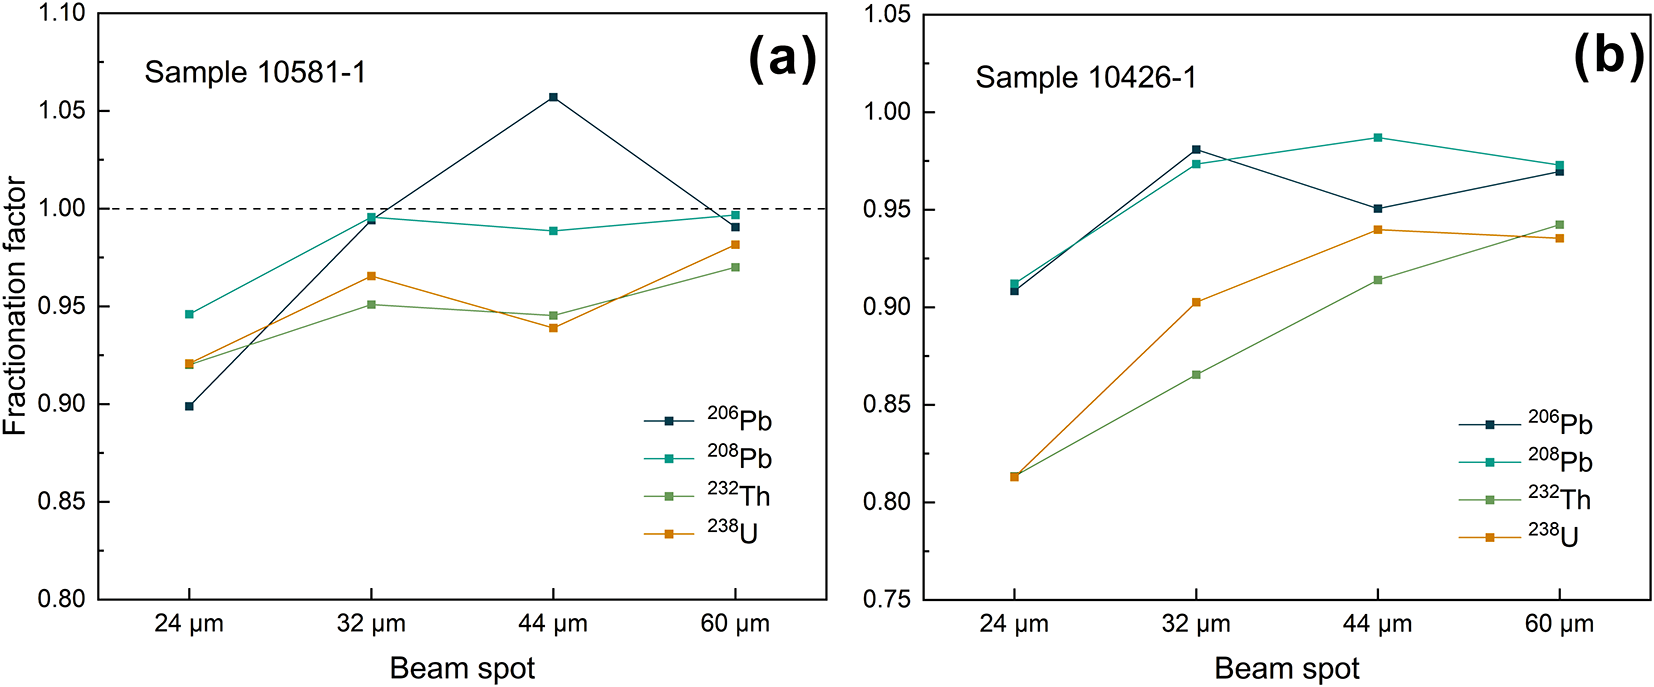
Previous work suggests that spot-size effects on U-Th-Pb age determination largely reflect changes in aerosol yield and laser-induced down-hole fractionation (Gehrels et al., Reference Gehrels, Valencia and Ruiz2008; Thompson et al., Reference Thompson, Meffre, Maas, Kamenetsky, Kamenetsky, Goemann, Ehrig and Danyushevsky2016; Hou, Reference Hou2020). At very small spot sizes, the ablated mass may be insufficient to sustain stable ion production in the ICP-MS (Wang et al., Reference Wang, Zhang, Zhang, Liang, Kong, Hu, Wang, Wang and Cai2022). In addition, as ablation proceeds, aerosol particles generated at greater depths might be transported less efficiently into the plasma (Liu et al., Reference Liu, Hu, Li and Gao2013; Hu et al., Reference Hu, Zhang and Liu2023), enhancing down-hole fractionation. To evaluate this effect more directly, we calculated fractionation factors for 206Pb, 208Pb, 232Th, and 238U for both samples at each spot size following Jackson et al., (Reference Jackson, Jacob, Drury, Fu, Leibensperger, Mickley and Tai2009) and Fryer et al. (Reference Fryer, Jackson and Longerich1995). The resulting factors, normalised to 29Si, are shown in Fig. 12 (see Jackson et al., Reference Jackson, Jacob, Drury, Fu, Leibensperger, Mickley and Tai2009 for calculation details). With increasing spot size, fractionation factors for all elements progressively approach unity and the inter-element offsets become smaller. Popov et al. (Reference Popov, Spikings, Scaillet, O’Sullivan, Chew, Badenszki, Daly, Razakamanana and Davies2020) showed that fractionation factors closer to 1, and with smaller relative differences among U, Th and Pb, are associated with improved age-determination accuracy, providing a mechanistic explanation for the observed reduction in age uncertainty with increasing spot size.
Elemental fractionation factors of Pb, Th, and U for allanite at different spot sizes, calculated using 29Si as an internal standard: (a) sample 10581-1; (b) sample 10426-1.

Figure 12 Long description
For both samples the fractionation factor increases as the beam size increases. For sample 10426-1 the graphs for different beam sizes have the lowest fractionation factor at the start then rise to a steady level around 0.90-1.00 for all samples apart from 206Pb spiking for 44 micrometres beam size with f206Pb of over 1.00. Sample 10426-1 has a more complex pattern for beam size vs fractionation factor, though all factors are below 1.00. See text for discussion.
Larger spot sizes are not invariably preferable as increasing spot size reduces spatial resolution and increases the possibility of sampling inclusions, fractures, or mixed growth domains. In addition, allanite grain size commonly constrains the practical upper limit of spot diameter. We therefore recommend a spot-size range of 32–44 μm for zircon-allanite non-matrix-matched age determination, which offers a practical compromise between analytical precision and spatial resolution.
For the Th-Pb system, allanite ages obtained at 32 μm and 60 μm are consistent with the corresponding U-Pb ages (differences <1%), whereas pronounced decoupling between the two systems occurs at 24 μm and 44 μm (generally >15%, except for 8.5% in sample 10426-1 at 44 μm). To explore the cause of this behaviour, we examined time-resolved variations in 206Pb/238U (Fig. 13) and 208Pb/232Th (Fig. 14) for the zircon reference materials and the two allanite samples under each spot-size condition. We quantified downhole fractionation by fitting linear slopes to the time-resolved 206Pb/238U (U-Pb) and 208Pb/232Th (Th-Pb) ratios for zircon 91500 and the allanite unknowns at four spot sizes. To quantify the deviation, we calculated a normalised mismatch factor for each spot size as D = (kTh/kU)allanite/(kTh/kU)zircon and expressed its magnitude as M = |log10D|, where larger M indicates a stronger mismatch irrespective of whether D is <1 or >1. The mismatch is greatest at 24 μm for both samples (10581-1: M = 0.85; 10426-1: M = 0.94). A pronounced secondary mismatch is observed at 44 μm, particularly for sample 10426-1 (M = 0.40), consistent with the spot-size conditions under which Th-Pb and U-Pb ages show the strongest decoupling. These results indicate that the time-resolved Th/Pb fractionation is not consistently coupled to U/Pb fractionation under certain spot-size conditions (Nasdala et al., Reference Nasdala, Irmer and Wolf1995; Nasdala, Reference Nasdala1998; Oberli et al., Reference Oberli, Meier, Berger, Rosenberg and Gieré2004; Valley, Reference Valley2006), which can amplify non-matrix-matched correction errors and thereby promote apparent decoupling between allanite Th-Pb and U-Pb ages (Günther and Hattendorf, Reference Günther and Hattendorf2005; Chew et al., Reference Chew, Petrus and Kamber2014; Nasdala et al., Reference Nasdala, Akhmadaliev, Artac, Chanmuang, Habler and Lenz2018).
Time-resolved variations of 206Pb/238U count ratios for allanite and zircon at different spot sizes: (a) sample 10581-1; (b) sample 10426-1. k is the fitted linear slope used to calculate a mismatch factor.

Time-resolved variations of 208Pb/232Th count ratios for allanite and zircon at different spot sizes: (a) zircon 91500; (b) sample 10581-1; (c) sample 10426-1.

In summary, spot size affects age determining precision mainly by modulating element fractionation associated with down-hole ablation: larger spot sizes reduce down-hole fractionation and hence decrease systematic age uncertainty. Nevertheless, within the zircon-allanite non-matrix-matched framework, spot size is not simply a case of ‘larger is better’. We recommend 32–44 μm as a practical compromise between spatial resolution and analytical precision. Compared with U-Pb, fractionation behaviour in the Th-Pb system appears more complex and merits further investigation.
Conclusions
(1) Allanite from the Wanganzhen pluton (10581-1) and the Heigoubei pluton (10426-1) is interpreted as magmatic in origin, co-crystallised with zircon, and shows no evidence for significant hydrothermal alteration. Both allanite populations are characterised by high Th/U ratios and pronounced negative Eu anomalies, with sample 10581-1 additionally exhibiting elevated La/Sm ratios.
(2) Zircon-allanite non-matrix-matched calibration yields allanite ages that overlap, within analytical uncertainty, with coexisting zircon U-Pb ages across a wide range of spot sizes (24, 32, 44 and 60 μm). This demonstrates that the approach is viable under diverse analytical conditions and broadens the practical applicability of LA-ICP-MS allanite U-Pb geochronology.
(3) Within the zircon-allanite non-matrix-matched framework, spot size exerts only a limited influence on the resulting ages, but it has a clear effect on precision. Larger spot sizes suppress Pb/U fractionation and reduce systematic uncertainty, yet at the expense of spatial resolution and with an increased risk of intersecting inclusions or mixed growth domains. A spot-size range of 32–44 μm is therefore recommended as a compromise between precision and resolution.
(4) Allanite U-Pb and Th-Pb results derived using non-matrix-matched calibration diverge at spot sizes of 24 μm and 44 μm, most likely reflecting contrasting fractionation behaviours in the U-Pb and Th-Pb systems between zircon and allanite. The processes governing this decoupling remain insufficiently constrained and warrant further investigation.
Supplementary material
The supplementary material for this article can be found at https://doi.org/10.1180/mgm.2026.10220.
Acknowledgements
The authors thank Researcher Sen Wang of the Institute of Geomechanics, Chinese Academy of Geological Sciences, for his guidance and helpful discussions on this manuscript. The authors also thank the two anonymous reviewers for their constructive and detailed comments, which significantly improved the manuscript, and the Principal Editor, Roger Mitchell, for his careful handling of the manuscript and valuable editorial input.
Funding statement
This research was funded by the National Natural Science Foundation of China (42222304) and a fundamental research project grant from the Institute of Geomechanics, Chinese Academy of Geological Sciences (Grant DZLXJK202307).
Competing interests
The authors declare that the research was conducted in the absence of any commercial or financial relationships that could be construed as a potential conflict of interest.