Introduction
When a patient is diagnosed with vestibular schwannoma, a management strategy must be decided.
In cases in which scanning reveals a large or cystic tumour, the choice is easy: most would agree that the patient should undergo surgery, preferably as soon as possible, because of the increasing risk of operative complications with increasing tumour size.Reference Kaylie, Gilbert, Horgan, Delashaw and McMenomey1, Reference Gormley, Sekhar, Wright, Kamerer and Schessel2
However, if the tumour is small a treatment dilemma arises. Should the patient undergo surgery or radiation treatment, or should they be observed with regular magnetic resonance imaging (MRI) evaluations?Reference Martin, Tzifa, Kowalski, Holder, Walsh and Irving3, Reference Smouha, Yoo, Mohr and Davis4 If a patient's hearing quality is seriously impaired at the time of diagnosis, then the decision to allocate the patient to ‘wait and scan’ management is easy. The real treatment dilemma occurs in patients with a small tumour and good hearing. If a patient is allocated to wait and scan management, their hearing may deteriorate during the observation period.Reference Meyer, Canty, Wilkinson, Hansen, Rubinstein and Gantz5 The tumour may grow and if the patient is advised to undergo radiation therapy, preservable hearing may be lost, the tumour may grow, and finally in theory the tumour may undergo malignant transformation caused by irradiation.Reference Evans, Birch, Ramsden, Sharif and Baser6, Reference Shin, Ueki, Kurita and Kirino7
In a previous publication, we reported that vestibular schwannoma patients with 100 per cent speech discrimination at diagnosis had a good chance of preserving this good hearing, even after several years of observation.Reference Stangerup, Caye-Thomasen, Tos and Thomsen8 The aim of the present study was to analyse the predictive value of patients' hearing level (at different frequencies) and speech discrimination at diagnosis for forecasting hearing outcomes after wait and scan management.
Subjects and methods
During the 33-year period from January 1976 to December 2008, 1144 vestibular schwannoma patients were allocated to wait and scan management, with the intention to perform annual MRI scanning and clinical assessment, including audiological examination. Of these 1144 patients, 932 had retrievable, full audiometric data (i.e. including pure tone and speech audiometry) for the time of diagnosis as well as for a subsequent time point after a period of observation. The median age at diagnosis was 58.3 years, ranging from 15 to 85 years. Four hundred and forty-eight patients were female and 484 male. At the time of diagnosis, the tumour was categorised as intrameatal in 372 patients and as intra- and extrameatal in 560 patients. The mean observation time was 4.7 years, with a range of 0.5 to 21 years.
Speech discrimination audiometry was performed in quiet conditions, using word lists scored by phonemes correctly repeated at the most comfortable hearing level, according to the masking rules.
The modified Word Recognition Score classification was used to rate hearing as follows: class 0 = 100 per cent speech discrimination; class I = 70–99 per cent speech discrimination; class II = 50–69 per cent speech discrimination; class III = 1–49 per cent speech discrimination; and class IV = 0 per cent speech discrimination.Reference Meyer, Canty, Wilkinson, Hansen, Rubinstein and Gantz5, Reference Stangerup, Caye-Thomasen, Tos and Thomsen8
Tumours were categorised as either intrameatal or intra- and extrameatal, as per international recommendations on vestibular schwannoma size reporting.Reference Kanzaki, Tos, Sanna, Moffat, Monsell and Berliner9 The size of the intra- and extrameatal tumours was calculated according to the largest extrameatal diameter not including the intrameatal portion.Reference Rosenberg10
Statistics
The chi-square and Mann–Whitney tests were used for statistical analyses, and p < 0.05 was chosen as the level of significance.
Results
Pure tone audiometry
Figure 1 shows a typical mean audiogram created by summing all the study patients' audiograms. This audiogram shows the significant (p < 0.001) hearing deterioration detected at the end of the observation period, at the different frequencies tested.
Mean hearing at the different test frequencies in 932 vestibular schwannoma ears at diagnosis and at final evaluation.

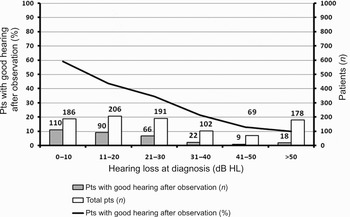
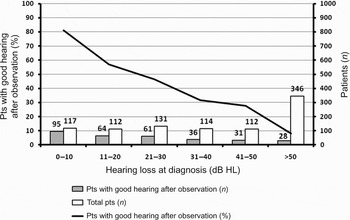
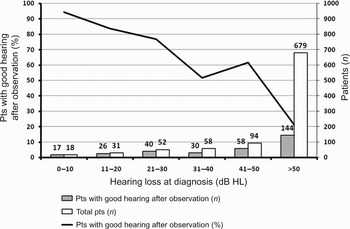
At the end of the observation period, for each of the test frequencies (i.e. from 250 to 8000 Hz), the percentage of patients with good hearing (i.e. modified Word Recognition Score class 0 or I) was calculated for the hearing levels 0–10, 11–20, 21–30, 31–40, 41–50 and >50 dB HL (Figures 2 to 8).
Predictive value of various hearing levels at 250 Hz, at diagnosis, for good hearing (i.e. modified Word Recognition Score class 0 or I) at final evaluation.

Predictive value of various hearing levels at 500 Hz, at diagnosis, for good hearing (i.e. modified Word Recognition Score class 0 or I) at final evaluation.

Predictive value of various hearing levels at 1000 Hz, at diagnosis, for good hearing (i.e. modified Word Recognition Score class 0 or I) at final evaluation.

Predictive value of various hearing levels at 2000 Hz, at diagnosis, for good hearing (i.e. modified Word Recognition Score class 0 or I) at final evaluation.

Predictive value of various hearing levels at 4000 Hz, at diagnosis, for good hearing (i.e. modified Word Recognition Score class 0 or I) at final evaluation.

Predictive value of various hearing levels at 8000 Hz, at diagnosis, for good hearing (i.e. modified Word Recognition Score class 0 or I) at final evaluation.

Predictive value of speech discrimination, at diagnosis, for good hearing (i.e. modified Word Recognition Score class 0 or I) at final evaluation.

250 Hz
Of 186 ears with initial hearing level at 250 Hz of 10dB or better, 110 (59%) had good hearing (mWRS class 0/I) at the end of the observation period (Figure 2). Of 69 ears with initial hearing level at 250 Hz of 40–50 dB HL, only nine out of 69 (13 per cent) had good hearing at final evaluation.
500 Hz
Of 160 ears with initial 0–10 dB HL at 500 Hz, 64 per cent had good hearing (mWRS class 0/I) at the final evaluation (Figure 3). This proportion decreased to 47 per cent of the 192 ears with initial hearing at 11–20 dB HL, to 35 per cent of the 154 ears with initial hearing at 21–30 dB HL, and to 8 per cent of the 214 ears with initial hearing at more than 50 dB HL.
1000 Hz
At 1000 Hz, the predictive value of hearing at 0–10 dB HL was higher. Of 117 ears with initial hearing at 1000 Hz of 0–10 dB HL, 95 (81 per cent) had good hearing at final evaluation (Figure 4). This proportion decreased to 57 per cent of the 112 ears with initial hearing at 11–20 dB HL, and to 8 per cent for the 346 ears with initial hearing at more than 50 dB HL.
2000 Hz
Of 51 ears with an initial hearing at 2000 Hz of 0–10 dB HL, 47 (92 per cent) had good hearing at final evaluation (Figure 5). This proportion decreased to 62 per cent of the 68 ears with initial hearing at 21–30 dB HL, and to 57 per cent for the 97 ears with initial hearing at 31–40 dB HL. At 2000 Hz, more than half of the 932 study patients (538; 58 per cent) had an initial hearing level worse than 50 dB HL.
4000 Hz
At 4000 Hz, the mean hearing level was worse compared with the lower frequencies. At this frequency, 679 out of the 932 study patients (73 per cent) had an initial hearing level worse than 50 dB HL (Figure 6). Of only 18 ears with initial hearing at 4000 Hz of 0–10 dB HL, 17 (94 per cent) had good hearing at final evaluation.
8000 Hz
In contrast to results for other frequencies, for which there was an almost reverse linear correlation between hearing level and the percentage of good hearing at final evaluation, at 8000 Hz the plot for the different degrees of hearing loss was almost flat (Figure 7). Of the 23 ears with initial hearing at 8000 Hz of 0–10 dB HL, 19 (83 per cent) had good hearing at final evaluation; this proportion decreased to 65 per cent for the 31 ears with initial hearing of 31–40 dB HL. At 8000 Hz, patients' hearing was even worse than at 4000 Hz, with 754 out of the 932 study patients (81 per cent) having an initial hearing level worse than 50 dB HL.
Speech discrimination scores
High levels of speech discrimination at diagnosis seemed to be a useful indicator of good hearing after the observation period. Of 159 patients with 100 per cent speech discrimination at diagnosis, 138 (87 per cent) still had good hearing (i.e. modified Word Recognition Score class 0 or I) at final evaluation (Figure 8). In comparison, of 314 ears with poorer than 50 per cent speech discrimination at diagnosis, only seven (2 per cent) had good hearing at final evaluation.
Discussion
Patients with vestibular schwannoma generally suffer progressive hearing impairment. If surgery is postponed, their hearing may deteriorate such that serviceable hearing, and candidacy for hearing preservation surgery, is lost.Reference Meyer, Canty, Wilkinson, Hansen, Rubinstein and Gantz5 The ability to predict which individuals are likely to maintain good hearing and which will probably lose serviceable hearing, during wait and scan management, would be of great clinical importance.
In the first instance, the indication for vestibular schwannoma surgery should be established tumour growth.
In a recent study, we found that almost 90 per cent of vestibular schwannoma patient ears maintained good hearing (i.e. Word Recognition Score class I) after wait and scan management if their speech discrimination score was 100 per cent at diagnosis.Reference Stangerup, Caye-Thomasen, Tos and Thomsen8 We also found that the final proportion of patients maintaining good hearing (i.e. Word Recognition Score class I) after wait and scan management decreased dramatically with decreasing initial speech discrimination.
• Many patients with vestibular schwannoma suffer hearing deterioration over time
• This study aimed to evaluate the predictive value of initial hearing for hearing after an observation period
• Good high frequency hearing and good speech discrimination at diagnosis were useful predictors of good hearing after several years of observation
The typical audiogram of our vestibular schwannoma patients receiving wait and scan management showed hearing impairment in which the threshold increased with increasing frequency (Figure 1). The aim of the current study was to analyse the extent to which patients' initial hearing level at different frequencies related to their hearing outcome at the end of the observation period. As seen in Figures 2 to 8, the precision of predicting good hearing after an observation period increased with increasing test frequency. For example, 59 per cent of patients with an initial hearing level of 0–10 dB at 250 Hz maintained good hearing (i.e. modified Word Recognition Score class 0 or I) after an observation period, compared with 64 per cent with the same initial hearing level at 500 Hz, 81 per cent at 1000 Hz, 92 per cent at 2000 Hz and 94 per cent at 4000 Hz. The predictive value of pure tone audiometric testing at 2000 and 4000 Hz (i.e. for forecasting good hearing after an observation period) was very high, since 92 and 94 per cent of patients with good initial hearing at these frequencies, respectively, maintained good hearing after observation. Clinically, however, such testing was not very useful, since only 51 out of 932 patients (6 per cent) and 18 out of 932 (2 per cent) patients had good initial hearing levels at 2000 and 4000 Hz, respectively. However, the clinical utility of speech discrimination testing differed, since 138 out of 932 patients (15 per cent) had 100 per cent speech discrimination at diagnosis.
Conclusion
In vestibular schwannoma patients managed with wait and scan, the best predictor of good post-observation hearing appeared to be good initial hearing levels at high frequencies. The precision of prediction increased with increasing frequency and was highest at 4000 Hz; 94 per cent of patients with an initial hearing level of 0–10 dB HL at 4000 Hz had good hearing (i.e. modified Word Recognition Score class 0 or I) at final evaluation. Patients' initial speech discrimination seemed to be the best predictor of good, stable hearing at final evaluation.