

1. Introduction
According to the instrumental view of voting, voters turn out to change the election outcome toward their favor. The probability that a single vote is decisive, however, is negligible in large-number electorates. Thus, it would be rational for a voter to abstain if there are costs to voting. However, the instrumental view's prediction of large-scale abstention is not consistent with the often observed significant turnout rates in elections. Ever since Riker and Ordeshook (Reference Riker and Ordeshook1968) argued that people vote to fulfill a civic duty, researchers have added expressive motivation into the calculus of voting in order to find solutions to this ‘paradox of voting’.Footnote 1
A voter may obtain expressive utility, for example, by complying with civic duty, or expressing her identity or preferences among candidates. In the expressive view of voting, voting is considered to be a way to express the voter's identity, beliefs, values, and so on. Such expression, in itself, may be valuable to the voter and sufficient to motivate her to cast a vote. Although increasing attention has been paid to the expressive view of voting in the literature on voting behavior, there is no single widely accepted definition of the content of expressive voting, as many different approaches are adopted.Footnote 2 For instance, recently Hillman (Reference Hillman2010) presented a voting model in which a voters’ expressive utility is derived from confirming attributes of their identity pleasing to themselves or to others, such as being generous, socially responsible, ethical, or cooperative. There are slightly different identity-based expressive utility models, which can be categorized into two types depending on whom the voter identifies with. One type is when the voter identifies with the candidates or party, as in Brennan and Hamlin (Reference Brennan and Hamlin1998). The other is when the voter identifies with specific groups of voters, as in Schuessler (Reference Schuessler2000) and Rotemberg (Reference Rotemberg2009). Altruistic behavior could be another source of expressive utility. A voter may experience personal satisfaction by expressing altruism independent of the electoral outcome.Footnote 3 Although many different sources of expressive motivation have been suggested, a common key feature is that expressive motivation is not associated with the electoral outcome. The nature of the act of voting labeled ‘expressive’ is inconsequential (Hamlin and Jennings, Reference Hamlin and Jenning2011).
The traditional view of expressive voting, that individuals vote because they derive utility from voting itself, however, has been subject to a criticism: it is tautological, and thus it cannot make any prediction (Grossman and Helpman, Reference Grossman and Helpman2001; Mueller, Reference Mueller2003). As pointed out by Jones and Hudson (Reference Jones and Hudson2000) and Geys (Reference Geys2006b), identifying the determinants of expressive utility is essential to overcome this criticism. In this paper, we do not attempt to define expressive voting. Rather, based on the view that any inconsequential motivation is expressive, we present two possible sources of expressive utility: social interaction with voters having the same political preferences, and interestingness of the election. A voter's expressive utility increases as the number of voters having the same political preferences increases in her local community, where interaction occurs more frequently with others than it does with others in distant communities. Also, the voter derives higher expressive utility when the election is more interesting. Using the aggregate-level data of the 2008 parliamentary election in Korea, we test the validity of the sources presented above.
Some studies have tried to empirically show the existence of expressive voting.Footnote 4 Most of them use individual-level survey data. For instance, Kan and Yang (Reference Kan and Yang2001), using the 1988 US presidential election survey data, found evidence for expressive motivation but against instrumental motivation. Copeland and Laband (Reference Copeland and Laband2002) also found expressive voting behavior from National Election Surveys. One exception to using individual-level survey data is Ashworth et al. (Reference Ashworth, Geys and Heyndels2006) who use aggregate-level data on the proportional representation (PR) system from Belgian municipal elections.Footnote 5 They found evidence for Schuessler's (Reference Schuessler2000) argument that expressive utility depends on the number of other voters for the same candidate. Our work improves Ashworth et al. (Reference Ashworth, Geys and Heyndels2006) by separating expressive motivation from instrumental motivation, while the two motivations are mixed in Ashworth et al. This is possible because the 2008 parliamentary election in Korea consists of both single-member district (SMD) and proportional representation (PR) systems.Footnote 6
Our work relates to the group-based model in the sense that we also view man as a social animal: man derives utility from social interaction. The group-based model, such as in Uhlander (Reference Uhlander1989), Filer et al. (Reference Filer, Kenny and Morton1993), and Grossman and Helpman (Reference Grossman and Helpman2001), focuses on an individual's behavior as a group member or group leader. In the group-based model, a group seeks its own political interest, and voting is viewed as an instrument at the group level to secure the group's interest. Of course, an individual's voting as a group member does not necessarily require the existence of instrumental motivation at the individual level. A group member may vote for a policy that is consistent with the group's objective in order to achieve this objective, but she may also do it just to confirm her identity.Footnote 7 Expecting that her vote is not decisive, she may vote for the policy out of this expressive motivation even though she would veto it if her vote were decisive. This possibility may lead to the expressive policy trap as argued by Hillman (Reference Hillman2010). Because a group in our model does not seek its own political interest, our work departs from the group-based model. An individual, who interacts with others in various groups, derives utility from expressing her preferences or from complying with social pressures, and receives higher utility as more people in those groups support the same candidate.
The rest of the paper is structured as follows. Section 2 briefly describes the parliamentary election in Korea and Section 3 develops a simple voter's utility model which incorporates our new arguments. Section 4 presents the empirical specification and results. The conclusion is provided in Section 5.
2. Parliamentary election and polls in Korea
Korea has adopted a standard mixed electoral system for the parliamentary election since 2004. The system consists of the single-member district (SMD) system and the proportional representation (PR) system. A voter has two ballots: one for a candidate in the SMD system and the other for a party in the PR system. In the 2008 election, which we are analyzing, there is only one nationwide district for the PR election, while there are 245 districts for the SMD election. PR seats are distributed in proportion to each party's share of the total valid votes in one nationwide PR district.Footnote 8 With this mixed system, we can examine the first argument proposed in this paper, that a voter's expressive utility depends on a share of PR votes in her SMD rather than nationwide PR votes. This is because a voter in an SMD is more likely to socially interact with other supporters who live in the same SMD than those who live in other SMDs, and her utility increases when she interacts with more voters having the same political preferences.
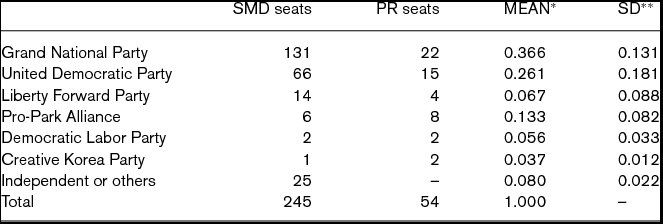
In the 2008 election, there were 245 SMD seats and 54 PR seats. As shown in Table 1, the Grand National Party won more than half of the seats in the SMD election and six parties shared the PR seats. Notice that the standard deviation of shares of PR votes across SMDs by each party is relatively large. This result reflects that major parties in Korea are regionally based. The supporting rate for a party in some provinces is very high, but very low in other provinces. For instance, the highest share of PR votes in SMDs won by the United Democratic Party is 75.2%, while the lowest one is 3.7%.
Overview of voting data in the 2008 election
Notes: * Mean of shares of PR votes across SMDs by each party.
** Standard deviation of shares of PR votes across SMDs by each party.
We use the number of polls conducted by major broadcasting companiesFootnote 9 as a proxy variable to measure how interesting the SMD election of each district is. This proxy variable may be justified because broadcasting companies choose SMDs for polls where the electoral contest looks interesting and draws public attention. There are three major broadcasting companies in Korea: KBS, MBC, and SBS. Before the election, each of them reported the result of the poll on some selected SMD electoral districts.Footnote 10Table 2 shows the number of polls conducted by the three major broadcasting companies. All three companies conducted the poll in 35 electoral districts, while no polls were done in 90 electoral districts.
Polls by major broadcasting companies in the 2008 election

3. Model
3.1 The calculus of voting
In this subsection, we present a simple utility model of voting following Riker and Ordeshook (Reference Riker and Ordeshook1968). A voter turns out to vote only if the expected utility of voting is positive, i.e. if
 \begin{equation}
U = PB + D - C > 0.\end{equation}
In this equation, U represents the voter's expected utility, which consists of two parts: ‘instrumental’ benefits PB and ‘expressive’ benefits D. The costs of voting C include the information costs as well as direct costs of voting. The instrumental voting approach views the act of voting as an investment to achieve a desired election outcome. It is incorporated into the first term in U, which is a product of two components: P and B. The first component (P) is the probability that an individual's vote alters the election outcome. The second component (B) is the voter's utility gain when her preferred outcome is realized.
It has been argued, however, that instrumental benefits alone cannot adequately explain why so many people still vote in a nationwide election when P is negligible. This inability of the instrumental approach to explain the level of real turnout rates has been known as the ‘paradox of voting’. The paradox has attracted a lot of authors’ attention. Downs (Reference Downs1957) argues that some people still may vote in order to ensure that democracy will continue, even when the voter turnout model itself implies universal abstention in a large election. Riker and Ordeshook (Reference Riker and Ordeshook1968) expand this concept and include a second term (D) – expressive benefits – into the voter's utility model. Expressive utility can be interpreted in several ways. For instance, Downs (Reference Downs1957) views it as reflecting the benefits from performing a civic duty. It can also be argued that the expression itself of preferences among the competing parties or candidates produces expressive benefits (Fiorina, Reference Fiorina1976). As Kan and Yang (Reference Kan and Yang2001) argue, while D does not depend on whom an individual votes for according to the former interpretation, it is choice-specific according to the latter interpretation. In this respect, Aldrich (Reference Aldrich and Mueller1997) decomposes D-term into D′ and B′ such that D = B′ + D′. It includes B′ to reflect the value of expressing the voter's preference. A voter who has large B′ is more likely to express her preference than another who has small B′. The second term, D′, is the value associated with any remaining aspects of D.
Schuessler (Reference Schuessler2000) tries to explain why herding or the contagion effect of voting exists, and develops an interesting expressive voting model based on social theory and anthropology. He argues that an expressively motivated action X is a form of ‘being’ rather than of ‘doing’ in the sense that X is chosen not to obtain a specific outcome Y but to be an X performer. The expressive voter is motivated by attachment to an electorate that supports the candidate in two dimensions: who and how many: D in Equation (1) depends on who the supporting voters are and how many supporting voters there are. In other words, a voter's expressive motivation increases with the number of voters having the same preferences.
In this paper, we elaborate on Schuessler (Reference Schuessler2000) and propose a revised argument for D: social interaction with voters having the same political preferences.Footnote 11 The more often a voter socially interacts with others having the same political preference, the higher expressive utility obtained. Some grounds for this argument are provided from previous literatures, which show that social networks play an important role in an individual's decision whether to vote. As Zuckerman (Reference Zuckerman2005) argues, it is obvious and widely accepted that the immediate social circumstances of people's lives influence their political preferences and behaviors. Huckfeldt and Sprague (Reference Huckfeldt and Sprague1991, Reference Huckfeldt and Sprague1995) and Levin (Reference Levin and Zuckerman2005) show the significant impact of social networks on political decision-making. It is also shown by many researchers, that turnout is highly correlated among family, friends, and co-workers. For instance, Kenny (Reference Kenny1992) shows that a political discussant's turnout significantly increases the possibility of the respondent's turnout. Through experiments, Nickerson (Reference Nickerson2008) shows that 60% of the propensity to vote is passed on to other members of the household. The high correlation may imply that a single voter's decision to vote will lead to a large aggregate increase in turnout, which is called ‘turnout cascade’ by Fowler (Reference Fowler and Zuckerman2005). It has been well-established that the social interaction is important to turnout. By combining this idea with Schuessler's (Reference Schuessler2000) argument, we derive a new argument that social interaction with other voters having the same preferences reinforces the expressive motivation to vote. Thus, turnout will increase with the number of voters having the same preferences in a local community, where a voter socially interacts more often with others than she does in distant communities. As Schuessler (Reference Schuessler2000) argues, an expressive voter derives utility not only from identification with the candidate or party but also from attachment to the supporters. The degree of attachment to the supporters, however, differs from the type of supporters. It seems that the voter attaches herself more strongly to the supporters with whom she is more likely to interact.
In addition, we provide two other ways of reasoning for our argument above. As Glazer (Reference Glazer2008) explains, a voter may vote to please those who support the same candidate as much as she does, or to anger those who support the other candidate. However, it is more plausible that a voter will obtain higher utility from pleasing others than from angering others.Footnote 12 If we restrict our attention to the voter's immediate social circles as in this paper, then the objects to be pleased or angered are the members of the immediate social circles. When people discuss politics with members of immediate social circles, it is more likely that they derive higher utility when they agree with others. Because we deal with the social interaction at the local community level not at the nationwide level, this argument seems reasonable and leads to the prediction that voters derive higher utility as more people in their immediate social circles support the same candidate as they do.
The final way of reasoning is related to social pressure. Knack (Reference Knack1992) and Gerber et al. (Reference Gerber, Green and Larimer2008) distinguish extrinsic motivation from intrinsic motivation in expressive voting, and argue that extrinsic motivation plays an important role in political participation. The intrinsic benefits from voting reflect the positive internal feeling the voter experiences from performing the civic duty itself, while extrinsic benefits reflect social rewards from others who may observe the voter fulfilling the civic duty. The social rewards may include face-to-face approval and pride that the voter feels when others become aware of the civic duty being performed.Footnote 13 Thus, extrinsic motivation depends on the frequency and quality of interaction with others who may observe the voting activity (Knack, Reference Knack1992). It is likely that the voter interacts socially more often with others in the local community than with others in more distant communities, interacts more intensively, and is more friendly toward others who have the same political preferences than others who have different preferences. Thus we can argue that a voter's extrinsic benefits from voting increase with the number of others having the same political preferences in the local community.
Validity of our first argument above may depend on cultures. Individualistic cultures emphasize personal achievement over group goals and value individuality over social harmony, whereas collectivistic cultures put emphasis on group goals and social harmony. Therefore, our argument may hold more strongly in collectivistic cultures, such as Korea. Korea ranks 43 out of 53 countries in the Individualism Index, developed by Hofstede (Reference Hofstede2001). It does not imply, however, that our argument is invalid in an individualistic culture. We think that this is a matter of degree.Footnote 14 It will be interesting to study and test empirically how a cultural difference affects expressive motivation, but we leave this to future research.
We also propose another argument for D: interestingness of the election. For this, we exploit the similarity between an election and a sports event as an interpretive resource.Footnote 15 A spectator at a sports event is likely to derive higher utility when it is more interesting, for example when a star player appears, a big title is at stake, or the game is very competitive. Similarly, when an election is more interesting, for example, when a big or famous politician runs for election, the issue at stake is important, or the election is very close,Footnote 16 a voter is likely to derive higher utility from expressive voting. To our knowledge, no separate test has been done on the relationship between interestingness of an election and turnout rate, since most researchers consider only closeness in election as a factor of interest in an election.Footnote 17 We measure the interestingness with the number of polls conducted by major broadcasting companies.Footnote 18
3.2 The modified setup in a mixed electoral system
We modify the simple utility model of voting in the previous subsection by incorporating the Korean mixed electoral system. It can be viewed that a voter's utility comes from both SMD and PR ballots. Based on this view, we present the utility of a representative voter who is in an SMD electoral district i, supports an SMD candidate j and PR party k as follows:
 \begin{equation}
U_{ijk} = P^s _i (cl^s _i ){\rm }B^s _i + D^s _{ij} (S_{ij} ,NP_i ) + P^p (cl^p )B^p + D^p _{ik} (S_{ik} ) - C_i ,\end{equation}
where cl is closeness in the election, S is supporting rate for an SMD candidate j or PR party k, and superscripts s and p represent SMD and PR, respectively.
The first term in (2) corresponds to PB in (1), and the probability that a voter alters the election outcome in an SMD, Psi, depends on closeness in the SMD i, clsi. The second term in (2), Dsij, represents the expressive motivation in the SMD i and has two arguments. The first is the voting share obtained by an SMD candidate j, Sij, which reflects Schuessler's (Reference Schuessler2000) idea that the number of supporting voters affects the expressive motivation. The second is the number of polls, NPi, which is used to measure how interesting the election in the SMD i is. We choose NPi as a proxy variable because broadcasting companies choose SMDs for polls where the electoral contest looks interesting and draws public attention. This seems to be a reasonable substitute for a variable that is difficult to define. Likewise, the third and fourth terms also correspond to PB and D, respectively, in (1). The probability that a voter alters the election outcome in PR, Pp, depends on closeness in a nationwide electoral district for PR, clp. Note that components Pp(clp) and Bp are the same across the SMD electoral districts since PR has only a single nationwide electoral district. Reflecting our argument in the previous subsection, Dpik depends on the supporting rate for a party k in an SMD electoral district i, Sik even though there is only one electoral district in PR. This setup of the fourth term implies that a voter's utility is influenced more strongly by other voters in her smaller community where interactions occur more frequently. Of course, closeness and supporting rate for a candidate or a party may constitute a close relationship, and only one argument in each system will be used in the empirical analysis. The last term, Ci, represents cost of voting by the representative voter.
The 2008 parliamentary election in Korea provides a suitable dataset to test our first argument regarding expressive voting: social interaction with voters having the same political preferences. The effect of expressive motivation in this regard is completely separated from the one of instrumental motivation in PR since Pp(clp) and Bp are the same across all the SMDs, while Dpik takes different values in different SMDs. These two effects, however, are not completely separated in the SMD election since they depend on the same arguments of closeness or voting share. To capture the effect of expressive motivation in an SMD election, we test the second argument: interestingness of the election.
First, we present a simple hypothesis regarding the relationship between turnout rate (ti) and the supporting rate for the largest party (δi) in the SMD i.
Hypothesis I: ti is an increasing function of δi.
Depending on the structures of a voter's utility function, it is possible that Hypothesis I does not hold even under our new argument. It turns out, however, that Hypothesis I is sufficient to support our new argument. Note that ti must be independent of δi if our new argument does not hold.
Second, we present the other hypothesis regarding expressive voting.
Hypothesis II: ti is an increasing function of NPi.
Hypothesis II is proposed to test whether interestingness of the election affects a voter's utility.
4. Empirical analysis
4.1 Empirical specification
To test the hypotheses, we consider the following functional form:
 \begin{equation}
Turn_i = \gamma _1 + \gamma _{2j} X_{ij} + \gamma _3 PLAR_i ({\rm or}\,PENT_i ) + \gamma _4 NP_i\end{equation}
We take a standard logit transformation of turnout rate in an SMD electoral district i (Turnouti) and represent it by Turni since turnout rate is a bounded variable: Turni = ln(Turnouti /(1 – Turnouti)). Xij are the SMD electoral district-specific control variables, discussed below. Hypothesis I is evaluated through either PLARi or PENTi.Footnote 19PLARi is the share of PR votes obtained by the party that won the largest PR votes in an SMD electoral district i. Instead of PLARi, entropy of PR election in SMD electoral district i, PENTi, is also used to test Hypothesis I. Specifically, PENT is calculated as follows:
 \begin{equation}
PENT = - [p_1 {\rm ln}p_1 + p_2 {\rm ln}p_2 + \cdots + p_n {\rm ln}p_n ],\end{equation}
where pj is the share of PR votes obtained by a party who took the jth place and n is the number of parties in PR.Footnote 20 If γ 3 turns out to be strictly positive for PLARi (negative for PENTi), Hypothesis I is supported.
Hypothesis II is tested through NPi, which represents the number of polls for SMD i. If γ 4 turns out to be strictly positive for NPi, Hypothesis II is supported.
The number of control variables included in X are ln(VOT), ENT, ELD, DEN, MOV, NCAN, ln(EXP), and ln(NPLA). The ln(VOT), log of number of voters, and ENT, entropy, are used to accommodate for Ps-term in Equation (2). A larger size of voting population implies a smaller probability that one vote changes the election outcome, and thus it is expected to have a negative effect on turnout rate. For closeness in an SMD electoral district, we use entropy of an SMD election (ENT) which measures the instability in SMD. Specifically, entropy in an SMD electoral district is calculated as follows:
 \begin{equation}
ENT = - [q_1 {\rm In}q_1 + q_2 {\rm In}q_2 ],\end{equation}
where qj is the share of votes obtained by an SMD candidate who took the jth place. The higher entropy implies a closer election, where the probability that one vote is decisive is larger. It, in turn, implies that the turnout rate increases with entropy.Footnote 21, Footnote 22 ELD (the proportion of elderly over 65), DEN (population density per km2), and MOV (the percentage of population that moved in for the previous five years before the election) are included as socio-economic variables other than ln(VOT). ELD is used to test whether elderly people have lower opportunity costs of voting than others, because turnout rate decreases with opportunity costs of voting. DEN measures population concentration which reflects how much the community is urbanized. According to the sociological theory, urbanization will lead to ‘a weakening of interpersonal bonds’ (Hoffman-Martinot, Reference Hoffman-Martinot and Lopez-Nieto1994: 14), which implies a weaker social pressure to turn out to vote. Higher population density, however, may stimulate political participation. As Stein and Dillingham (Reference Stein and Dillingham2004) argue, efforts to mobilize individuals for civic participation are more effective in high-density communities because the costs of interacting with others in the neighborhood are lower in urban area. Also, the voting cost is likely to be lower in higher density areas because the distance to the polls tends to be smaller. Population mobility, MOV, is expected to reduce turnout rate, as was well documented by Geys (Reference Geys2006a).Footnote 23 The number of candidates, NCAN, has both negative and positive effects on turnout rate. On the one hand, more candidates increase the possibility that a voter can find a candidate who expresses views close to her own (Blais and Carty, Reference Blais and Carty1990), which leads to a higher turnout rate. On the other hand, more candidates increase a voter's information cost (Hoffman-Martinot, Reference Hoffman-Martinot and Lopez-Nieto1994), which leads to a lower turnout rate. Total campaign spending by all candidates in an SMD electoral district, EXP, is expected to have a positive effect on turnout rate by lowering the costs of information acquisition about the candidates.Footnote 24 Number of voting stations, NPLA, lowers the costs of voting and thus has a positive effect on turnout rate.
4.2 Empirical results
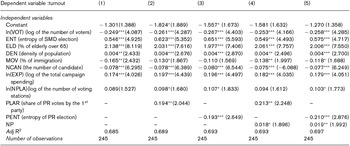
The empirical results are summarized in Table 3. All the variables are significant in almost all columns and they are stable in the sense that the values of parameters and their significance do not vary much across columns. The number of voters reduces turnout rate while, as expected, closeness in SMD increases. Both factors affect the probability (P) that one vote is pivotal.Footnote 25 The elderly are more likely to turn out than others, which may reflect lower opportunity costs of the elderly. The higher percentage of the population who moves in reduces turnout rate. Total campaign spending raises the turnout rate significantly in all columns, while the number of voting stations only does so in Columns 2, 3, and 5. The former reduces the costs of information acquisition about the candidates, while the latter reduces the cost of voting. The population density significantly increases turnout rate, which stands for the arguments that the costs of interaction and/or voting deceases with the density. The negative effect of the number of candidates on turnout rate dominates in our analysis.
Regression results on turnout rate

* p < 0.1, ** p < 0.05, *** p < 0.01
(): t-value
Hypothesis I, as proposed, is supported in both versions: PLAR and PENT. As more people support the largest party in an SMD electoral district, more people turn out to vote. It implies that a voter who supports the largest party derives bigger utility as more people in the community support the same party. This result can be interpreted in three ways as we reasoned. First, there exists positive externality in the expressive voter's attachment to the supporters. The utility the voter receives from this attachment increases as more people in an SMD electoral district support the same party. Second, a voter derives higher utility from pleasing socially connected others in the community with the same preferences than from angering others with different preferences. Finally, a voter's extrinsic benefits from voting increase with frequency and intensity of social interactions with others. Hypothesis I is supported with the variable PENT too: a higher PENT implies a closer PR election in the given SMD electoral district.
The test of Hypothesis II shows that turnout rate increases with the number of polls conducted by major broadcasting companies: see Columns 4 and 5 in Table 3. This result may imply that voters receive higher utility by participating as a voter if the election is more interesting and draws more public attention. Of course, the election would be more interesting in districts where an SMD election is close, and thus NP could be a proxy for the expected closeness of the election. As we argued, however, there are other factors which make the election interesting: rivalry competition, participation of big or famous politician and an important issue at stake.Footnote 26
5. Conclusion
In this paper, we propose two arguments for the determinants of the utility from expressive voting. Using the aggregate level data of the 2008 parliamentary election in Korea, we find evidence for our arguments. First, the turnout rate is significantly and positively related to the share of proportional representation votes for the largest party in each single-member district. This result may be interpreted in the way that a voter's expressive utility may increase, as the number of voters with the same preferences increases, and interaction with them occurs more often. This argument is an extended version of Schuessler's (Reference Schuessler2000) study, and is tested here for the first time in voting literature. Second, turnout rate is significantly and positively related to the number of polls. The number of polls may measure how interesting an SMD election in each district is. Then, we may conclude that by casting a ballot, an individual receives higher utility when the electoral contest is more interesting. To our knowledge, no separate test regarding this argument has been done, as most researchers consider only closeness in election as a factor of interestingness of an election.
Although we have not comprehensively considered the determinants of the utility from expressive voting, our research presently adds to the understanding of the importance of the expressive utility of social interaction and interestingness of elections. Future research would be enhanced by empirically testing other factors that would determine the utility from expressive voting. For example, there are a number of factors which make an election more interesting. It should be noted that the B-term in the calculus of voting – the difference between the most preferred candidate and best alternative – is one of those factors.
About the authors
Man-Soo Joo is a professor of the department of economics, Hanyang University at Ansan, Korea and a vice president of the Korean Association of Local Finance. He received his Ph.D. from University of Illinois at Urbana-Champaign. His research interests include election, local taxation, and intergovernmental fiscal relation. His work has appeared in for example Regional Science and Urban Economics, Korean Journal of Economic Studies, Korean Journal of Public Finance.
Sungho Yun is an associate professor of the department of economics at Hanyang University in Ansan, Korea. He received his Ph.D. from University of Washington, Seattle in 2004. His research interests include voting, corruption, and asymmetric information in organizations. His work has appeared in journals including Rand Journal of Economics, BE Journal of Economic Analysis and Policy, and Information Economics and Policy.