


1. Introduction
Environmental changes in high-latitude and -altitude regions due to recent climate warming have been reflected in cryospheric changes such as reduction of the snow-covered area/period. Reference Beniston and RebetezBeniston and Rebetez (1996), for example, reported that warming is greater at higher elevations in the Alps. They considered that the cryosphere, one of the components of the climate system in high mountain regions, was sensitive to climate warming. Global warming could also influence precipitation amount/distribution and this would affect the water cycle along with the runoff process due to possible shrinkage of permafrost. Monitoring of the fragile cryosphere enables early detection of changes in the region. Glaciers, one of the notable components of the cryosphere, are a potential indicator of changing climate, especially in high and remote mountain regions where no permanent climate station exists. The critical link between glaciers and climate is glacier mass balance. Such glaciological data, however, have come mostly from Europe and North America, while data from northern Eurasia, where major climatic change could occur due to global warming, have been few. To initiate the establishment of a glacier-monitoring network in northern Eurasia, we studied recent variations of Mongolian glaciers using the materials presently available.
2. Study Area
Glaciers in Mongolia exist in the Altai mountains, which span approximately 1400 km within Russia, China and Mongolia (Fig. 1). Four regions (A–D in Fig. 1) were selected to form the study area. Glaciers in the Tavan Bogd region are of the valley type, in Turgen and Kharkhiraa massif are a mixture of two types (valley type and flat-top type), whereas in Tsambagarav massif flat-top-type glaciers are dominant. The mean highest/lowest glacier elevations obtained from the topographical maps listed in section 3.1 are 3598/2884, 3796/3159, 3647/3179 and 4013/3144 ma.s.l. in Tavan Bogd, Turgen, Kharkhiraa and Tsambagarav, respectively.
Study areas in the Altai mountains in Mongolia: A: Tavan Bogd region; B: Turgen massif; C: Kharkhiraa massif; D: Tsambagarav massif. Three nearby meteorological stations, Ulgii (1715ma.s.l.), Ulaangom (939ma.s.l.) and Khovd (1405ma.s.l.), are also shown.

The highest point, on Khuiten mountain, is 4374 ma.s.l. and the longest/largest glacier is Potanin glacier which is about 11 km long and 43 km2 in area. The climate is continental and semi-arid. Figure 2 shows the mean (1961–90) monthly air temperature and precipitation at Khovd. The mean annual air temperature and precipitation are –3.5˚C and 138 mm. About 70% of annual precipitation occurs in the summer (June–August). The borehole temperature below 5 m was about –18˚C, and the annual mean accumulation rate was 250 mmw.e., these values being derived from 10m deep ice-core drilling at the summit (4000ma.s.l) of Tsast Uul ice cap (located to the west of Tsambagarav) in June 1991 (Reference Schotterer, Fröhlich, Gäggeler, Sandjordj and StichlerSchotterer and others, 1997).
Mean (1961–90) monthly air temperature (curve: right axis) and precipitation (bars: left axis) at Khovd. About 70% of total precipitation occurs in summer (June–August).

3. Data
Four kinds of data were used in this study as follows:
3.1. Topographical maps (scale 1 : 100 000) published in 1970 and 1971
Tavan Bogd region: M45–104 (based on air photographs taken in 1945)
Turgen massif: M46–75, M46–87 and M46–88 (based on air photographs taken in 1968)
Kharkhiraa massif: M46–87 (based on air photographs taken in 1968)
Tsambagarav massif: M46–110, M46–122 (based on air photographs taken in 1948)
3.2. Landsat 7 Enhanced Thematic Mapper Plus (ETM+) band 8
Tavan Bogd region: path 143, row 26, 6 August 2000
Turgen/Kharkhiraa massifs: path 142, row 25, 10 September 2000
Tsambagarav massif: path 142, row 26, 10 September 2000
3.3. Corona photos (black-and-white positives)
Tavan Bogd region: 22 June 1962
Tsambagarav massif: 26 August 1963 and 11 August 1968
3.4. Aerial photographs (scale 1 : 43 000 to 1 : 45 000)
Tavan Bogd region: 4 and 7 September 1988
Turgen massif: 21 July 1988
Kharkhiraa massif: 2 July 1988
Tsambagarav massif: 20 July and 19 September 1987
4. Methods
The quality of materials presently available led to the use of the following two methods. Method 1 enabled us to evaluate changes in glaciers quantitatively, while method 2 gave us only qualitative changes.
4.1. Method 1
-
1. Geometrical rectification of the Landsat images with the maps
-
2. Comparison between the maps and the Landsat images
The images were geometrically rectified using about 20 points identified in the corresponding maps, evenly distributed around the massif. Root-mean-square errors were less than one pixel (<15 m). The areas of the glaciers in the images were then measured and compared with those in the maps. Figure 3 shows an overlay view of the image of Kharkhiraa massif as an example.
An overlay view of the image of Kharkhiraa massif. The solid lines denote glacier area drawn in the topographical map. The image is Landsat 7 ETM+ band 8, path 145, row 25, taken on 10 September 2000. The southernmost glacier area described in the map, indicated by an arrow, could not be identified and was discounted from this study.

4.2. Method 2
-
1. Comparison between Landsat images and Corona photos
-
2. Comparison between Landsat images and aerial photos
-
3. Comparison between Corona photos and aerial photos
These procedures were carried out visually, because we could not rectify aerial photos and Corona photos with the maps and/or Landsat images. Figures 4–6 show examples of pairs for comparison.
The tongue of Potanin glacier in 1988 (left) and in 2000 (right). There is no obvious change in its shape or position.

Tongues of glaciers in Turgen (top) and Kharkhiraa (bottom) massifs in 1988 (left) and in 2000 (right). No obvious change is identified between the two years.

Glaciers in Tsambagarav massif in 1963 (left) and in 2000 (right). There is no obvious change in shapes of glaciers between the two years.

5. Results
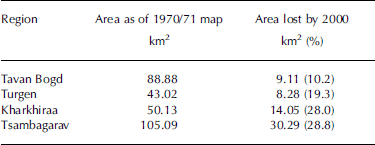
The changes in area obtained by method 1 are compiled in Table 1. The glaciers in the study area lost 10–30% of their area during the period from the 1940s to 2000 or from 1968 to 2000.
Changes of glacier area in four regions, derived by comparing maps with satellite images. The maps of Tavan Bogd and Tsambagarav are considered to represent states of glaciers in the 1940s, and those of Turgen and Kharkhiraa represent states of glaciers in 1968 (see text). Note that part of the glacier area on the map of Kharkhiraa was discounted
As shown in Figures 4–6, the glaciers in Tavan Bogd, Kharkhiraa and Turgen regions have been almost stationary since 1987/88. This means that retreat of the glaciers occurred between 1945 and 1987/88 in Tavan Bogd region and between 1968 and 1987/88 in Kharkhiraa and Turgen regions. The glaciers in Tsambagarav massif showed no significant change in area since 1963. This suggests the reduction in glacier area occurred mainly between 1948 and 1963.
The results obtained by the two methods are summarized in Figure 7.
Glacier shrinking periods/magnitudes for each region obtained in this study.

6. Discussion
Of the four regions, Tsambagarav showed the largest loss of glacier area in the shortest period. As mentioned in section 2, flat-top-type glaciers predominate in this region. Reference Narozhniy and NikitinNarozhniy and Nikitin (2003) found a similar tendency in glacier area reduction in the Russian Altai. They showed that flat-top-type glaciers lost 16.1% of their area on average (range 8–30%), whereas valley glaciers lost 4% of their area (range 2.5–8%) during 1954–98. Flat-top-type glaciers are more sensitive to equilibrium-line-altitude (ELA) change than valley-type glaciers, because even a small shift in ELA affects a large area of flat-top-type glaciers. This implies that climatic warming, especially during the summer, raises the ELA, causing this glacier shrinkage. Figure 8 shows anomalies of summer (June–August) air temperatures and annual precipitation at the three meteorological stations shown in Figure 1. At Ulgii and Khovd it was relatively warm and dry from 1940 to the mid-1950s, when the glaciers in this region shrank. Warm periods occurred in the mid-1960s, 1970s and late 1990s, but no significant changes were observed in the glaciers. They may have lost enough area in the period from 1940 to the mid-1950s that they held onto their shrunken area in the following warm periods, i.e. they reached a state of near-equilibrium with the first warm and dry climate. However, there remains the possibility that thinning of glacier ice could have occurred. Glaciers in the Turgen/Kharkhiraa regions lost area during the period 1968– 1987/88. Reference LehmkuhlLehmkuhl (1998) reported that glaciers in Turgen retreated 200–500m between 1948 and 1991. At the nearby meteorological station Ulaangom, conditions were warm and dry in the 1970s and then cool and wet till the mid-1990s (Fig. 8).
Climatological data at the meteorological stations Ulgii, Ulaangom and Khovd, 1940–2000. Mean summer (June–August (JJA)) air temperature (curves) and annual precipitation (bars) are shown, as anomalies from 1961–90 mean. Elevations of the stations are shown in parentheses.

The shrinkage of Mongolian glaciers between the 1940s and the late 1980s in this study suggests that climatic warming occurred in the glaciated regions of Mongolia. In the Russian Altai, Reference Henderson, Laube, Gäggeler, Olivier, Papina and SchwikowskiHenderson and others (2006) found a summer (June–August) air-temperature warming of 1.6˚C over the last century by analyzing the melt percentage of the ice cores recovered at Belukha col (49˚48′26.3″ N, 86˚34'42.8'' E; 4062ma.s.l.). They identified a transition towards a warmer trend at 1940–50. On the other hand, Sofiyskiy glacier, Russian Altai, has been retreating steadily since the beginning of the 20th century. Average retreat rates are 18.3, 17.3 and 8.6 ma–1 during the periods 1898–2000, 1939–63 and 1963–2000 respectively (after Reference PattynPattyn and others, 2003). However over the last decade, at least, Mongolian glaciers showed no significant change. Mongolian glaciers seem to behave differently from other glaciers which have been experiencing steady shrinkage throughout the period.
7. Concluding Remarks
The glacier variations described in this study are limited to shapes and area. It may be that downwasting occurred, even though no change in glacier area was found. Information on surface elevation changes is needed; the climatological data available are limited to low elevations. Furthermore, mass-balance studies are required that will link glaciers to climate. In order to understand the relation between glacier change and climate, we commenced in situ observations (e.g. of mass balance, flow and depth) of Mongolian glaciers in September 2003. First results will be published elsewhere in the near future.
Acknowledgements
We appreciate comments and suggestions from R. Armstrong and an anonymous reviewer, which improved the manuscript.



