INTRODUCTION
Anthropogenic soil perturbation such as agricultural activities can exacerbate carbon dioxide (CO2) emissions by the decomposition of soil organic matter (SOM) or soil respiration (Schlesinger Reference Schlesinger2000). In general, the conversion of forest to cropland leads to a loss of the soil organic carbon (SOC) pool, although this may not be the case for conversion to pastures (Murty et al. Reference Murty, Kirschbaum, McMurttrie and McGilvray2002). Once a soil is cultivated for agricultural production, especially in semi-arid regions, SOM is rapidly decomposed due to changes in conditions such as aeration, temperature and water content (Ashagrie et al. Reference Ashagrie, Zech, Guggenberger and Mamo2007). Soil-carbon sequestration and biological stability of SOC depends on several factors, including the chemical structure of SOC, environmental factors such as temperature, moisture and aeration, soil properties (Krull et al. Reference Krull, Baldock and Skjemstad2003), and different land uses and types of management (Castro et al. Reference Castro, Fernández-Ondoño, Rodríguez, Lallena, Sierra and Aguilar2008; Vázquez et al. Reference Vázquez, Merlo, Noe, Romero, Abril and Carranza2013; Vieira et al. Reference Vieira, Silva, Oliveira, Lima, Da Silva and Silva2013).
Olives are one of the most abundant crops in the Mediterranean region, occupying a very stable cultivated area (Freibauer et al. Reference Freibauer, Rounsevell, Smith and Verhange2004) of some 9·4 million hectares (Civantos Reference Civantos, Barranco, Fernández-Escobar and Rallo2004), and more than 2·5 million hectares in Spain (MAAM 2013). Conventional olive-grove management maintains vegetation-free soil between trees by applying herbicides, thus increasing erosion risks, especially in the Mediterranean region where the climate is characterized by seasonal torrential rains. Soil erosion leads to fertility loss with a decrease in organic carbon (C) and other nutrients, and also has physical consequences: reduction in aggregation, decline in soil structure, crusting and reduction in water infiltration (Lal Reference Lal2004; Hernández et al. Reference Hernández, Lacasta and Pastor2005). The strategy of controlling soil erosion using cover crops and restoring degraded soils has the potential to sequester organic C in vegetation and soil as well as to reduce the enrichment rate of atmospheric CO2 concentration (Lal Reference Lal2001). Thus, olive groves with cover crops protect soils from erosion while the ground cover improves physicochemical soil properties, favouring biodiversity and contributing to CO2 fixation (Repullo-Ruibérriz de Torres et al. Reference Repullo-Ruibérriz de Torres, Carbonell-Bojollo, Alcántara-Braña, Rodríguez-Lizana and Ordóñez-Fernández2012).
Alterations in the different fractions of SOM are reportedly more effective in indicating changes in soil use than the total SOC content and thus functional SOC pools should be quantified and characterized to predict changes in SOC storage (Lützow et al. Reference Lützow, Kögel-Knabner, Ekschmitt, Flessa, Guggenberger, Matzner and Marschner2007). Soil organic carbon exists as a mixture of different fractions with turnover times ranging from minutes to millennia, depending on its stability. Mechanisms of SOC-stabilization can be summarized as chemical recalcitrance of SOM and physical protection by encapsulation into aggregates or increased stability due to interactions of SOC with mineral surfaces and metal ions (Lützow et al. Reference Lützow, Kögel-Knabner, Ekschmitt, Matzner and Guggenberger2006). For the consequences of climate and land-cover change to be predicted and ameliorated, a clear understanding of the distribution of SOC among diverse pools is required (Jobbágy & Jackson Reference Jobbágy and Jackson2000). The turnover rates of the different SOC fractions have been calculated, although there is no consensus in the literature on appropriate chemical treatments for the experimental isolation of SOC fractions with different turnover rates.
Physical and chemical techniques can be used to determine the partitioning of SOC into different pools with variable turnover times and stability (Baldock et al. Reference Baldock, Masiello, Gélinas and Hedges2004). Among the chemical methods, acid hydrolysis and chemical oxidation have been used frequently. Biodegradable molecules such as proteins, polysaccharides or nucleic acids can be removed by hydrolysis with hydrochloric acid (HCl), leaving recalcitrant bio-molecules like cutans and suberans (Helfrich et al. Reference Helfrich, Flessa, Mikutta, Dreves and Ludwig2007). Hydrofluoric acid (HF) dissolves soil minerals, breaking silicon–oxygen bonds and releasing the SOC fraction, which is stabilized by its adsorption to the mineral matrix (Gélinas et al. Reference Gélinas, Baldock and Hedges2001). Eusterhues et al. (Reference Eusterhues, Rumpel, Kleber and Kögel-Knabner2003) used a chemical oxidation procedure with sodium peroxodisulphate (Na2S2O8) for characterizing the SOM stabilization. Changes in SOM by Na2S2O8 can be compared to those occurring during the humification process, removing the least protected SOC fraction and causing enrichment in high chemical recalcitrance organic compounds (Lorenz et al. Reference Lorenz, Lal, Preston and Nierop2007).
Despite numerous approaches to improve the fractionation methods, a major, persisting problem is that most procedures are not specific enough with regard to the stabilization mechanism (Lützow et al. Reference Lützow, Kögel-Knabner, Ekschmitt, Flessa, Guggenberger, Matzner and Marschner2007), because different stabilization mechanisms can coexist at the same time. However, the application of different fractionation methods can lead to an interpretation of the different mechanisms of SOC stabilization that take place in soils and to an evaluation of how they vary with different soil uses and management types.
The aim of the current work was to evaluate the stabilization mechanisms of SOC in agricultural soils with different uses and management types in comparison with an unaltered soil that maintains native vegetation in a semi-arid Mediterranean area (Southeastern Spain).
MATERIALS AND METHODS
Study site and soil properties
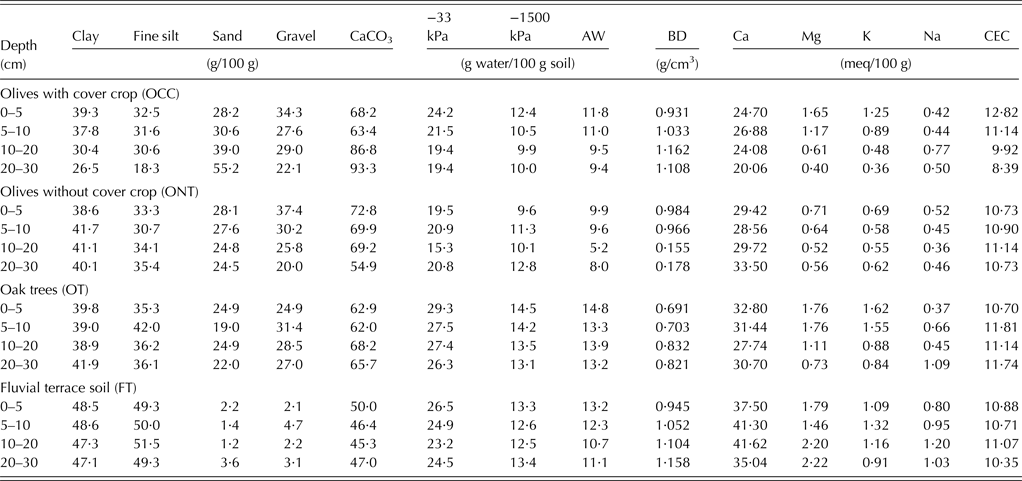
The study site was located in Píñar (Granada, SE Spain), at Hoya Marín (37°24′N, 03°29′W, 687 m a.s.l.). This area was mainly agricultural, dominated by cereals and olive trees with small areas of extensive oak forests typical of the ‘Dehesa’ in Southern Spain. The climate was typically Mediterranean, characterized by a mean annual precipitation of 563 mm occurring mainly during autumn and winter, and the summer being notably dry. Mean monthly temperatures ranged from 8 °C in winter to 27 °C in summer, with a mean annual value of 16 °C. The relief was hilly and the soils were developed on limestone, being classified mostly as Regosols and Calcisols (IUSS Working Group WRB 2014). The soils under olive groves and natural vegetation (oak trees; OT), where slopes varied from 32 to 39%, respectively, had loamy textures, while the soil from the fluvial terrace (FT) was located in a plain area and had more clay due to the accumulation of fine material eroded from the steep upland areas, especially those under olive trees (Table 1). Soils were strongly carbonated, had alkaline pH values and the exchangeable complex was saturated in calcium. Values of cation-exchange capacity were moderate due to the abundance of illite within the clay fraction and the moderate organic C content.
Soil properties for all soils studied

−33 kPa: moisture at field capacity; −1500 kPa: moisture at permanent wilting point; AW, available water; BD, bulk density; CEC, cation exchange capacity.
Four soils with different uses and management types were sampled at the study site in May 2011. Two were under olive-grove cultivation and could be differentiated by the presence (OCC) or absence (ONT) of a cover crop located between trees on lines perpendicular to the maximum slope. Both olive groves had a drip irrigation system with no-till soil management. The cover crop consisted of herbaceous crops, mostly Gramineae (Bromus matritensis, B. rubens, B. diandrus, Taeniantherum caput-medusae), Fabaceae (Trifolium sp.), Rosaceae (Sanguisorba minor) and Compositae (Bombicylaena discolor, Leontodon longirostris). During the summer season the live cover crop was removed with a mower, leaving the plant debris on the soil surface together with the pruning debris. The third soil sampled, an FT soil, had a rotation system of cereal, sunflower and a fallow period. The management consisted of one mouldboard ploughing after the summer to a depth of 20–25 cm for burying the plant debris from the previous harvest. This was followed by a field cultivator passing in spring to eliminate the weeds and the final preparation of the bed of seedlings in different seasons depending on the crop: autumn for cereals and spring for sunflowers. Soil nitrogen (N), phosphorus (P) and potassium (K) fertilizers were applied before sowing. Finally, a nearby unaltered soil under oaks (OT) was also sampled.
Soil sampling and analysis
In each of the four experimental plots, three replicates of soil samples were taken in a 30 m linear transect located in the centre of the row between olive tree lines in both OCC and ONT soils, and in the centre of the FT and OT soil areas. At each sampling point, trial pits were opened (50 cm wide×30 cm deep) and samples were taken at depths of 0–5, 5–10, 10–20 and 20–30 cm after removing the fresh plant debris from the soil surface. Bulk samples of mineral soil taken at each depth were thoroughly homogenized, air dried at room temperature and passed through a 2-mm sieve. For chemical analysis, an aliquot of the soil was ground in a ball mill. Total C was analysed by a LECO® TruSpec CN (St. Joseph, MI, USA) after soil samples were acid-washed (HCl 1 mol/l for 24 h) to remove carbonates, following Ussiri & Lal (Reference Ussiri and Lal2008). Three replicates of each soil sample were measured as a quality control and the accuracy of the analysis was tested using a LECO Calibration Sample (502–062). During the analytical batch, one calibration sample was analysed every 24 measurements. The equivalent calcium carbonate content was determined by gas volumetry (Barahona Reference Barahona1984). The soil texture was analysed using the Robinson pipette method (Soil Conservation Service 1972). The capacity and exchangeable cations were determined according to the methodology of the Soil Conservation Service (1972). Soil moisture at −33 and −1500 kPa was achieved using the pressure-membrane method (Richards & Weaver Reference Richards and Weaver1944) and available water capacity was calculated as the difference between water content at field capacity (−33 kPa) and permanent wilting point (−1500 kPa). Soil bulk density (BD) was determined by a gravimetric method using a cylinder 5 cm high and 7 cm in diameter and correcting the total volume according to the percentage of gravel (Nieto et al. Reference Nieto, Castro and Fernández-Ondoño2013) (Eqn 1):
 $$BD(g/cm^3 ) = \displaystyle{{Wc - Wg} \over {Vc}}$$
where Wc was the dry weight of the soil in each cylinder (g), Wg was the weight of gravel (>2 mm) (g) and Vc was the volume of the cylinder (cm3). The SOC pool (t C/ha) was calculated using Eqn 2:
 $$SOCPool\left( {t\,{\rm C/ha}} \right) = SOC \times BD \times {\rm d}$$
where SOC was the organic carbon concentration (g/100 g), BD was the bulk density (g/cm3) and d was the soil depth (cm).
The SOC was oxidized by treatment with Na2S2O8 (Lorenz et al. Reference Lorenz, Lal and Shipitalo2008). Briefly, 0·5 g of ground soil was dispersed in 250 ml of distilled water and allowed to react with 20 g of Na2S2O8, buffered with 22 g sodium bicarbonate (NaHCO3) for 48 h at 80 °C. After oxidation, the suspension was centrifuged at 2500 g for 15 min and the supernatant was decanted (Jagadamma et al. Reference Jagadamma, Lal, Ussiri, Trumbore and Mestelan2010). The soil residue was washed three times with 40 ml distilled water. To isolate mineral-associated SOC, soil samples were demineralized with HF (Lorenz et al. Reference Lorenz, Lal and Shipitalo2008). Briefly, 20 ml of 10% HF was added to 2 g of ground soil; the suspension was hand-shaken for 30 s and allowed to react for 15 h at room temperature. The supernatant was removed by siphoning with a tube attached to a plastic syringe, and the HF treatment was repeated twice. The undissolved material was washed six times with 40 ml of distilled water by centrifugation 2500 g for 15 min to remove HF. Recalcitrant SOM was determined by placing 1 g of ground bulk soil in a 200-ml digestion flask and adding 25 ml of 6 mol/l HCl, and hand shaking for 30 s (Paul et al. Reference Paul, Collins and Leavitt2001). After incubation at room temperature for 16 h, the supernatant was removed after centrifugation at 2500 g for 15 min. The residue was washed six times with 40 ml of distilled water. Finally, residues from the Na2S2O8, HF and HCl treatments were dried for 72 h at 40 °C and immediately weighed. The isolated pellets were ground for C analysis using a pestle and mortar to pass through a 0·25 mm sieve. The mineral-associated SOC was the SOC dissolved after the HF treatment, calculated as the difference between the total SOC concentration of each soil sample and the SOC concentration in the residue after HF treatment.
The biological activity of soil microorganisms was determined by establishing the soil respiration rate with the indirect impedance measurement, based on CO2 determination using two electrodes immersed in a 2% potassium hydroxide (KOH) solution. Soil samples (<2 mm) were saturated with water for 24 h and subsequently dried at field capacity (−33 kPa) using the method of Richards & Weaver (Reference Richards and Weaver1944). Soil (5–6 g) at field capacity was weighed in an open plastic tube that was subsequently inserted into another tube containing 2 ml of 2% KOH and then hermetically sealed. The impedance measurement was made at 30 °C for 96 h in a BacTrac 4200 Microbiological Analyser (Sylab, Austria).
Statistically significant differences in SOC fractions and total SOC with soil depth and between uses and management types were tested by a one-way analysis of variance (ANOVA) and the least significant difference (LSD) at a significance level of P<0·05 was used to identify differences between means. The variables were tested to the normalized Shapiro–Wilk normality test and to Bartlett's homogeneity test of variance. Pearson's correlation coefficient was used to analyse the relationships between variables. Statistical analyses were made using the SPSS® for Windows©, Ver. 15·0·1.
RESULTS
Soil organic carbon
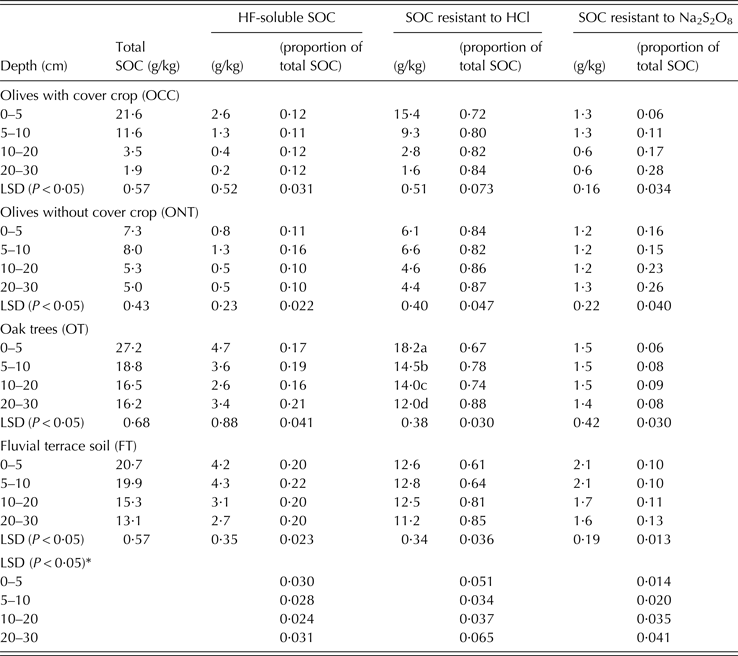
The SOC content reduced significantly (P<0·05) with depth in the four soil uses considered (Table 2), reaching maximum values within the uppermost 5 cm, between 27·2 g C/kg for the OT soil and 7·3 g C/kg for the ONT soil.
ANOVAS (P < 0·05), total SOC for, HF-soluble SOC, HCl-resistant SOC, Na2S2O8-resistant SOC and C balance of these fractions for all soils studied
* LSD (P < 0·05) indicates significant differences between soil uses for a given depth.
In terms of soil use, in the OCC soil the values of organic C content reduced more than threefold below 10 cm in depth. On the contrary, the ONT soil, despite having a lower SOC content at the surface layers, had a more homogeneous SOC distribution with depth, registering values between 10 and 30 cm depth that were higher than in the OCC soil. In the FT soil, the decline in SOC with depth was less than in olive grove soils due to the burial of plant debris from the previous harvest. The OT soil had significantly (P<0·05) higher SOC concentrations throughout the profile than did the agriculture soils (OCC, ONT and FT) except for the FT soil at 5–10 cm depth.
Regarding the C pool in the upper 30 cm of the four soils studied, the greatest content was found in the FT soil (52·47 t/ha), followed by the OT soil (43·01 t/ha) and finally the olive grove soils (OCC 22·35 and ONT 19·59 t/ha). The transformation of natural soils to agricultural ones has been associated with a rapid decrease in the organic C content. However, current results showed a greater C pool in the FT soil with respect to the OT soil.
Soil respiration
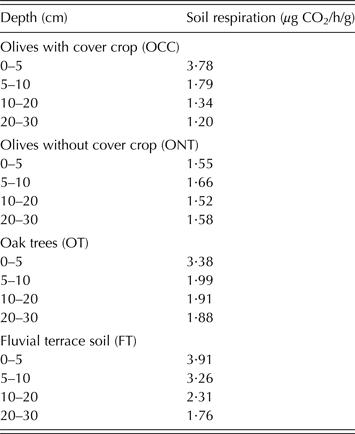
The biological activity of soil microorganisms, expressed as a function of the respiration process, decreased with depth (Table 3). The soil respiration rate was positively correlated with SOC concentration (correlation coefficient = 0·846; P < 0·01), available water (correlation coefficient = 0·889; P < 0·05) and soil moisture content at field capacity (correlation coefficient = 0·909; P < 0·01). Differences were found in the soil respiration rates when considering the different soil uses and types of management. At the surface layer (0–5 cm), the respiration rate of ONT soil was less than half that of the rest of the soils considered. Below 5 cm deep, differences in soil respiration rates with depth in the two olive grove soils (OCC and ONT) were less pronounced. On the other hand, soil respiration rates were higher in the OT soil than in either of the two olive grove soils and much higher in the FT soil, at least down to 20 cm deep.
Soil respiration rate in all soils studied
Chemically separated soil organic carbon fractions
The concentrations of HF-soluble SOC were higher in the uppermost levels and decreased with depth, ranging from 4·7 g HF-soluble SOC/kg in the uppermost 5 cm of the OT soil to 0·2 g HF-soluble SOC/kg in the OCC soil at the 20–30 cm depth layer (Table 2). Between 0·10 and 0·22 of total SOC fraction in the first 30 cm was released upon dissolution of the mineral phase with HF (Table 2), showing significantly (P < 0·05) higher values in the OT soil and especially in the FT soil.
The proportion of HCl-resistant SOC with respect to the total C varied from 0·61 to 0·88 and increased significantly (P < 0·05) with depth in all soils except for ONT (Table 2). Depending on the soil use, the main differences appeared in the first 10 cm, with higher values in the olive grove soils with respect to the alluvial and natural soils. There were no differences between 10 and 30 cm, except for the OT soil between 10 and 20 cm.
Non-oxidizable SOC concentrations showed an unequal distribution with depth depending on the soil use and management type (Table 2). There were no significant differences within the upper 30 cm in ONT and OT soils, but it decreased significantly (P < 0·05) with depth in the OCC and FT soils. The proportion of non-oxidizable SOC with respect to the total SOC increased markedly with depth in the olive grove soils (OCC and ONT), but was less abrupt in the other two soils (FT and OT). There were significant differences (P < 0·05) in the relative non-oxidizable SOC depending on soil use, showing higher proportions in the olive grove soils than in the OT and FT soils.
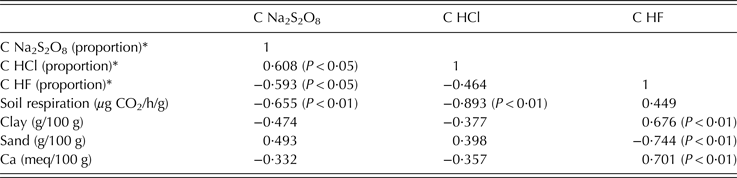
The SOC fractions were correlated significantly (P < 0·05) with each other (Table 4), showing positive correlations between the HCl-resistant SOC and the non-oxidizable SOC and negative correlations in the other two cases. The soil respiration rates were negatively correlated with the HCl-resistant SOC and the non-oxidizable SOC, and positively correlated with the HF-soluble SOC, although there were no significant differences. As for the soil properties, there were only significant correlations (P < 0·05) between the textural fractions and the exchangeable calcium with the HCl-resistant SOC.
Bivariate correlations between the concentrations of soil organic carbon fractions and soil properties
* C Na2S2O8: SOC non-oxidizable (proportion of total SOC); C HCl: SOC HCl-resistant (proportion of total SOC); C HF: SOC HF-soluble (proportion of total SOC).
DISCUSSION
Soil organic carbon
The input of organic matter into the soils came from the vegetation residue left on the surface and incorporated slowly into the soil (Sayer Reference Sayer2006), as well as from root systems (Rasse et al. Reference Rasse, Rumpel and Dignac2005). In the OCC soil the C input into the surface was much higher than in the ONT soil due to plant and pruning debris, and the shallow but dense root system of the cover crop. This was also pointed out by Nieto et al. (Reference Nieto, Castro and Fernández-Ondoño2013), who found that the cover crops of olive groves in Andalusia (South Spain) were responsible for between 0·44 and 0·85 of the C input for the uppermost 15 cm of the soil. This suggests that the differences in SOC in soils with different types of management are more significant on the surface layers (Castro et al. Reference Castro, Fernández-Ondoño, Rodríguez, Lallena, Sierra and Aguilar2008). However, the differences in SOC concentration from 10 to 30 cm observed in the olive soils are due to the natural variability of SOC content and are independent of the type of management.
In the FT soil, the higher input of plant debris in the subsurface layers counteracted the higher mineralization of the organic matter in the tilled soils (Lal Reference Lal2004), thus showing higher SOC values than the olive grove soils.
The high concentrations of SOC within the uppermost layer of the OT soil were due to the presence of dead oak leaves, which are difficult to mineralize and thus undergo partial humification. This was revealed by the formation of a very dark O2 horizon composed of very well-transformed organic matter below an O1 horizon formed mainly by recently dead leaves. The high SOC concentration in the sub-surface layers of the OT soil, especially within the first 30 cm, was due to the dense root system formed by different-sized roots.
The SOC concentration was greater in the OT soil than in the FT soil. However, the carbon pool was higher in the FT soil compared with the OT soil. This was probably due to the input of eroded material from higher areas and its accumulation in the FT area, forming a layer >1 m thick. This made the gravel content in the FT soil significantly lower than in the rest of the soils analysed, thus affecting the value of the BD and sharply reducing the value calculated for the C pool in the most gravelly soils. Therefore, the C pool registered in the FT soil is not comparable with those of the other soils. As for the other three soils (OCC, ONT and OT), a noticeable decline in the C pool was found in the olive grove soils, >50% greater than in the OT soil. Among the olive grove soils, the difference in the C pool proved lower than expected since the influence of the cover crop affected the uppermost 10 cm of the soil, diluting its effect when considering the pool at 30 cm deep.
Soil respiration
Soil respiration is a composite process integrating two major C fluxes, i.e. autotrophic respiration of plant roots and heterotrophic respiration through soil microbial activities (Janssens & Pilegaard Reference Janssens and Pilegaard2003), and is influenced by a multitude of environmental factors such as temperature (Campbell et al. Reference Campbell, Sun and Law2004), moisture (Vincent et al. Reference Vincent, Shahriari, Lucot, Badot and Epron2006; Butler et al. Reference Butler, Meir, Saiz, Maracahipes, Schwantes-Marimon and Grace2012), soil quality, land use (Raich & Potter Reference Raich and Potter1995) and C pool in roots, litter and topsoil (Zhou et al. Reference Zhou, Zhang, Zha, Luo, Zheng and Sun2013). Laboratory experiments with respirometers are useful for standardizing parameters such as moisture and temperature, making it possible to compare the results found in soils with different uses and management types. In such experiments, only the biological activity of soil microorganisms – essential for SOM decomposition – is measured (Bing-Ru et al. Reference Bing-Ru, Guo-Mei, Jian and Gang2006). According to the literature, the highest soil respiration rates are registered in soils with more organic matter and field capacity, which correspond to FT and OT soils in the current study. Soil respiration rates decreased with depth in all cases, since the vertical distribution of microbial concentrations decrease with depth due to more suitable moisture, temperature and oxygen content in the topsoil (Yang et al. Reference Yang, Tian, Sun and Zhang2011). The decrease in respiration rates in the sub-surface horizons, below 5 cm, was less pronounced in the FT soil than in the other soils considered. This was probably due to the tilling of the FT soil, which increased sub-surface aeration with respect to the OCC, ONT and OT soils. Moreover, the addition of plant debris from the previous harvest increased the input of C to the sub-surface of FT soil in comparison with the others. The higher soil respiration rates in OT soil with respect to the olive soils can be attributed to the higher SOC content in the OT soil.
Chemically separated soil organic carbon fractions
Eusterhues et al. (Reference Eusterhues, Rumpel, Kleber and Kögel-Knabner2003) pointed out the negative correlation between the 14C activity and the C release after dissolution of the mineral matrix by HF, which indicates a strong association of stabilized C compounds with the mineral phase. However, Swanston et al. (Reference Swanston, Torn, Hanson, Southon, Garten, Hanlon and Ganio2005) and Eusterhues et al. (Reference Eusterhues, Rumpel and Kögel-Knabner2007) showed that the mineral-associated SOC comprised an old, stable fraction but can also include a SOC fraction with a high turnover rate.
Carbon loss after HF treatment is reported to be within the range of 10–30% of the total SOC for surface horizons, increasing with soil depth (Mathers et al. Reference Mathers, Xu, Berners-Price, Perera and Saffigna2002; Eusterhues et al. Reference Eusterhues, Rumpel, Kleber and Kögel-Knabner2003; Lorenz et al. Reference Lorenz, Lal and Shipitalo2006). However, the current results showed that C loss after HF treatment of total SOC varied only slightly in the soils considered. Hydrofluoric acid reacts with silica to form soluble fluoride complexes and preferentially mineral-bound organic matter is released, while the non-associated SOC remains unaffected. Thus, the positive correlation between the relative HF-soluble SOC and the clay fraction and the negative correlation with the sand fraction would be expected. While the quartz particles that dominate the sand fraction exhibit only weak bonding affinities to soil organic matter, the clay-sized particles provide a large surface area and numerous reactive sites where SOM can be sorbed by strong ligand exchange and polyvalent cation bridges (Sposito et al. Reference Sposito, Skipper, Sutton, Park, Soper and Greathose1999). There was also a significant positive correlation between the relative HF-soluble SOC and the exchangeable calcium, which in neutral and alkaline soils may act as a cationic bridge allowing the interaction of the organic matter and clay (Lützow et al. Reference Lützow, Kögel-Knabner, Ekschmitt, Matzner and Guggenberger2006).
The higher proportion of HF-soluble SOC in the FT soil may be due to the addition of plant debris after harvest and its abundance in clay particles. The high soil respiration rate measured in the FT soil and the positive correlation between the soil respiration rate and the relative HF-soluble SOC suggest the occurrence of a rapid transformation of plant debris mixed into the soil by tillage and the stabilization of organic compounds by the soil clay fraction. In this sense, Lützow et al. (Reference Lützow, Kögel-Knabner, Ekschmitt, Matzner and Guggenberger2006) pointed out that the stabilization mechanisms of organic matter due to the association with the mineral fraction were dynamic processes that play a key role when the organic matter starts to degrade. The OT soil also had a relatively high HF-soluble SOC content and similar circumstances to those in FT soil occurred, with high inputs of plant debris on the soil surface in the form of dead leaves, and a dense root system in deeper layers.
The relative proportions of HCl-resistant SOC increased significantly with depth, except in the ONT. There is no general consensus among researchers on the variation in relative proportions of HCl-resistant SOC with depth. Paul et al. (Reference Paul, Follett, Leavitt, Halvorson, Peterson and Lyon1997) and Collins et al. (Reference Collins, Elliott, Paustian, Bundy, Dick, Huggins, Smucker and Paul2000) reported a decrease with depth, Lorenz et al. (Reference Lorenz, Lal and Shipitalo2006) found no significant differences between horizons, and Jha et al. (Reference Jha, De, Lakaria, Biswas, Singh, Reddy and Rao2012) noted an increase with depth.
Paul et al. (Reference Paul, Follett, Leavitt, Halvorson, Peterson and Lyon1997), studying several soils, reported that the HCl-non-resistant SOC was much younger than the HCl-resistant SOC, both at the surface as well as in sub-surface soils. Hence, the SOC in olive grove soils in the present study could be more stable than in the other soils considered, at least in the upper 10 cm. However, the HCl treatment removes polyvalent cations involved in clay flocculation and micro-aggregation, causing the occlusion and complexation of the SOM soluble (Oades Reference Oades1988). Other studies provide evidence that the acid hydrolysable SOM contains polysaccharides, proteins and long-term stabilized amino acids within the fine mineral fractions (Gleixner et al. Reference Gleixner, Poirier, Bol and Balesdent2002; Knicker Reference Knicker2004; Leifeld & Fuhrer Reference Leifeld and Fuhrer2005). These findings explain the negative correlation found between the HCl-resistant and the HF-soluble SOC in relation to the total SOC.
Thus, HF-soluble and HCl-resistant SOC fractions do not necessarily include the whole stable SOC, nor does this interpretation exclude additional stabilization mechanisms such as chemical recalcitrance. Oxidative methods to determine stable SOC fractions cause changes in the SOC composition similar to those observed during natural microbial oxidative processes (Cuypers et al. Reference Cuypers, Grotenhuis, Nierop, Franco, de Jager and Rulkens2002). Mikutta et al. (Reference Mikutta, Kleber, Kaiser and Jahn2005), Helfrich et al. (Reference Helfrich, Flessa, Mikutta, Dreves and Ludwig2007) and Jagadamma et al. (Reference Jagadamma, Lal, Ussiri, Trumbore and Mestelan2010) indicated that among the several chemical methods tested, the Na2S2O8 treatment was one of the most efficient in isolating a refractory SOC fraction.
The relative non-oxidizable SOC contents depended on soil use, with higher proportions in the olive grove soils than in the OT and FT soils. This could be due to the differences in biological activity among soils, showing a negative correlation between the soil respiration rate and the relative non-oxidizable SOC. A lower soil respiration rate implies less biological activity and thus less oxidation of SOM, favouring the humification process that can lead to more complex and stable organic compounds. The OT and the FT soils had lower relative non-oxidizable SOC proportions and higher respiration rates than the olive grove soils, suggesting that chemical recalcitrance is a relevant SOC stabilization mechanism in these soils.
In addition, there was a significant positive correlation between relative non-oxidizable SOC and relative HCl-resistant SOC, both representing stable SOC fractions due to the recalcitrance of the organic-matter compounds. According to the literature, acid hydrolysis effectively removes carbohydrate and protein materials by disrupting hydrolytic bonding, leaving the more biologically recalcitrant materials (lignin, suberin, cutin and waxes) largely intact (Lützow et al. Reference Lützow, Kögel-Knabner, Ekschmitt, Flessa, Guggenberger, Matzner and Marschner2007).
CONCLUSIONS
Soil properties, use and management significantly determine soil capacity for carbon fixation and the mechanisms of carbon stabilization. The transformation from a natural to an agricultural soil decreases the SOM content, although this can also be influenced by soil use and agriculture management. The current study, the FT soil had SOC contents slightly lower than the OT soil, despite tillage. This is due to the addition of plant residue from previous harvests and the fallow rapidly degraded by intense biological activity, being partially fixed and stabilized by association with the fine mineral-soil fraction as the principal SOC stabilization mechanism in these soils. On the other hand, the olive soils had SOC concentrations significantly lower than the OT and TF soils and there were differences depending on the presence or absence of a cover crop. The cover crop significantly increased the SOC concentration within the first 10 cm. The olive soils had a lower biological activity than the OT soil, especially with depth, but higher non-oxidizable SOC concentration with respect to the total carbon, so chemical recalcitrance of SOC seems to be a relevant stabilization mechanism in these soils.