Introduction
The chemotaxis of Caenorhabditis elegans, a free-living nematode, was first described by Ward (Reference Ward1973). Several salts, some amino acids and some nucleotides were identified as water-soluble attractants for C. elegans. With regard to skin-penetrating parasitic nematodes, a component of the host blood is related to the host finding and penetrating behaviours of their infective third-stage larvae (L3). Wauters et al. (Reference Wauters, Klaver-Wesseling and Vetter1982) and Vetter et al. (Reference Vetter, Vingerhoed, Schoeman and Wauters1985) indicated that dog serum contained an attractant for the L3 of the hookworm Ancylostoma caninum. Subsequently, Tobata-Kudo et al. (Reference Tobata-Kudo, Higo, Koga and Tada2000) and Forbes et al. (Reference Forbes, Ashton, Boston and Schad2003) revealed that sodium chloride, a major component of serum, was one of the chemoattractants for the L3 of the threadworms Strongyloides ratti and S. stercoralis, respectively.
Although filarial worms are one of several skin-penetrating helminths, the penetration behaviour of filarial L3 is unlike that of the L3 of hookworms and threadworms. The L3 of hookworms can penetrate the intact skin of hosts directly and invade the body of a host (Vetter & van der Linden, Reference Vetter and van der Linden1977). On the other hand, when infected mosquitoes feed on a host, filarial L3 emerge from the proboscis and lie on the skin surface of the host (Ewert, Reference Ewert1967; Ewert & Ho, Reference Ewert and Ho1967). They presumably then move towards the bite wound made by the mosquito and penetrate the skin via the wound. It is easily surmised that a component of the host blood affects the movements of filarial L3 towards the bite wound.
A recent study (Gunawardena et al., Reference Gunawardena, Fujimaki and Aoki2003) revealed that the filarial L3 of Brugia pahangi, a skin-penetrating parasitic nematode, were highly attracted to the serum of Mongolian jird (Meriones unguiculatus). In addition, Kusaba et al. (Reference Kusaba, Fujimaki, Vincent and Aoki2008) showed that the sera derived from various mammals attracted filarial L3. These results suggested that the sera contained an attractant for the L3. Thus, sodium ions, a major component of serum, have been regarded as a promising attractant of the L3. Nevertheless, no attempt has yet been made to assess the chemoattractant activity of sodium ions for filarial L3, even though identification of the chemical attractant is an important prerequisite for understanding the mechanisms of skin-penetrating infection of filarial L3.
The objective of the present study was to investigate the chemotactic reactivity of sodium chloride for B. pahangi L3 using the modified method of Gunawardena et al. (Reference Gunawardena, Fujimaki and Aoki2003).
Materials and methods
Chemicals
Hanks' balanced salt solution (HBSS) was purchased from Nissui Pharmaceutical Co. Ltd (Tokyo, Japan). Fetal bovine serum (FBS) was purchased from Gibco (Langley, Oklahoma, USA). NaCl, Na2HPO4, KCl, K2HPO4, CaCl2 and MgCl2 were purchased from Wako Pure Chemical Industries, Ltd (Osaka, Japan). All the other chemicals and salts were of analytical grade.
Parasite strain
The filarial parasite B. pahangi used in the present experiment had been maintained in Mongolian jirds (M. unguiculatus) and Aedes aegypti (Liverpool strain) mosquitoes in the Animal Research Center for Tropical Infections at the Institute of Tropical Medicine, Nagasaki University. Brugia pahangi L3 were harvested from mosquitoes that had been fed on microfilaraemic jirds 2 weeks previously. The infected mosquitoes were dissected in HBSS thereafter. L3 were collected and washed twice in HBSS prior to assays of the chemotactic responses of L3.
The experimental protocol was approved by the Animal Care and Use Committee, Nagasaki University. Animal care and experimental procedures were performed in accordance with the Guidelines for Animal Experimentation of Nagasaki University.
Assay using fetal bovine serum and salts
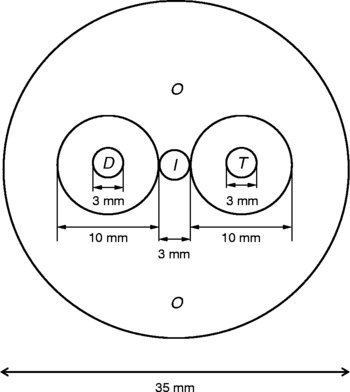
The chemotactic responses of filarial L3 to FBS and salts were measured on agar plates according to a modified method previously described by Gunawardena et al. (Reference Gunawardena, Fujimaki and Aoki2003). Briefly, a 35-mm Petri dish (Sumilon, Sumitomo Bakelite Co. Ltd, Tokyo, Japan) was filled with 2 ml of 0.6% (w/v) Noble agar (Difco Laboratories, Inc., Detroit, Michigan, USA) dissolved in hot deionized water (DW) and allowed to cool at room temperature. The agar plate was placed over a template transparency sheet (fig. 1) on which three circles 3 mm in diameter were drawn to indicate areas where L3 (I-area), test solution (T-area) and DW (D-area) were spotted. The sheet also contained two concentric circles of 10 mm each, indicating test solution (T) and DW (D) zones, and outside zone (O) surrounding the I-area, the T- and D-zones. One microlitre of DW was spotted at the I-area of an agar plate. Immediately, approximately ten L3 were placed into the I-area in the agar plate using a fine needle. Two microlitres of test solution containing FBS or test salts dissolved in DW at concentrations of 100 or 200 mm, and 2 μl of DW were spotted on the right (T) and left (D) areas, respectively. Then the agar plate was placed on a hot plate (ND-1, Asone Corporation, Osaka, Japan) with temperature adjusted to 35°C. Over a period of 60 min or after 30 min, the number of L3 accumulating in the four sectors (I-area, T-, D- and O-zones) was determined by counting under a dissecting microscope. The assays were repeated six times for each test solution. In the assay for responses of filarial L3 to NaCl, NaCl was dissolved in DW at concentrations of 0 (control), 50, 100, 150, 200, 250, 300, 350 and 400 mm, and used as test solutions.
Diagrammatic representation of the sectors used to quantify the larval response to test solutions. The small circles marked by I, D and T, indicate the areas on to which 1 μl of deionized water (DW) and infective third-stage larvae (I-area), 2 μl of DW alone (D-area) and test solution (T-area) were placed, respectively. The large concentric circles were marked as D- and T-zones, and the outside zone was marked as O.

Statistical analysis
The proportion of filarial L3 accumulating in each sector was expressed as 100 × (number of L3 in each sector)/(total number of L3 applied to the six agar plates). A 95% confidence interval (95% CI) of the proportion was calculated according to the procedure described by Daniel (Reference Daniel1999a). Furthermore, comparisons of the proportions of L3 accumulating in the T-zone of a test salt solution and DW (control group) were conducted using the z-test (Daniel, Reference Daniel1999b).
Results
Responses to fetal bovine serum
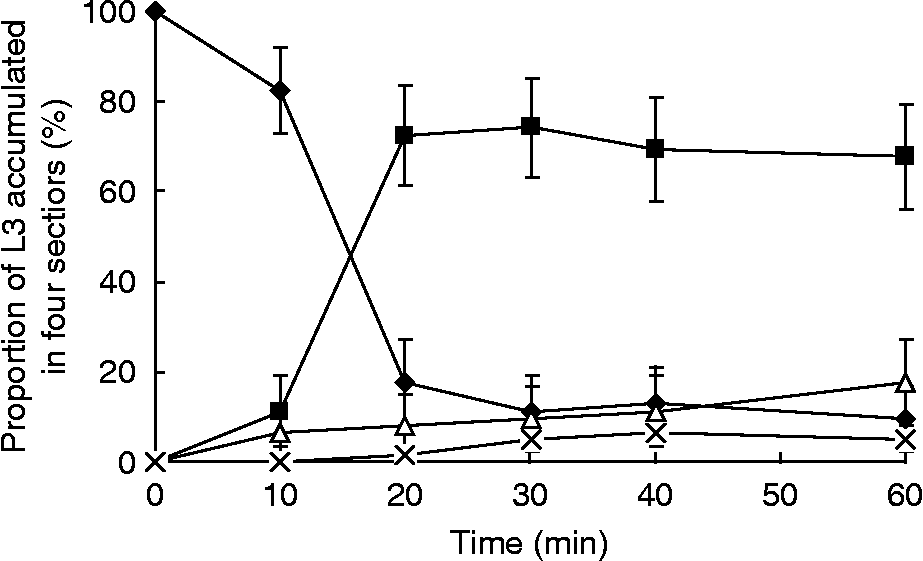
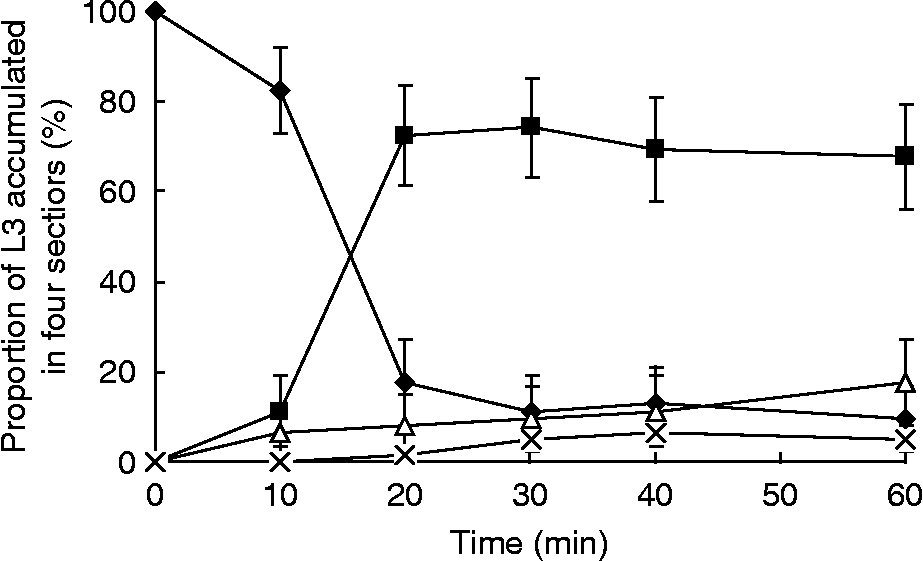
The time course of the chemotactic response of filarial L3 to FBS is presented in fig. 2. About ten L3, FBS and DW were applied to the I-, T- and D-areas of an agar plate, respectively, and the numbers of L3 accumulating in the four sectors (I-area, T-, D- and O-zones) were counted over a period of 60 min. The assays were repeated six times. Figure 2 shows the proportion of L3 accumulating in each sector at 10, 20, 30, 40 and 60 min. At 10 min after the application of L3, FBS and DW to the agar plate, 82% of L3 remained in the I-area, while 18% of L3 moved toward the D-, T- or O-zone. At 20 min, only 18% of L3 remained in the I-area, while 73% of L3 had moved to the T-zone of FBS. At 30 min, the proportion of L3 accumulating in the T-zone reached the peak of 74%. Subsequently, the proportion of L3 accumulating in the T-zone gradually decreased, and the proportion of L3 in the O-zone gradually increased up to 18% at 60 min.
The time course of the chemotactic response of infective third-stage larvae (L3) of Brugia pahangi to fetal bovine serum (FBS). Four sectors are indicated as follows: ♦, I-area; ■, FBS-zone; △, O-zone; × , D-zone. Each error bar shows the 95% confidence interval for the proportion of L3 accumulating in each sector.
Responses to test salts
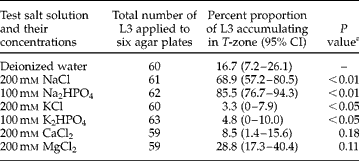
Table 1 shows the chemotactic response of L3 to salts: NaCl, Na2HPO4, KCl, KH2PO4, CaCl2 and MgCl2. The accumulation of L3 in the T-zone of test salt solutions was observed 30 min after about ten L3, test salt solution and DW were applied to an agar plate. When DW was applied to T- and D-areas as the control group, 17% of L3 moved to the T-zone. Meanwhile, 69% and 86% of L3 accumulated in the T-zone of 200 mm NaCl and 100 mm Na2HPO4, respectively. Both 200 mm NaCl and 100 mm Na2HPO4 attracted L3 at a significantly higher level than DW (P < 0.01 and P < 0.01). On the contrary, the L3 were likely to avoid 200 mm KCl and 100 mm K2HPO4 (P < 0.05 and P < 0.05). L3 showed no significant tendency to avoid or to be attracted to 200 mm CaCl2 and 200 mm MgCl2.
Chemotactic responses of infective third-stage larvae (L3) of Brugia pahangi to different salts.
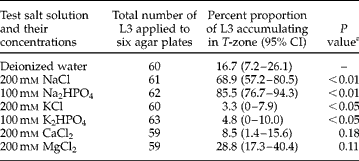
The number of L3 accumulating in each sector was counted 30 min after around 10 L3, deionized water (DW) and test solution were placed on an agar plate. The assays were repeated six times for each test solution.
a The proportion of L3 accumulating in the T-zone of each test salt was compared with that in DW (control) according to the z-test.
Responses to sodium chloride
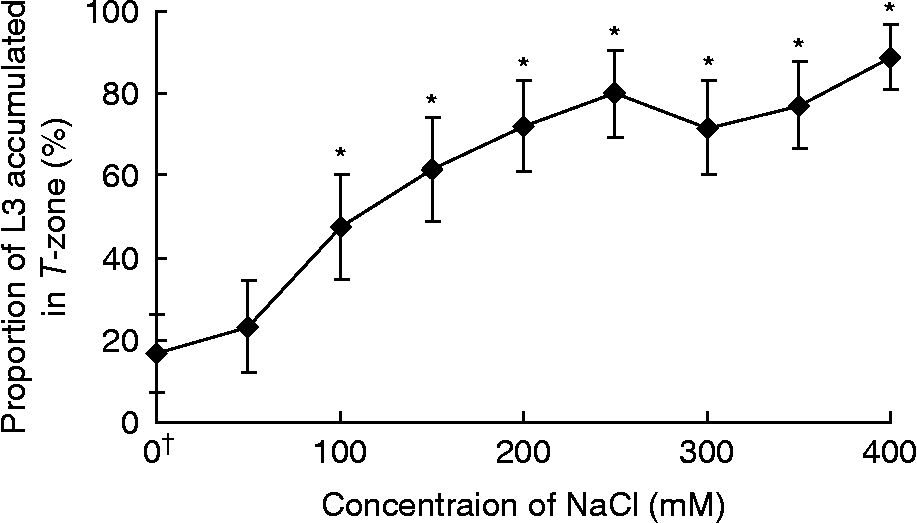
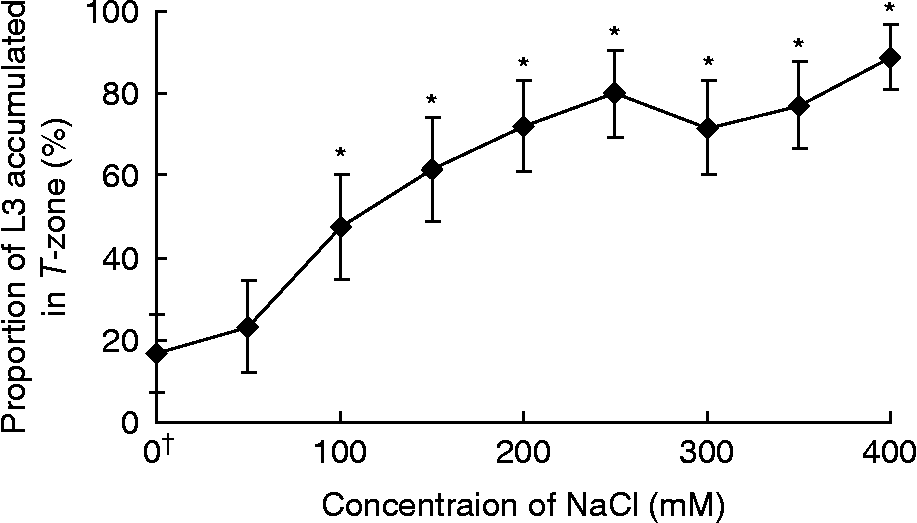
The chemotactic response of L3 to NaCl was observed in the concentration range of 0 mm to 400 mm (fig. 3). The accumulation of L3 in a T-zone of NaCl was observed 30 min after about ten L3, NaCl solution and DW were applied to an agar plate. The assays were repeated six times for each concentration of NaCl. When NaCl was applied to the T-area at a concentration of 50 mm, 23% of L3 accumulated in the T-zone. The proportion of L3 accumulating in the T-zone was slightly higher than that with DW (17%). At concentrations of more than 100 mm, NaCl attracted L3 at a significantly higher level than DW (P < 0.01).
The effect of NaCl concentration on the chemotactic responses of infective third-stage larvae (L3) of Brugia pahangi. Each error bar shows the 95% confidence interval for the proportion of L3 accumulating in the T-zone. *P < 0.01, the proportion of L3 accumulating in the T-zone of NaCl at different concentrations was compared with that of deionized water (DW), z-test. †Control (DW alone in the T-zone).
Discussion
The response of an organism to environmental changes is crucial to its survival. Parasitic nematodes of warm-blooded hosts use chemical signals in host finding. Tobata-Kudo et al. (Reference Tobata-Kudo, Higo, Koga and Tada2000) and Forbes et al. (Reference Forbes, Ashton, Boston and Schad2003) revealed the chemotactic activity of NaCl for infective L3 of S. ratti and S. stercoralis, respectively. Filariae are also skin-penetrating parasitic nematodes, and their infection of hosts involves a chemotactic response. Recent studies (Gunawardena et al., Reference Gunawardena, Fujimaki and Aoki2003; Kusaba et al., Reference Kusaba, Fujimaki, Vincent and Aoki2008) have suggested that mammalian sera contain a chemoattractant for B. pahangi L3. Since these studies, however, there has been little progress in investigations regarding the attractants of B. pahangi L3.
The procedure previously described by Gunawardena et al. (Reference Gunawardena, Fujimaki and Aoki2003) applied HBSS to the I-area where filarial L3 were inoculated (fig. 1). As a method for testing the chemotactic response of L3 to salts, HBSS was thought to be unsuitable, because it contained salts similar to those tested for the chemotactic response of L3. Thus, in the present study, DW alone was spotted on to an I-area instead of HBSS. In addition, the volume applied to the I-area was reduced from 2 μl to 1 μl to shorten the lingering time of L3 in the I-area, because a large amount of DW spotted in the area confined L3 to the I-area until the DW was either absorbed into the agar plate or evaporated (fig. 1). In the modified chemotaxis assay, the peak proportion of L3 accumulating in the T-zone of FBS was reached at 30 min after L3, FBS and DW were placed on the agar plate (fig. 2). On the other hand, the peak proportion of L3 accumulating in the T-zone of FBS by the chemotaxis assay of Gunawardena et al. (Reference Gunawardena, Fujimaki and Aoki2003) was observed at 60 min. After the application of L3 to the agar plate, the L3 were induced to move toward the T-zone of FBS earlier in the modified assay than in the assay of Gunawardena et al. (Reference Gunawardena, Fujimaki and Aoki2003). In the modified chemotaxis assay, 30 min was considered the optimal time for observing the chemotactic response of L3 to salts.
NaCl, Na2HPO4, KCl, K2HPO4, CaCl2 and MgCl2 were examined for the chemotactic response of B. pahangi L3 (table 1). L3 were significantly more attracted to 200 mm NaCl (69%) and 100 mm Na2HPO4 (86%) than to DW (17%). These results suggest that sodium ions are one of the attractants of B. pahangi L3. Although Tobata-Kudo et al. (Reference Tobata-Kudo, Higo, Koga and Tada2000) and Forbes et al. (Reference Forbes, Ashton, Boston and Schad2003) revealed that sodium chloride was a chemoattractant of S. ratti and S. stercoralis L3, respectively, the chemotactic response of L3 to NaCl was observed when L3 were placed in a concentration of NaCl lower than 20 mm and 10 mm. In general, the L3 of parasitic nematodes seem to recognize sodium ions as an attractant. Conversely, filarial L3 were likely to avoid 200 mm KCl and 100 mm K2HPO4 (table 1), suggesting that potassium ions are a negative attractant to L3. On the other hand, L3 showed no significant tendency to avoid or to be attracted to CaCl2 and MgCl2. Sodium, potassium and magnesium ions are attractants of C. elegans, a free-living nematode (Ward, Reference Ward1973), thus the chemotactic responses of filarial L3 to metal ions differed greatly from those of C. elegans.
The peak proportion of filarial L3 accumulating in the T-zone of NaCl was dependent on NaCl concentration in the T-zone up to 250 mm. NaCl significantly attracted the L3 at a lower concentration of 100 mm, which is less than the concentration of sodium ions in human blood (130–150 mm). Thus, 100 mm might be a sufficient concentration for sodium ions to attract filarial L3 in natural infections.
Although the present study revealed the remarkable attraction of B. pahangi L3 to NaCl, animal blood is composed not only of sodium ions but also other various substances. Thus, it is presumed that other substances, although as yet unidentified, can also exhibit chemoattractant activity for filarial L3. In addition, Safer et al. (Reference Safer, Brenes, Dunipace and Schad2007) recently revealed that urocanic acid (UCA) was the chemoattractant for S. stercoralis, a skin-penetrating parasitic nematode. UCA is also expected to be the chemoattractant for B. pahangi L3. It is surmised that, in natural infection of a host, filarial L3 recognize not only sodium ions but also other substances of the host blood leaking from the wound caused by a mosquito bite and move to the wound before penetrating the skin. Besides substances of the host blood, other biological substances may be related to the migratory behaviour of filarial L3 on the skin of their natural hosts. Then, the finding that sodium ions are a chemoattractant of the L3 is the first step for an understanding of the mechanisms of skin-penetrating infection by the third-stage larvae.
Acknowledgements
This work was partially supported by the Japanese International Cooperation Agency (JICA) scholarship programme.