


1. Introduction
Glacier retreat on Mount Kenya from the turn of the century to 1963 has been investigated in a sequence of papers (Reference KrussKruss and Reference HastenrathHastenrath, 1987, 1990; Hastenrath and Reference Kruss and HastenrathKruss, 1988), with special consideration for mountain topography and solar radiation geometry. The conclusions of these and earlier studies relevant to the present paper may be summarized as follows: (i) the existence of the largest ice masses in the eastern quadrants of the mountain, both in 1899 and in 1963 Fig. 1and2, was largely due to the precipitation distribution, characterized by largest totals to the southeast and driest conditions in the north; (ii) the glaciers are located mostly between 4600 and 5000 m, near the annual mean elevation of the 0°C isothermal surface; (iii) the retreat between 1899 and 1963 was forced by climatic change beginning in the early 1880s with a 150 mm a−1 decrease in annual precipitation (and concomitant reduction in cloudiness and glacier albedo) followed by a temperature rise of about 0.3°C (Reference KrussKruss, 1983); (iv) the effect of increased solar radiation absorption had to be taken into consideration to account for the magnitude of the responses and the differential retreat rates of glaciers in the various portions of the mountain over the first two-thirds of this century.
We re-mapped the glaciers of Mount Kenya at scale 1:5000, using aerial photography of September 1987 (Reference Hastenrath and KrussHastenrath and others, 1989). From this survey and a map at the same scale from January 1963 (Forschungs-unternehmen Nepal-Himalaya, 1967), the changes of all glaciers on the mountain between 1963 and 1987 were reconstructed. This affords the opportunity of addressing the important question: has significant climate change occurred in East Africa during the past quarter-century?
2. Background
In our earlier work (Reference KrussKruss and Reference HastenrathHastenrath, 1987, 1990; Reference Hastenrath and KrussHastenrath and Kruss, 1988), the radiation geometry was found to be of prime importance in driving the magnitudes of observed glacier retreats. Thus, the topographically more shielded glaciers (Joseph, Northey, Krapf, Tyndall Fig. 1and2) retreated the least and to even more protected configurations. By contrast, the ice wastage was particularly pronounced for the large but radiationally very exposed glaciers to the east (Gregory, Kolbe, Lewis), of which one (Kolbe), in fact, vanished altogether after 1926. The remaining two eastern glaciers, as well as the Cesar Fig. 1 and 2, became overall even more vulnerable to solar radiation. Thus, it is necessary in the first instance to evaluate the observed changes in the glaciers between 1963 and 1987 in the light of changes in amounts of incident radiation.
Map of Mount Kenya’s glaciers. The ice extents in 1899, 1963 and 1987 are shown by dotted, broken and solid lines, respectively. The key below lists, for the north and south sides of the mountain and from west to east, the names of glaciers indicated on the map by numbers, with ** denoting a glacier which disappeared between 1963 and 1987, and * ice entities which vanished prior to 1963. Scale 1 : 20000 (sources: Forsehungsuntemehmen Nepal-Him-alaya, 1967; Hastenrath and others, 1989). North side: 12* NW Pigott, 13 Cesar, 14 Joseph, 15* Peter, 16 Northey, 17* Arthur, 18* Mackinder, 1 Krapf, 2 Gregory. South side: 11* Barlow, 10 Tyndall, 9 Heim, 8 Forel, 7 Diamond, 6 Darwin, 5** Melhuish, 4 Lewis, 3* Kolbe.

As in our previous studies, a radiation model was used to compute the clear-sky solar radiation throughout the diurnal and annual cycles.using representative turbidity, humidity and pressure conditions. The entire mountain topography was input at gridpoints at a 50 m spacing to incorporate shading by topographic obstacles and slope effects. Representative cloud conditions were also taken into account. The observed glacier changes between 1963 and 1987 are presented in the next section, while sections 4–6 are concerned with the climatic implications of these cryospheric changes.
3. Glacier Changes Between 1963 and 1987
The evaluation of area and volume changes between January 1963 and September 1987 is detailed in Hastenrath and others (1989). Note that the estimates of area and volume change between 1963 and 1987 are less well defined for the Krapf and Diamond Glaciers than for the other glaciers on the massif.
Relief diagrams of Mount Kenya and its glaciers. Glacier boundaries in 1899, 1963 and 1987 are entered as heavy solid lines. Contour interval is 25 m and vertical exaggeration is 2 : 1. North/south and east/west sides of block are 2.45 and 2.25 km long, respectively, with vertical lines marking each 50 m. zenith angle of view is 60°. (A): view from southwest azimuth 225°. Non-corner tick marks on west (left) and south (right) sides of block denote 00°09′00″ S and 30°18′30′ E, respectively. Lowest height contour (southwest corner) is 4250 m and highest contour (top center) is 5175 m. With reference to Figure 1, glaciers depicted are from left to right: 11* Barlow, 10 Tyndall, 9 Heim, 8 Forel, 7 Diamond, 6 Darwin, 5** Melhuish, 4 Lewis. (B): view from north-northwest azimuth 335°. Non-corner tick marks on west (right) and north (left) sides of block denote 00°09′″ S and 30°18′30″ E, respectively. Lowest height contour (lower left) is 4275m and highest contour (top center) is 5175m. With reference to Figure 1, the glaciers depicted are from left to right: 2 Gregory, 1 Krapf, 16 Northey, 15* Peter, 14 Joseph, 13 Cesar, 12* NW Pigott.

Table 1 summarizes the glacier areas in 1899, 1963 and 1987. During the 88 years between 1899 and 1987, the overall area loss amounted to about 75% of the 1899 areal extent, corresponding to an average rate of 0.8% a−1. In comparison, during the 24 years from 1963 to 1987, an area reduction of almost 40% was observed at the considerably more rapid relative rate of 1.6% a−1.
Area of ice cover in 1899, 1963 and 1987, and mean area, volume change and surface lowering in 1963–87

Glacier-average mean annual global radiation for 1899, 1963 and 1987, and for the areas vacated by the ice between these dales (Δ), in W m−2. Cloudiness five-tenths except for clear skies during mornings of the January/February and August dry seasons, with topographic shading. The corresponding value for clear sky and no shading is 385 W m−2 for all glaciers and all three epochs. The 1963 to 1987 retreat of Heim could not be resolved, Diamond retreated to one gridpoint, and Melhuish disappeared. Hence, south-side means are computed from Tyndall, Forel, Darwin and Lewis only.

The 1987 re-mapping of glacier surface topographies also made it possible to assess changes in ice volume over the interval between 1963 and 1987 (Table 1). All glaciers suffered major volume reductions, but the magnitude of the changes varied widely from a minimum of 81 × 103 m3 (Melhuish) to a maximum of 3554 × 103 m3 (Lewis).
Table 1 presents mean values of change in ice thickness between 1963 and 1987, as determined by Hastenrath and others (1989). The similarity in surface lowering values among the glaciers is quite remarkable, given the wide variations in length, area, volume, slope and aspect. The observed surface lowering on Mount Kenya between 1963 and 1987 was generally between 10 and 20 m despite a range in area from 5 to 300 × 103 m3 and in volume change from 80 to 3500 × 103 m3.
4. Solar Radiation Forcing
Given the importance of solar radiation geometry to the retreat rates of Mount Kenya’s glaciers before 1963, it is necessary to examine geometry-forced changes in incident radiation which have taken place since 1963. Table 2 lists results from the radiation model for typical cloud conditions for 1899, 1963 and 1987. While the Joseph, Northey, Tyndall, Krapf and Darwin Glaciers retreated to more protected locations between 1899 and 1963, a small radiation increase is indicated for the period between 1963 and 1987 at all glaciers. This is because recession during this latter period has been so pronounced that these glaciers have retreated through the most protected areas of shaded valleys onto more exposed upper slopes.
Figure 3 compares surface lowering with computed mean radiation. The variability envelopes show measured surface lowering to be essentially independent of radiation amount, with, in fact, the lowest values of surface lowering being associated with maximum incident insolation (Lewis and Gregory Glaciers). Thus, radiation geometry is not a controlling factor in the glacier wastage between 1963 and 1987.
Surface lowering, ΔH (in m), versus mean solar radiation (average of 1963 and 1987 values), Rad (in W m−2) between 1963 and 1987 for all glaciers. Crosses and dots denote glaciers on the north and south sides of massif, respectively. Glaciers are indicated by letters as follows. North side: Cesar C, Joseph J, Northey N, Krapf K, Gregory G; south side: Tyndall T, Heim H, Forel F, Diamond Di, Darwin Da, Lewis L. (a) clear sky; (b) representative cloud conditions.

5. Sensitivity Analysis
The purpose of this section is to estimate the magnitude of various environmental forcings sufficient to produce the decrease of ice thickness observed over the period from 1963 to 1987. Inasmuch as this was remarkably uniform for all glaciers, processes other than solar radiation must have been the controlling factor. Of particular interest here are the effects of changing atmospheric composition, environmental warming and atmospheric humidity trends.
The data contained in Table 1 yield a total volume change of 9402 × 103 m3 over a total mean area of 648 × 103 m−2. This corresponds to an average thickness change of 14.51 m over 24.5 years, or 590 mm a−1. This 590 mm is mostly ice and, in the upper portions of the glaciers, dense snow and firn; thus, a mean density of 850 kg m−3 is deemed appropriate. Hence the average 590 mm a−1 of ice or firn translates to an average of 500 mm liquid water equivalent per year. Given the latent heats of sublimation, Ls = 284 × 104 J kg−1, and of melting, Lm = 33 × 104 J kg−1, the energies required to dispose of this layer of ice amount to 46 W m−2 for evaporation and 5.4 W m−2 for melting.
The observed, strongly negative, net balance between 1963 and 1987 could, in principle, be brought about by a decrease in precipitation alone, without the involvement of any energy-budget processes. However, the precipitation stations on the Kenya highlands show little long-term changes in recent decades, and surely none of order 500 mm a−1 (more than half of the long-term average precipitation in the upper ranges of Mount Kenya).
Accordingly, the explanation for the observed ice thinning must be sought in the glacier heat budget. Regarding solar radiation, it may be noted from Reference Kruss and HastenrathKruss and Hastenrath (1987) that a decrease of cloudiness of about four-tenths would be sufficient alone to supply the required energy, given the location of the glaciers at high altitude, essentially at the equator. Because of the radiation geometry, however, this would lead to a differential thinning of the glaciers. A similar consideration applies to decreased atmospheric turbidity or a decrease of glacier albedo as might result from enhanced dust deposition.
Having eliminated changes in precipitation and solar radiation, consideration can now concentrate on the following three terms in the glacier heat budget: sensible and latent heat transfer, Qs and Q e, respectively, and net longwave radiation LW↑↓. Simple bulk formulations from Hastenrath (1984, p. 247–252) will suffice as frame of reference for the energy sensitivity analysis.
The basics of sensible and latent heat transfer across the glacier-air interface can be understood from the bulk aerodynamic equations (Hastenrath, 1984, p. 249)
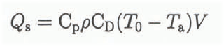

where Cp = 103J kg−1 K−1 is the specific heat of air at constant pressure, ρ = 0.740 kg m−3 is the air density at 580 mbar and 0°C, and CD is the drag coefficient describing the roughness of the surface, here about 2 × 10⁻³. Τ is temperature and q is specific humidity. The subscripts zero and a refer to ice surface and air (say at about 2 m above the surface), respectively. V is wind speed, here of order 5 m s−1. The assumption of a glacier surface temperature of T0 = 0°C, an air temperature of T a = +1°C, and a relative humidity of 80%, yields typical magnitudes for Qs of about 7 W m−2, and for Qe of about 20 W m−2.
Net longwave radiation can be calculated from (Reference BudykoBudyko, 1974, p. 57–60; Hastenrath, 1984, p. 247–248)

where ε signifies emissivity of the glacier surface, here taken as 0.95 (Reference SellersSellers, 1965, p. 41; Reference BudykoBudyko, 1974, p. 58), σ = 567 × 10−10 W m−2 K−4 is the Stefan-Boltzmann constant, e is the vapor pressure in mbar, Ta and T0 are air and surface temperatures in K, and C is the fractional cloudiness. The second bracket on the right reflects the reduction of net longwave radiation with cloudiness. The formula implies a background contribution by carbon dioxide and other “greenhouse” gases, but ignores the effect of changing dry atmospheric composition. Assuming again T a = + 1°C and a relative humidity of 80% (equivalent to e = 5.4 mbar), as well as cloudiness C = 0.5, yields a typical magnitude for LW↑↓ of about 70 W m−2.
With reference to the above assessment of typical magnitudes, we shall, in the following, consider the effect of small changes in environmental conditions on Q s, Q e and LW↑↓. It is recognized in these considerations that the glaciers are in an elevation range near the annual mean 0°C isothermal surface and that the temperature of the glacier surface cannot rise above 0°C. Regarding the sensible heat transfer from air to glacier, Q s, Equation (1) indicates that an increase of air temperature T a by 0.1°C results in an increment of 0.7 W m−2. The latent heat transfer from glacier to air, Qe, would, according to Equation (2), be reduced by 2 W m−2 per 0.1 gkg−1 increase in specific humidity of the air q a. The net longwave radiation LW↑↓ is seen from Equation (3) to be sensitive to both cloudiness and atmospheric humidity. An increase in cloud of one tenth would, by itself, lower LW↑↓ by 4 W m−2, but this would be overcompensated by a much larger decrease in input of solar radiation. Regarding the effect of atmospheric humidity by itself, an increase in q of 0.1 g kg−1 translates into a reduction of LW↑↓ by 0.2 W m−2 in the peak region of Mount Kenya. While Equation (3) does not address the effect of changes in dry atmospheric composition on LW↑↓, Reference Dickinson and CiceroneDickinson and Cicerone (1986) estimated the change in “thermal trapping”, or change in surface net longwave radiation, due to increasing “greenhouse” gases (CO2, CH4, O3, N2O, CFC-ll/CFC-12) from pre-industrial to 1985 concentrations to be about 2.2 W m−2. An appropriate value for the period from 1963 to 1987 and the 580 mbar altitude domain of the glaciers on Mount Kenya may be 1 W m−2 or less.
These sensitivity estimates need to be placed in perspective with observational evidence on changes in temperature and humidity, in order to examine to what extent the various heat budget processes may contribute to the energy supply of 5.4 W m−2 required to produce the observed ice thinning.
A 0.2°C increment of the temperature average over the 1963–87 interval corresponds to a warming trend similar to that reported by Reference Wolter and HastenrathWolter and Hastenrath (1989) for the sea-surface temperature in the western Indian Ocean between 1948 and 1983. From an evaluation of long-term station records in the Kenya highlands and northern Tanzania, as well as the estimates made by Reference JonesJones (1988), the possibility of changes between 0.0 and about 0.2°C cannot be ruled out.
Of further interest, then, are the latent-heat implications of a specific humidity increase. Relevant in this context are the findings of Reference Hense, Krahe and FlohnHense and others (1988), who demonstrated an increase in specific humidity in the 500–700 mbar layer (Mount Kenya’s glaciers are at the 580 mbar level) in the equatorial belt of 0.6 g kg−1 between 1965 and 1984, and related it to the “global warming” and “greenhouse effect”. As an immediate cause of the atmospheric moisture increase, Reference Flohn and KapalaFlohn and Kapala (1989) discussed the role of intensified sea-air interactions over the tropical oceans resulting from increases in sea-surface temperature, interface humidity contrast and wind speed. In the well-ventilated upper reaches of Mount Kenya, moisture conditions are primarily controlled by advection, so that a specific humidity increase would not require a local warming. Speculations about spatial differences of such small humidity changes in the limited altitude realm of Mount Kenya’s glaciers do not seem warranted. Note that a specific humidity increment of 0.3 g kg−1 would be sufficient, by itself, to account for the observed ice thinning between 1963 and 1987.
Schematic diagram of three “greenhouse”-induced climatic forcings contributing to the observed ice-thickness change (see section 5). Met longwave radiation due to thermal trapping , downward-directed sensible heat flux Q s, and upward-directed latent heat flux Q e. ΔTa and Δq denote change in atmospheric temperature, and specific humidity, respectively. A energy lists the corresponding change in the energy budget of the ice. indicates change in net longwave radiation related to humidity change; this latter causality chain is shown in thin print to indicate that it is considered to be of subordinate importance.

An increase of atmospheric humidity would also reduce the net longwave radiative loss; this effect is in the same sense as, but an order of magnitude smaller than, that resulting from the reduced latent-heat transfer. It may be argued further that increased atmospheric humidity would be conducive to enhanced cloudiness, which would reduce the absorbed solar radiation overall and also mitigate spatial contrasts. This would counteract the energy savings from the reduced latent heat transfer, and likewise contribute towards a greater spatial uniformity of ablation.
To synthesize these considerations, the following combination of climatic forcings is found most plausible to supply the energy of 5.4 W m−2 required to effect the observed ice thinning through melting Fig. 4: a longwave radiational contribution from “thermal trapping” of 0.5 to 1.0 W m−2; a warming of 0.0 to 0.2°C, possibly in part caused by “thermal trapping”, contributing through sensible heat transfer 0.0 to 1.4 W m−2; and a 0.1 to 0.2 g kg−1 increase in specific humidity, possibly in part induced by atmospheric warming, which, through latent heat transfer, would make available 2 to 4 W m−2. The longwave radiational effect of this moisture increase is an order of magnitude smaller.
With the upper bounds for thermal trapping of 1.0 W m−2, and for sensible heat transfer of 1.4 W m−2, the energy supply to be accounted for by humidity effects amounts to (5.4–2.4 =)3.0 W m−2. Given the sensitivities to latent heat flux and longwave radiation discussed above, this corresponds to an increment in specific humidity of 0.14 g kg−1. With the lower bounds for thermal trapping of 0.5 W m−2, and for the sensible heat transfer of 0.0 W m−2, the humidity-related energy requirement is (5.4–0.5 =) 4.9 W m−2, corresponding to a specific humidity increase of 0.24 g kg−2. Considering the possibility of a cloudiness increase accompanying a rise in atmospheric humidity, and hence reduction of absorbed solar radiation, slightly larger increments in specific humidity may be required.
6. Conclusions
In an attempt to identify the nature of the major climatic forcings operative between 1963 and 1987 on Mount Kenya, sensitivity analyses were conducted and interpreted in the context of observational evidence. The setting of Mount Kenya’s glaciers in an altitude environment near 0°C, and the circumstance that the glacier surface cannot become warmer than that threshold, assist in making the problem tractable. The central issue is to explain the observed mass deficit of 500 mm a−1 liquid water equivalent, corresponding to a required additional energy supply for melting of 5.4 W m−2. Processes that cannot have played a major role are to be eliminated successively. To begin with, precipitation deficits of this massive magnitude are not supported by the long-term gauge monitoring on the Kenya highlands. Solar radiation/cloud changes, as well as dust/albedo effects, are ruled out by the spatial uniformity of the observed ice thinning. This leaves, as possibly pertinent, the following three heat-budget terms: the downward-directed sensible heat transfer from air to ice, primarily controlled by the air temperature; the upward-directed latent-heat transfer, mainly dependent on specific humidity; and the net longwave radiation, which varies mainly with changes in dry-atmospheric composition (“greenhouse effect”), the impact of changing atmospheric moisture being of subordinate importance at the altitude of Mount Kenya.
Figure 4 illustrates the contributions of these terms towards the aforementioned energy requirements of 5.4 W m−2, through three lines of causality, (i) The direct “greenhouse effect” on the net longwave radiation, as obtained from published estimates, can provide only a small fraction towards this required energy supply, (ii) Atmospheric warming is itself widely regarded as a result of the “greenhouse effect”. From long-term temperature records in the region an increment no larger than 0.2°C appears plausible. The corresponding sensible heat transfer may contribute up to a third towards the total energy required, (iii) Most crucial appears to be a specific humidity increase reported in the literature for the mid-troposphere of the equatorial belt, and regarded as a possible consequence of the “greenhouse effect” and “global warming”. In the well-ventilated upper reaches of Mount Kenya, moisture conditions are advectively controlled. A specific humidity increase of less than 0.3 g kg−1 would reduce latent heat and longwave radiation expenditures sufficiently to complete the energy requirements for the observed ice thinning between 1963 and 1987. All three of these lines of forcing may conceivably be controlled by the “greenhouse effect”. The impact of changes in dry-atmospheric composition on the longwave radiation budget plus the warming discussed above are insufficient to supply the required energy amounts. Indeed, an increase in atmospheric water vapor content is required to account for the drastic wastage of Mount Kenya’s glaciers over the past quarter-century.
Acknowledgements
This study was supported by National Science Foundation grant EAR-9016657. The research is authorized by the Office of the President, Republic of Kenya. We thank Roger Hooke, Stephen Warren and an anonymous reviewer for comments on an earlier version of this paper.



