

1 Introduction
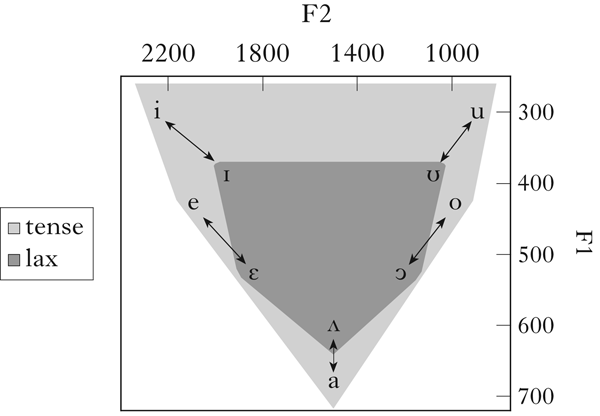
Cross-linguistically, vowel systems commonly distinguish between two sets of vowels: tense (e.g. [i e a o u]) and lax (e.g. [ɪ ε ʌ ɔ ʊ]). Lax vowels are more central than tense vowels in the acoustic space defined by the first and second vowel formants, as represented in Fig. 1. Tense and lax vowels may also differ along other dimensions: for instance, tense vowels are often longer (Stevens Reference Stevens1998: 294–299).
Tense–lax vowel alternations in the F1×F2 space.
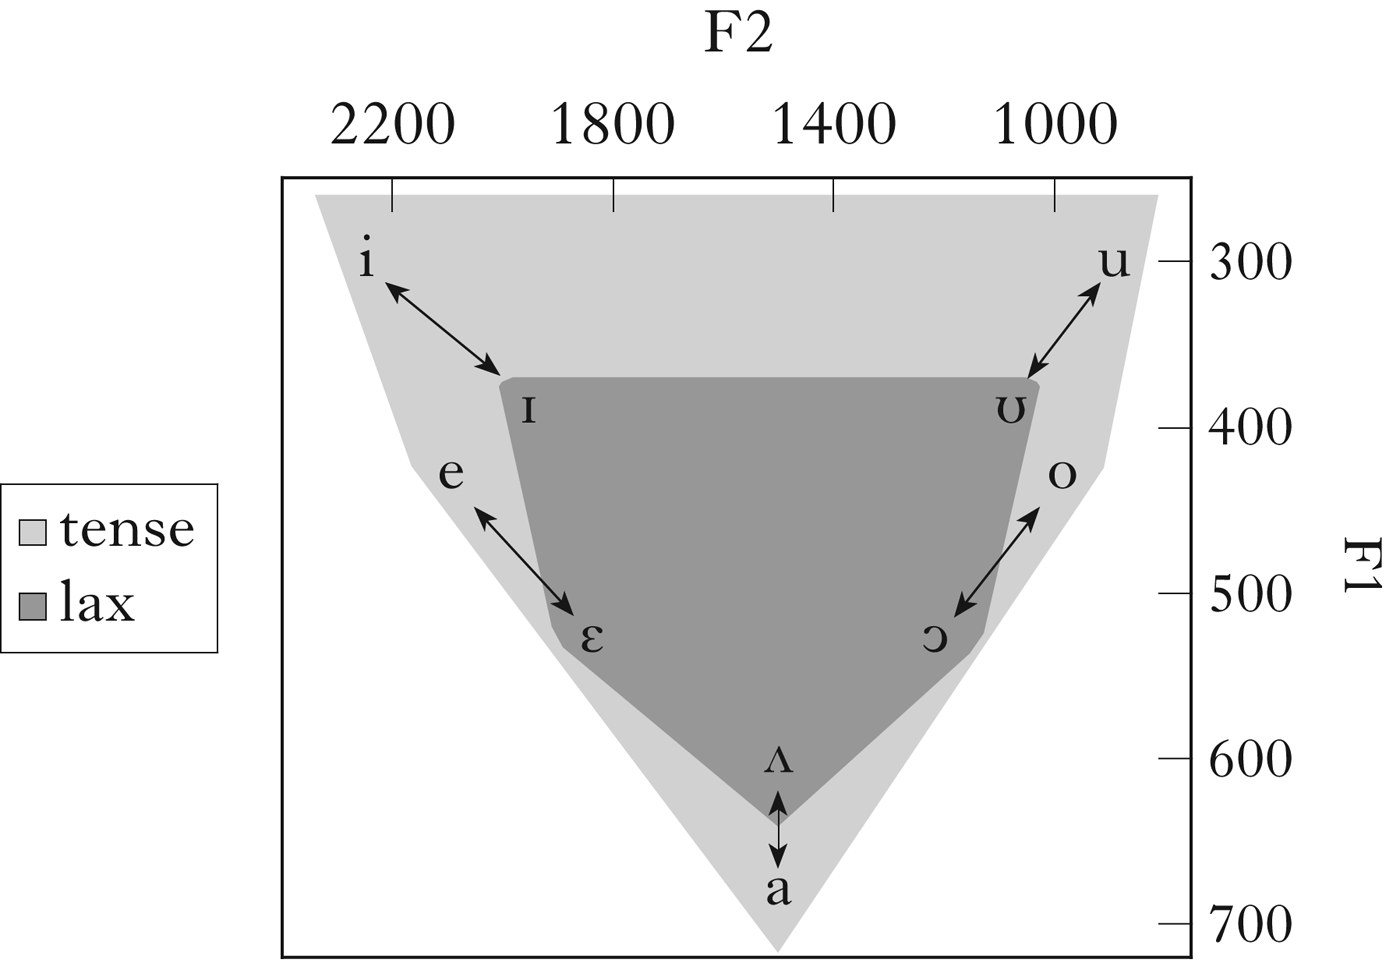
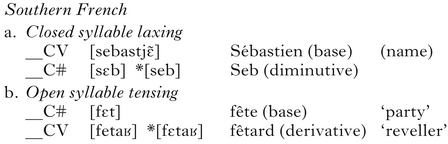
Although tense and lax vowels may be used contrastively, the contrast is often neutralised contextually, giving rise to tense–lax alternations, as represented by the arrows in Fig. 1. This paper focuses on two phonotactic restrictions which are found in postvocalic consonantal contexts: a restriction against tense vowels before word-final and/or pre-obstruent consonants (i.e. in closed syllables), and a restriction against lax vowels in word-final position and/or before prevocalic consonants (i.e. in open syllables). Common strategies to avoid these configurations are closed syllable laxing (CSL) and open syllable tensing (OST) respectively. Both processes apply in Southern French, as shown in (1a) and (1b) (Coquillon & Turcsan Reference Coquillon and Turcsan2012: 110–112).
(1)

What is the nature of the constraints that drive CSL and OST? Several authors (e.g. Botma & van Oostendorp Reference Botma, van Oostendorp, Botma and Noske2012) have suggested that these processes are driven by contextual vowel-duration adjustments: CSL is due to closed syllable shortening and OST to open syllable lengthening. The idea that the tense–lax distinction is derived from a more basic long–short distinction is also proposed by Lindau (Reference Lindau1978: 557). However, this proposal is problematic, because it is not compatible with acoustic theories of how changes in vowel duration affect vowel formants (e.g. Lindblom Reference Lindblom1963). First, there is no reason to expect lengthening to systematically result in more peripheral formant realisations for vowels (see §2.2). Second, there is no reason to expect shortening to systematically result in more central formant realisations (§2.3). In particular, the analysis of laxing as vowel reduction caused by closed syllable shortening does not work well for the case illustrated in (1a), and more generally for VC sequences including a non-low vowel (e.g. [i e o u]) followed by a non-uvular or non-glottal oral consonant (e.g. [p t k]). Indeed, increased coarticulation of non-low vowels with these consonants is characterised by a decrease in the F1 of vowels (see Lindblom Reference Lindblom1963). However, laxing of non-low vowels is characterised by an increase, not a decrease in F1 (see Fig. 1).
This paper proposes an alternative analysis, according to which CSL and OST are motivated by contrast enhancement (Stevens et al. Reference Stevens, Keyser, Kawasaki, Perkell and Klatt1986). For CSL, the enhancement analysis is proposed specifically for the cases that are most difficult to account for under the vowel-reduction analysis, namely VC sequences including a non-low vowel (e.g. [i e o u]) followed by an oral consonant belonging to one of the major places of articulation (e.g. [p t k]; see §2.3 for a discussion of how laxing in other VC sequences can be accounted for as vowel reduction).
This analysis relies on three main hypotheses, summarised in (2). First, non-low lax vowels are argued to allow for more distinct acoustic realisations of postvocalic consonants than their tense counterparts, and therefore to increase the perceptual distinctiveness of postvocalic consonant contrasts, in particular contrasts involving the major places of articulation (I refer to this as Hypothesis 1). Concretely, a sequence [εk] may be preferred to a sequence [ek] because [ε] provides better perceptual cues than [e] to [k]’s velar place of articulation. Second, I argue that vowel laxing typically applies before coda consonants as a way to compensate for the absence of good perceptual cues to consonant place in these contexts (Hypothesis 2). In general, consonant-place contrasts are signalled by two types of acoustic cues: internal cues, e.g. information contained in the burst for oral stops, and external cues provided by adjacent segments, in particular formant transitions into and from adjacent sonorous segments (e.g. vowels). But coda consonants systematically lack a release transition, a major acoustic cue to place provided by a following sonorous segment (e.g. Fujimura et al. Reference Fujimura, Macchi and Streeter1978, Wright Reference Wright, Hayes, Kirchner and Steriade2004). As a consequence, place contrasts are typically less distinct in codas than in onsets (Ohala Reference Ohala, Kingston and Beckman1990a, Reference Ohalab, Redford & Diehl Reference Redford and Diehl1999). Concretely, laxing may take place before word-final [k], giving [εk], but not before prevocalic [k], where we find [eka], because the velar place of articulation of [k] is in need of perceptual enhancement word-finally but not prevocalically. Third, vowel tensing is argued to correspond to a default preference for more distinct vowel contrasts. Tense vowels are more peripheral than lax vowels in the F1 × F2 space, and therefore should be more distinct (Hypothesis 3). Indeed, the first two vowel formants correspond to the main auditory dimensions for the perception of vowels (e.g. Shepard Reference Shepard, David and Denes1972: 78–82). Concretely, [eka] may be preferred to [εka] because tense [e] can be more readily distinguished from other vowels than lax [ε], due to its greater peripherality.
(2)
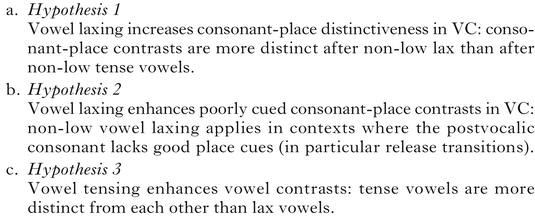
The two enhancement strategies conflict in determining vowel quality in VC sequences: the requirement to have distinct enough consonant contrasts favours laxing, whereas the requirement to have distinct enough vowel contrasts favours tensing. Language variation results from different ways of resolving this conflict.
The main goal of this paper is to motivate Hypothesis 1, the most innovative hypothesis of this account. Indeed, Hypotheses 2 and 3 have been proposed elsewhere. Hypothesis 2 plays a central role in typological accounts of contextual place neutralisation and assimilation: it explains why place contrasts are more likely to be neutralised or targeted by assimilation in codas than in onsets (Ohala Reference Ohala, Kingston and Beckman1990a, Jun Reference Jun, Hayes, Kirchner and Steriade2004, Reference Jun, van Oostendorp, Ewen, Hume and Rice2011). Hypothesis 3 was formulated by Jakobson et al. (Reference Jakobson, Gunnar, Fant and Halle1952: 36–39), and is supported by a range of studies showing that tense vowels are more peripheral than lax vowels (e.g. English: Stevens Reference Stevens1998: 296, Javanese: van Zanten Reference Zanten1989: 72; Québec French: Martin Reference Martin2002; Southern French: Storme Reference Storme2017b).
§2 presents a survey of languages with CSL and/or OST, and shows why these processes cannot generally be derived from contextual adjustments of vowel duration. §3 discusses earlier phonetic results on English and other languages which offer preliminary support for Hypothesis 1, and §4 provides further evidence from an acoustic and perceptual study of the effect of mid-vowel laxing in French. §5 discusses how Hypothesis 2 can account for the split between contexts favouring tensing vs. laxing in the languages surveyed in §2. §6 sketches an analysis of the typology of vowel tensing and laxing in the framework of Dispersion Theory (Liljencrants & Lindblom Reference Liljencrants and Lindblom1972, Flemming Reference Flemming2002), and §7 concludes, with a discussion of the role of duration in the tense–lax distinction.
The enhancement-based analysis represents a significant improvement on previous accounts, because it provides a well-motivated mechanism to relate the tense/lax quality of a vowel and its following context. If correct, this analysis provides further support for the role of perceptual contrast in driving phonotactic restrictions (Ohala Reference Ohala, Kingston and Beckman1990a, Steriade Reference Steriade1997, Flemming Reference Flemming2002, Jun Reference Jun, Hayes, Kirchner and Steriade2004, Stanton Reference Stanton2017), and more specifically, for the role of contrast enhancement in phonology (Stevens et al. Reference Stevens, Keyser, Kawasaki, Perkell and Klatt1986).
2 Language survey
CSL and OST are widespread phonological processes cross-linguistically. This section builds on a survey of 15 languages with CSL and/or OST, plus a few other languages without these patterns. §2.1 describes the basic patterns attested in the sample. §2.2 shows that OST cannot follow from open syllable lengthening but may follow from a default preference for better vowel dispersion (Hypothesis 3 in §1). §2.3 shows that coarticulatory analyses of CSL do not extend to non-low vowels before oral stops and fricatives corresponding to the major places of articulation.
2.1 Patterns
The 15 languages included in the survey are shown in Table I. The inventory represents the vowel phonemes of the language, rather than the surface vowels. For instance, in Southern French, the phonological inventory only includes one series of mid vowels, [e ø o], because surface tense and lax mid vowels never contrast in the language. The column with tense–lax pairs only reports pairs including vowels subject to OST or CSL in some context. For instance, Paluai [u]–[ʊ] is not listed in this column, because both vowels occur in V and VC contexts (Schokkin Reference Schokkin2014: 38).
Language sample, with vowel inventory, tense–lax pairs and sources.
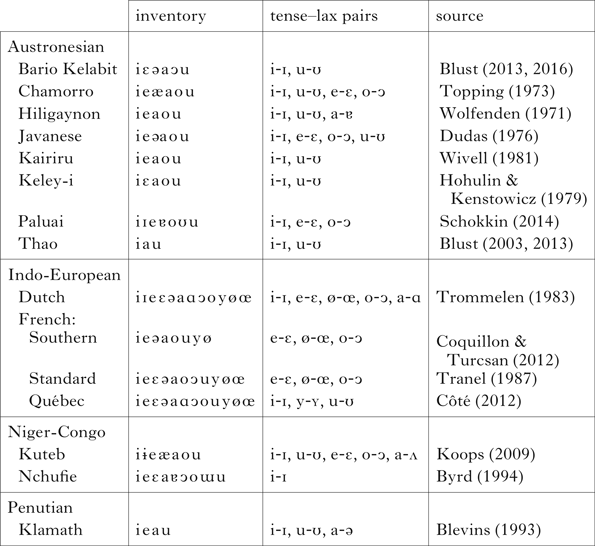
Table II represents the basic patterns found in the language sample. Many languages are reported to have both CSL and OST, with tense and lax vowels in complementary distribution. These languages are represented as pattern (a) in Table II. Pattern (a) is particularly well represented among Austronesian languages (Blust Reference Blust2013: 263–265): all Austronesian languages in the survey (except for Paluai) belong to this pattern. Kuteb, Nchufie, Klamath, Québec French and Southern French are also reported to belong to pattern (a).
The basic tense-lax patterns found in the language sample.
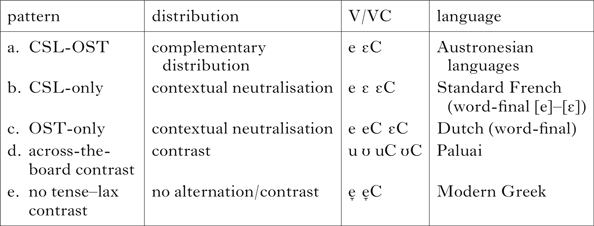
But CSL and OST are also attested as independent processes. Patterns with CSL only and OST only are represented as (b) and (c) respectively. Pattern (b) is attested in Standard French, where only CSL applies to front mid vowels in word-final syllables: [e] and [ε] contrast word-finally, but only [ε] occurs before word-final consonants (Tranel Reference Tranel1987: 51–53). Pattern (c) is attested in Dutch, where only OST applies in word-final syllables: tense and lax vowels contrast before word-final consonants, but only tense vowels occur word-finally (Kager Reference Kager1990). Two patterns involve neither CSL nor OST: (d) and (e). In pattern (d), tense–lax contrasts are allowed across open and closed syllables. For instance, in Paluai, high back vowels [u]–[ʊ] contrast in both contexts (Schokkin Reference Schokkin2014: 38). In pattern (e), a single vowel is available across the board (i.e. across open and closed syllables), as in Modern Greek, where there is no tense–lax contrast, and vowels ‘do not exhibit much variation in terms of quality’ (Arvaniti Reference Arvaniti1999: 169): in particular, they are not reported as having distinct allophones in open and closed syllables.
In languages following pattern (e) for which phonetic studies are available, vowels are reported to have an intermediary quality (represented here as [i̞ e̞ a̝ o̞ u̞]) between the corresponding tense and lax vowels in languages where they contrast. For instance, Becker-Kristal's typological study of vowel inventories shows that the average F1 targets for non-low vowels in five-vowel [i e a o u] inventories falls between the F1 targets of the corresponding tense and lax vowels in nine-vowel [i ɪ e ε a ɔ o ʊ u] inventories (Becker-Kristal Reference Becker-Kristal2010: 191, 195). See also Recasens & Espinosa (Reference Recasens and Espinosa2006) on Catalan dialects with and without tense–lax contrasts.
A single language may display several of the patterns in Table II, depending on the context. For instance, in Standard French, [e] and [ε] contrast in word-final open syllables, but not in non-final open syllables (Tranel Reference Tranel1987: 58–62), where the distribution of tense and lax mid vowels tends to conform to pattern (a) (Nguyen & Fagyal Reference Nguyen and Fagyal2008: 22–23). In Chamorro, high vowels follow pattern (a) in stressed syllables, but pattern (e) in unstressed syllables (Topping Reference Topping1973: 20). Although this paper will not attempt to provide a systematic explanation for these subtle contextual effects, and will instead mainly focus on the general, cross-linguistically robust asymmetry between word-final V# and VC#, the existence of contextual variability in the distribution of tense and lax vowels is not surprising. For instance, the fact that tense–lax contrasts are only allowed word-finally in Standard French can be understood as an effect of vowel reduction: there is less target undershoot in word-final syllables, due to the presence of stress (see Storme Reference Storme2017b and citations therein), and therefore more vowel contrasts can be accommodated in this position, in accordance with Flemming's (Reference Flemming2005) model of vowel reduction. Similarly, vowel undershoot in unstressed syllables in Chamorro might make the vowel space too compressed to maintain distinct allophones in this position.
2.2 Perceptual motivations for vowel tensing
Because vowels are often longer in open syllables than in closed syllables (Maddieson Reference Maddieson and Fromkin1985), and tense vowels are often longer than lax vowels (Lindau Reference Lindau1978), it is tempting to attribute OST and CSL to open syllable lengthening and closed syllable shortening respectively. However, this approach is problematic, because there is no reason to expect tensing and laxing to result mechanically from lengthening and shortening. This section focuses on OST.
Acoustic theory predicts that vowel lengthening should result in less coarticulation with adjacent consonants (e.g. Lindblom Reference Lindblom1963): as a vowel becomes longer, its formant realisations should become more faithful to its formant targets, but not necessarily more peripheral. For instance, when lengthened, an underlying /ε/ becomes lower and not higher (see Gendrot & Adda-Decker Reference Gendrot and Adda-Decker2005 for evidence from French and German). Therefore, lengthening cannot explain why /ε/ is realised as [e] in open syllables in languages with OST.
By contrast, if the location of acoustic targets for vowels is driven by a preference for more distinct contrasts (Hypothesis 3), vowels are expected to be peripheral in the acoustic space. In a simulation of vowel-inventory selection based on the principle of maximal perceptual contrast, Liljencrants & Lindblom (Reference Liljencrants and Lindblom1972) show that vowels indeed tend to occupy the periphery of the acoustic space.
The hypothesis that vowel tensing corresponds to a default preference for better vowel contrasts (rather than a preference specific to open syllables) accounts straightforwardly for the distribution of tensing in allophonic patterns (i.e. pattern (a) in Table II): tensing happens everywhere where CSL does not, i.e. in open syllables. However, the hypothesis seems problematic in the case of OST-only patterns (pattern (c)). Indeed, these patterns seem to point to a context-specific preference for tense vowels in open syllables, and are therefore potentially problematic for the view of tensing as default.
This section proposes that OST-only patterns do not actually reflect a direct preference for tensing in open syllables, but follow indirectly from a loss of duration contrasts in open syllables. In the two OST-only languages in the sample (Dutch and Standard French), the tense–lax contrasts neutralised by OST (all tense–lax contrasts in Dutch; only [o]–[ɔ] and [ø]–[œ] in Standard French) involve both quality and duration, with tense vowels being both longer and more peripheral than lax vowels (e.g. Trommelen Reference Trommelen1984 on Dutch, Gottfried & Beddor Reference Gottfried and Beddor1988 on French).Footnote 1 Also, the specific open syllable contexts targeted by OST in these languages (before a vowel in Dutch and word-finally in both languages; van der Hulst Reference Hulst, Bennis and Beukema1985, Tranel Reference Tranel1987, Kager Reference Kager1990) are typical contexts for the neutralisation of duration contrasts (see Myers & Hansen Reference Myers and Hansen2007 on final positions and Sihler Reference Sihler1995: 80 on neutralisation in hiatus, specifically in Latin).Footnote 2 Neutralisation of duration contrasts in open syllables ultimately results in neutralisation of quality distinctions and tensing, as follows. Once the long–short distinction has been neutralised, the relevant tense–lax pairs only differ in quality. Assuming this difference alone is not sufficient to support a vowel contrast, quality distinctions are also neutralised. The choice of a tense quality for the resulting neutralised vowel then corresponds to the same default preference for better vowel dispersion as is observed in allophonic patterns.
This duration-based analysis is corroborated by two facts from Dutch and Standard French. In Dutch, tensing does not target all open syllables: it is found in _# and _V, but not in _CV (e.g. [oto] auto ‘car’ vs. [ɔto] Otto (name); van der Hulst Reference Hulst, Bennis and Beukema1985, Kager Reference Kager1990). This asymmetry is compatible with the current proposal, because vowel-duration contrasts are typically neutralised in _# and _V, but not in _CV. In Standard French, OST targets [ø]–[œ] and [o]–[ɔ], but not [e]–[ε]. As [e]–[ε] happens to be the only tense–lax pair that does not involve a durational difference in the language (see §4), its distinctiveness should not be affected by the loss of duration contrasts word-finally, explaining why this contrast is not targeted by OST in this context.
2.3 Limits of coarticulatory analyses of CSL
Lindblom's (Reference Lindblom1963) theory of vowel reduction predicts that shorter vowels show greater coarticulation with adjacent consonants than longer vowels. Therefore, if CSL were a coarticulatory consequence of shortening, the resulting lax vowel quality could be explained as a compromise between the acoustic targets for the corresponding tense vowel and the consonantal context in which it occurs.
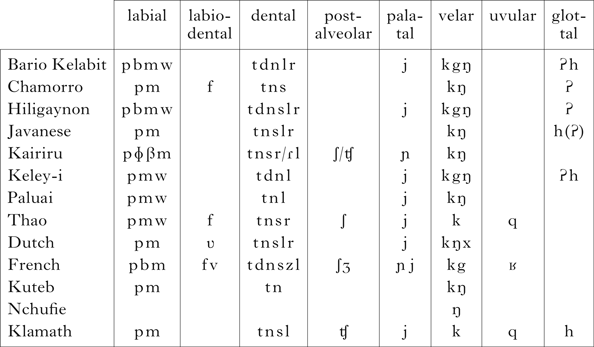
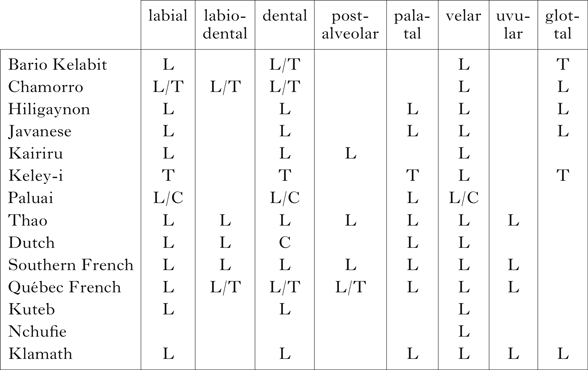
To get a better sense of the vowels and consonants involved in patterns of laxing in the language sample, the list of tense–lax pairs in Table I was supplemented with the information in Tables III and IV. Table III lists the consonants occurring in word-final positions for each language in the sample.Footnote 3 Word-final syllables were chosen to represent vowel-laxing contexts, because this is the most typically documented context for vowel laxing in the sample.Footnote 4 For each language and each place of articulation, Table IV shows whether tense and lax vowels contrast before the coda consonants in Table III or not (the presence of a contrast is signalled by C). If there is no contrast, the table indicates whether tense or lax vowels are preferred.Footnote 5
Consonants available in word-final position in the languages in the survey. (a) In Javanese, [k] and [ʔ] are in complementary distribution word-finally: [k] occurs after [ə] and [ʔ] after other vowels. According to Dudas (Reference Dudas1976), [ʔ] derives historically from [k]. (b) For Keley-i, Hohulin & Kenstowicz (Reference Hohulin and Kenstowicz1979) do not cite any word ending in [b] or [s], but these could be accidental gaps. (c) For Dutch, the table reports consonants available as C1 in C1C2 clusters. (d) For Klamath, only plain consonants are shown. There are also series of glottalised consonants, aspirated consonants and voiceless sonorants.
Distribution of tense and lax vowels before the consonants listed in Table III (L: lax vowels only; T: tense vowels only; C: tense–lax contrasts; empty cell: place of articulation missing in the language or unavailable in this position). (a) In Bario Kalabit, /i u/ lax to [ɪ ʊ] before all dentals except the rhotic [r]. (b) In Chamorro, /i u e/ lax to [ɪ ʊ ε] before three major places of articulation; /o/ laxes to [ɔ] only before velars. Laxing also occurs before prevocalic [ʔ]. (c) In Paluai, [i ɪ] contrast everywhere except before the word-final nasals [m n ŋ], where [ɪ] occurs. (d) In Québec French, high vowels are always lax except before the fricatives [v z Ʒ].
2.3.1 Non-low vowels
Plausible coarticulatory analyses of non-low vowel laxing in VC have been proposed for specific classes of consonants, and can account for some of the patterns in the language sample. In some languages, non-low vowel laxing is observed specifically before coda liquids (laterals or rhotics; Gick & Wilson Reference Gick, Wilson, Goldstein, Whalen and Best2006). For instance, in Utah English, non-low vowels have been reported to lax before coda [l] (see Di Paolo & Faber Reference Di Paolo and Faber1990 for references). These patterns have been analysed as coarticulatory, based on the observation that the relevant liquids involve a postvelar (i.e. uvular or pharyngeal) constriction and a retracted tongue root (Gick & Wilson Reference Gick, Wilson, Goldstein, Whalen and Best2006). Indeed, acoustic theory predicts that an increase in back constriction narrowing causes F1 to raise (Stevens Reference Stevens1998: 268), and that therefore greater coarticulation with posterior consonants could result in laxing. Brunner & Żygis (Reference Brunner, Żygis, Lee and Zee2011) also provide cross-linguistic evidence for non-low vowel laxing/lowering in the context of glottal consonants, and attribute this effect to tongue retraction.
Laxing of high vowels is also observed before coda nasals. In Paluai, tense and lax front high vowels [i] and [ɪ] generally contrast word-finally, except before nasals, where only [ɪ] is allowed (Schokkin Reference Schokkin2014: 36–37). These effects can also be analysed as coarticulatory, since nasalisation results in a higher F1 for non-low vowels (Beddor Reference Beddor, Huffman and Krakow1993: 180).
These analyses of non-low vowel laxing rely on specific articulatory properties of the relevant coda consonants, and therefore do not generalise to all coda stops and fricatives. In particular, they do not generalise to oral stops and fricatives that are neither uvular nor glottal. Yet many languages lax non-low vowels before these consonants (see Table IV). One case where the coarticulatory analysis might actually generalise is that of coda velars, if we assume a slightly more posterior articulation for velars in languages with CSL than for typical velars (Gick & Wilson Reference Gick, Wilson, Goldstein, Whalen and Best2006: n. 1). For instance, in Keley-i, high vowels lax only before coda velars; this could be explained as coarticulation if [k g ŋ] are phonetically postvelar (e.g. uvular). However, this approach cannot generalise to CSL languages where velars are clearly distinct from uvulars phonetically. For instance, French (where CSL is attested before velars) has both velar and uvular consonants. But velars and uvulars have opposite coarticulatory influences on adjacent vowels: vowels lower in the context of uvular [ʁ] (Delattre Reference Delattre1969), but raise in the context of velars [k g] (see §4). Laxing before coda velars can therefore not be attributed to increased coarticulation in French.
An alternative, non-coarticulatory analysis therefore seems to be required for laxing of non-low vowels before coda consonants like [p t k b d g s f z v]. This conclusion is strengthened by the observation that coarticulation with posterior consonants and laxing before oral stops and fricatives do not necessarily have the same phonetic effects and distribution when they are both attested in a language. In Thao, high vowels are reported to be subject to both coarticulation with the rhotic [ɾ] (an alveolar flap) and closed syllable laxing (Blust Reference Blust2013: 265). But the two processes are described as having different phonetic effects (lowering vs. laxing) and different distributions. The coarticulatory effect of the rhotic is both progressive and regressive, and not limited to coda contexts (e.g. [toɾo] turu ‘three’). However, the process of laxing before other consonants is limited to precoda contexts (e.g. [Ɂdoɾokɪk] duruk-ik ‘I stabbed it’).
2.3.2 Low vowels
A coarticulatory analysis is plausible only for low vowels. Indeed, shortening of low vowels is characterised by raising before the major places of articulation (see Lindblom Reference Lindblom1963), as is laxing. The conclusion that low vowel and non-low vowel laxing may be motivated by different mechanisms (despite being usually described as a single process) is not necessarily problematic. First, the two processes have different phonetic effects (decrease vs. increase of F1). Second, they do not always co-occur in languages. For instance, in many languages in the survey non-low vowels lax in closed syllables, but not low vowels (see Table I). The survey does not include any language which laxes only low vowels in closed syllables, but this could be because these languages are not described as laxing languages. For example, patterns where a low vowel raises to [ʌ] or [ə] in unstressed syllables are generally described as involving vowel reduction rather than vowel laxing.
3 The effect of vowel laxing on postvocalic place contrasts
This section proposes that non-low vowel laxing before the major places of articulation is motivated by contrast enhancement. §3.1–§3.3 focus on the acoustic and perceptual effects of laxing on place contrasts. §3.4 provides evidence for two phonological predictions following from the enhancement-based analysis.
3.1 Acoustics
In what follows, the formant value measured immediately before the consonant's closure or after release is referred to as the consonant's formant realisation. Consonants have different formant realisations depending on the vowel context: as a result of coarticulation, consonants’ formant realisations track the formant realisations of adjacent vowels (e.g. Delattre et al. Reference Delattre, Liberman and Cooper1955). Because tense and lax vowels differ in F1 and F2, the F1 and F2 realisations of a consonant in VC should differ according to whether V is tense or lax. This section explains how F1 and F2 realisations of the three major places of articulation (labial, coronal, velar) at closure vary after tense and lax vowels and how these variations are generally expected to correspond to greater acoustic distinctiveness of place contrasts after lax vowels than after tense vowels.
3.1.1 F1 realisations
Acoustic theory predicts that a consonant's F1 realisation should vary as a function of the speed of the articulator movement involved in producing that consonant: in CV, the F1 transition (which tracks the opening of the mouth) is faster if the articulator moves faster, and therefore F1 should be higher at formant onset (Stevens Reference Stevens1998: 335–338). Because the three major places of articulation are produced with different articulators (the lips for labials, the tip of the tongue for coronals, the body of the tongue for velars) and these articulators have different speeds, this predicts different F1 onset frequencies as a function of place. The movement is slowest for velars, and therefore F1 onset frequency of velars is lowest, everything else being equal. It is fastest for labials and therefore F1 onset frequency of labials should be the highest. These predictions were confirmed in a study on F1 realisations of prevocalic [b d g] in English, where F1([b]) > F1([d]) > F1([g]) (Stevens et al. Reference Stevens, Sharon, Matthies, Ohala, Hasegawa, Ohala, Granville and Bailey1999).
Although Stevens’ results are based on CV, they should extend to VC if F1 transition patterns are roughly symmetric in CV and VC: F1 is likely to be higher at the last measurable point before closure for F1 transitions with a higher rate of change. The expected difference in the F1 transitions going from [a] to the three major places of articulation in VC is schematised in Fig. 2a. This figure transposes Stevens’ simulation results for CV to VC. In all three cases, the movement starts from the same high F1 value (corresponding to the F1 realisation of [a] at vowel midpoint) and ends at the same low F1 value (corresponding to the consonant's closure). But the fastest movement is in the transition to [p] and the slowest in the transition to [k], [t] being in the middle.
Schematised F1 VC transitions into [p t k] after (a) low and (b) high vowels.
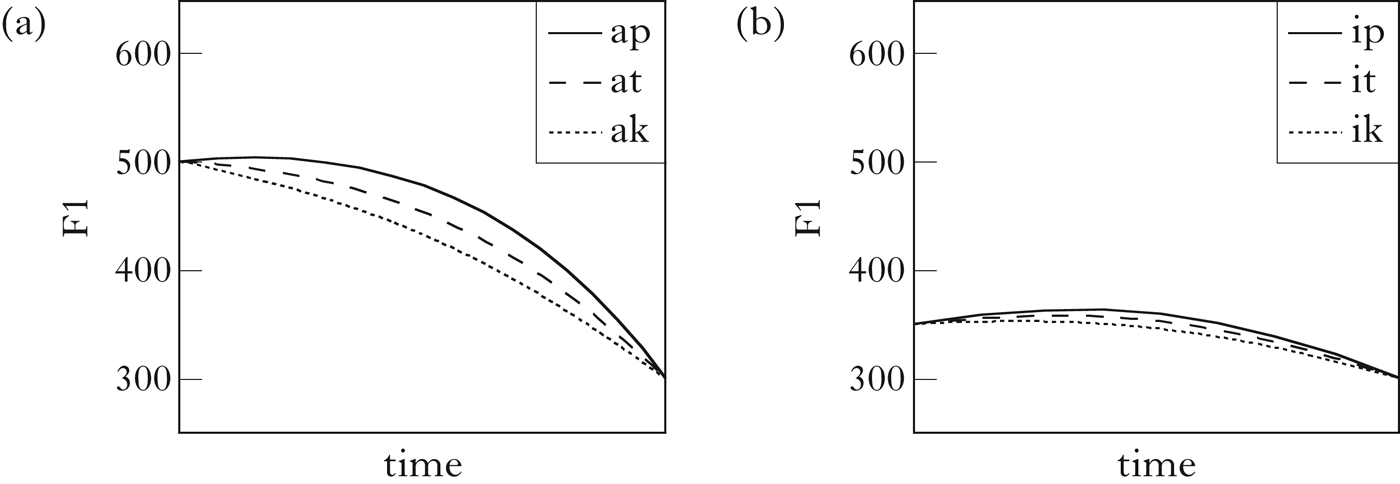
Figure 2b shows how F1 transitions should behave after high vowels. In this context, the target for the consonant closure in VC should be reached quickly by the three different articulators, because of the close articulation of [i]. F1 transitions should therefore be less distinct in this context than after low vowels (compare Figs 2a and 2b).
In accordance with this hypothesis, there is evidence that F1 realisations of labials and coronals are more distinct acoustically before low than before high vowels in English. Looking at the F1 realisations of [p t b d f s v z] at release before [a i u], Alwan et al. (2011: 201) found that labial stops and fricatives had significantly higher F1 onset frequencies than coronal stops and fricatives before [a], but not before [i] or [u]. They also found that the perceptual contrast between labials and coronals was overall more robust to noise before [a] than before [i] or [u].
Non-low lax vowels have higher F1 targets than the corresponding tense vowels. Therefore, according to the reasoning above, they should allow for more distinct F1 realisations of postvocalic consonants. However, because the distance between the F1 targets of tense and lax vowels (e.g. [e–ε]) is much smaller than that between high and low vowels (e.g. [i–a]), it is important to test whether the increase in distinctiveness is significant. This prediction will be tested in §4.
3.1.2 F2 realisations
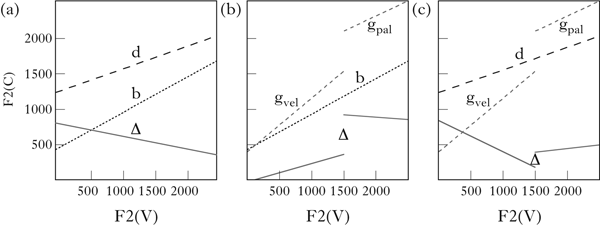
The F2 realisation of a consonant also varies as a function of the vowel context, and this variation can be characterised by locus equations (e.g. Sussman et al. Reference Sussman, Hoemeke and Ahmed1993). Although most studies have focused on CV, there is also evidence that locus equations can apply to VC sequences, although the fit is not as good as for CV (Sussman et al. Reference Sussman, Bessell, Dalston and Majors1997). The locus equations for English [b d g] in VC sequences (Sussman et al. Reference Sussman, Bessell, Dalston and Majors1997) can be used to infer the effect of the vowel's F2 on consonant-place distinctiveness.
For each pair among [b d g], Figs 3a–c plot the locus equations for the two members of the pair and the difference, Δ, between the two lines. This difference is a measure of the F2 distinctiveness of each contrast as a function of vowel F2. The velar is associated with two different locus equations after front and back vowels, each one corresponding to a different allophone (palatal or velar).
F2(C) as a function of F2(V) and the resulting acoustic F2 difference for [b], [d] and [g] in VC sequences: (a) [b]–[d]; (b) [b]–[g]; (c) [d]–[g]. Δ denotes the difference between the two lines. Data from Sussman et al. (1997).
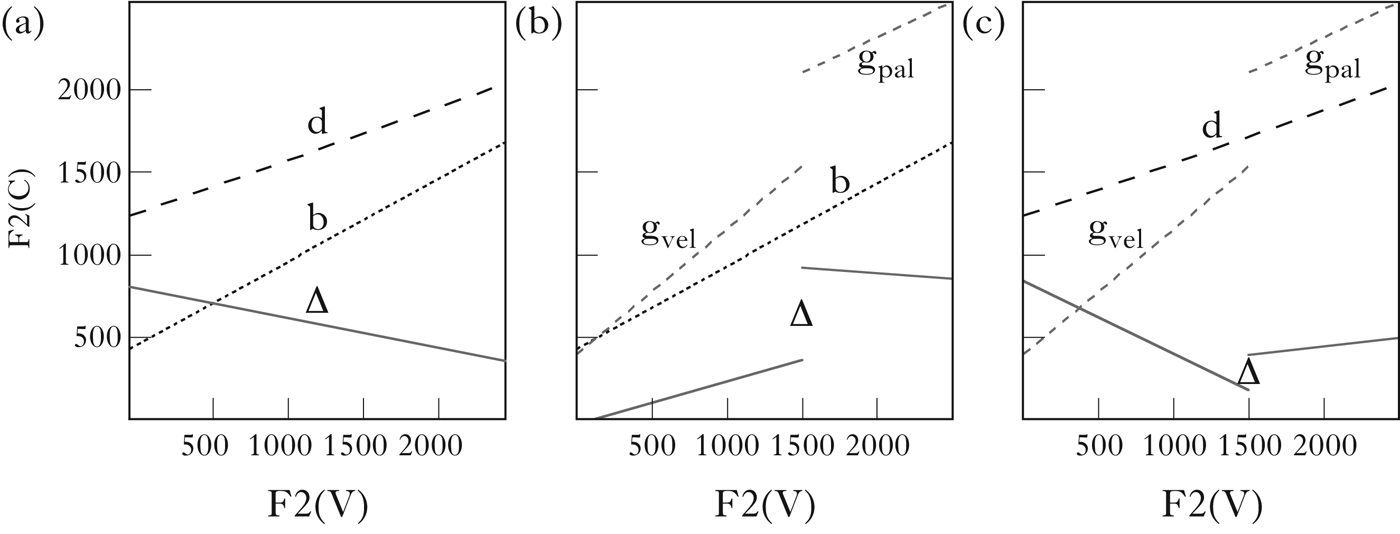
Based on these results, two contrasts should be clearly improved by centralising the preceding vowel: the labial–coronal contrast after front vowels (see Fig. 3a) and the labial–velar contrast after back vowels (Fig. 3b). These contrasts happen to be particularly confusable perceptually in these contexts (see e.g. Halle et al. Reference Halle, Hughes and Radley1957, Delattre Reference Delattre1958, Winitz et al. Reference Winitz, Scheib and Reeds1972, Ohala & Ohala Reference Ohala, Ohala, Grønnum and Rischel2001, Alwan et al. Reference Alwan, Jiang and Chen2011, Marty Reference Marty2012). For instance, Ohala & Ohala (Reference Ohala, Ohala, Grønnum and Rischel2001) found that, among the three contrasts involving [p t k] after [i a u] in Hindi, [p]–[t] after [i] and [p]–[k] after [u] were the most confusable.
However, in two cases, vowel centralisation should actually result in less distinct F2 offsets, namely the coronal–velar and coronal–labial contrasts after back vowels (see Figs 3c and a). However, centralising back vowels before coronals is unlikely to result in very bad coronal–velar and coronal–labial contrasts. For instance, Ohala & Ohala (Reference Ohala, Ohala, Grønnum and Rischel2001) found that these contrasts remained quite distinct perceptually even after [a], at any rate more than [p]–[t] after [i] and [p]–[k] after [u].
3.2 Perception
The clearest evidence for lax vowels providing better place cues to following consonants than tense vowels comes from Lisker's (Reference Lisker1999) study. Lisker reports data on the place identification in VC sequences in different vowel contexts in English. The results are reported in Table V.
Percentage of correct identification in English VC sequences with dereleased stops, i.e. stops whose release bursts have been edited out (Lisker 1999: 53). The results are similar for unreleased stops. The ‘average’ column reports the percentages across all three places. Values below 90% are given in bold.
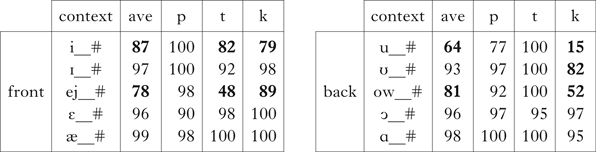
Overall, place identification is worse after tense vowels ([i ej u ow]) than after lax vowels ([ɪ ε ʊ ɔ]) and low vowels ([æ ɑ]). The average correct identification is never higher than 87% after tense vowels, and never lower than 93% after lax and low vowels. The contrast between [k] and [t] is particularly affected after tense front vowels. These results are slightly different from other studies, which found that the contrast between [p] and [t] was most affected in this context (e.g. Ohala & Ohala Reference Ohala, Ohala, Grønnum and Rischel2001). However, Winitz et al. (Reference Winitz, Scheib and Reeds1972) also report high [k]–[t] confusability in the context of [i] in English (specifically [ki]–[ti]). After tense back vowels, only [k] stimuli were identified correctly less than 80% of the time. Evidence from other studies (e.g. Ohala & Ohala Reference Ohala, Ohala, Grønnum and Rischel2001) suggests that this result is likely to be driven by [k]–[p] confusability.Footnote 6
3.3 Interim summary
Acoustic theory predicts that lowering should improve the F1 distinctiveness of major place contrasts in VC. Centralising should specifically improve the F2 distinctiveness of contrasts that are particularly confusable after peripheral vowels. As a combination of lowering and centralising, laxing should generally increase the distinctiveness of place contrasts in VC. In accordance with these acoustic results, Lisker's study suggests that the major place contrasts are generally less confusable after lax than after tense vowels in English.
However, Lisker's results on English do not necessarily generalise to languages where tense mid vowels lack offglides (i.e. all languages in the language sample except Dutch; Botma et al. Reference Botma, Sebregts and Smakman2012). Indeed, the presence of high offglides in English (e.g. [ej]) could explain some of the results. To avoid this confound, the phonetic study in §4 will focus on French, a language where mid vowels lack offglides.
§3.1 and §3.2 focused on the three major places of articulation. However, laxing might also increase the distinctiveness of other places of articulation, or even other consonantal features. For instance, laxing could also improve contrasts between laterals and glides (e.g. [l]–[j] and [ɫ]–[w]). Indeed, laterals and glides have distinct F1 targets (higher F1 targets for laterals than for glides; see Stevens Reference Stevens1998: 532). As a result, they are expected to have more distinct F1 realisations after lower than after higher vowels. However, a comprehensive exploration of the effect of laxing on postvocalic consonant contrasts is left for future research. The study in §4 will focus on the major places of articulation.
3.4 Further phonological predictions
Before moving on to the phonetic study in §4, I provide evidence in this section for two phonological predictions following from the hypothesis that the combination of lowering and centralisation enhances postvocalic place contrasts.
3.4.1 Height and ATR alternations
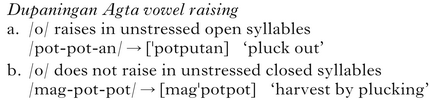
Lower vowels typically have higher F1 targets and more central F2 targets than the corresponding higher vowels (e.g. [e]–[i] and [o]–[u]). We therefore expect to find patterns of open syllable raising and closed syllable lowering parallel to OST and CSL. This prediction is borne out. In Dupaningan Agta (Austronesian), mid vowels /e/ and /o/ raise to [i] and [u] in unstressed open syllables, as in (3a), but raising is blocked in unstressed closed syllables, as in (3b), resulting in high–mid alternations (Robinson Reference Robinson2008: 68–70). The blocking of vowel reduction cannot be attributed to stress: the vowels in both (a) and (b) are unstressed, and Robinson (Reference Robinson2008) does not report secondary stress on closed syllables. Similar patterns of high–mid or high–low alternations that cannot be attributed to stress are documented in Latin (Niedermann Reference Niedermann1985: 18–31) and Bedouin Hijazi Arabic (Al Mozainy Reference Al Mozainy1981: 194–195).
(3)
[―ATR] vowels are generally characterised by higher F1 targets than corresponding [+ATR] vowels (Lindau Reference Lindau1978), and are therefore expected to provide more distinct F1 transitions in VC sequences. As a consequence, one should observe syllable-based [+ATR]–[―ATR] alternations. This prediction is also borne out. Paulian (Reference Paulian1986) documents a pattern of alternation involving ATR in Kàlɔ̀ŋ (Bantu), where some lexemes have the [+ATR] vowels [i u] in open syllables (e.g. [ku-lìmb-à] ‘bewitch’) but the [―ATR] vowels [ε ɔ] in closed syllables (e.g. [à-l ὲmb] ‘witchcraft’). This pattern was analysed as CSL by Hyman (Reference Hyman, Sauzet and Zribi-Hertz2003).
3.4.2 Neutralisation of place contrasts conditioned on vowel quality
Poor distinctiveness of contrast is known to correlate cross-linguistically with phonological neutralisation (Steriade Reference Steriade1997, Jun Reference Jun, Hayes, Kirchner and Steriade2004). The hypothesis that place contrasts are less distinct after tense/high vowels than after lax/low vowels predicts that we should find languages where place contrasts are neutralised after tense/high vowels but not after lax/low vowels. A preliminary investigation of languages with vowel-specific patterns of consonant-place neutralisation suggests that this prediction is borne out. For instance, in Cantonese, all three places of articulation (labial [p m], coronal [t n], velar [k ŋ]) are available in VC after low vowels [a] and [ɐ], but only subsets of those are available after higher vowels (Hashimoto Reference Hashimoto1972). In a corpus of about 250 verbs in Munken (Niger-Congo), Lovegren (Reference Lovegren2013: 95) found evidence for place contrasts word-finally after non-high vowels [ε o ɔ ə a] ([m n ŋ] are all attested after [ε ə a], and [m ŋ] after [o ɔ]), but only a single consonant is available after [i u e] ([n] after [i e]; [ŋ] after [u]).
4 Acoustic and perceptual studies
§3 motivated the central hypothesis underlying the analysis of CSL as a strategy of contrast enhancement. This section provides a further test of this hypothesis by focusing on Standard French, a language with the three tense–lax pairs [e–ε ø–œ o–ɔ], where the tense vowels lack offglides. §4.1–§4.3 describe an acoustic study comparing the formant realisations of [p t k] after the ten French oral vowels. §4.4–§4.5 describe a perceptual study using a subset of the stimuli collected in the acoustic study, and §4.6 summarises and discusses the results.
4.1 Acoustic study: methods
Two native speakers of Standard French (one female and one male) were recorded uttering C1VC2 syllables, with [i y u e ø o ε œ ɔ a] in V and [p t k] in C1 and C2. Stimuli were presented orthographically to the two speakers. The vowels were represented as <i u ou é eû au è eu o a>, following standard French orthography, and the consonants as <p t k>. French words were provided to illustrate how graphemes should be pronounced (e.g. eû–eu: jeûne ‘fast’ [ʒøn] – jeune ‘young’ [ʒœn], au–o: glauque ‘gloomy’ [glok] – cloque ‘blister’ [klɔk], etc.).
All syllables were phonotactically licit syllables for the speakers, except for C1eC2 syllables. In Standard French, tense rounded mid vowels [ø] and [o] are licit in word-final closed syllables (e.g. [kot] côte ‘coast’ and [møt] meute ‘pack’), but the tense unrounded mid vowel [e] is not (Tranel Reference Tranel1987). The speakers were explicitly told to pronounce the <é> in <CéC> syllables as [e]. The Belgian pronunciation of the municipality of Molenbeek [molœnbek] was used to illustrate the [e] pronunciation in a closed syllable. Acoustic measurements were made to verify that the realisation of [e] was consistent with typical realisations of [e] in French in this context (see §4.2).
Each of the 90 syllables was repeated three times by each speaker, yielding a total of 540 syllables. Recordings were made in a sound-attenuated booth, using a head-mounted Shure SM35-XLR microphone connected to a computer. The recordings were made using Audacity software, with 44 kHz/16 bit sampling. Vowels were manually segmented, and measures of vowel duration included only the vocalic segment, not the initial burst associated with consonant release. The end of the vowel was identified by the last periodic oscillation.
In order to test the hypothesis on the effect of the vowel context on place distinctiveness, measurements of F1 and F2 were taken at the vowel offset, defined as the point located 5 ms before the end of the vowel. All acoustic analyses were performed using Praat (Boersma & Weenink Reference Boersma and Weenink2017).
The formant frequencies were Bark-transformed and normalised by speaker (using the R function scale). R (R Core Team 2018) and lme4 (Bates et al. Reference Bates, Maechler and Bolker2014) were used to perform linear mixed-effects analyses of the relationship between the response variables (F1, F2) and the categorical predictors (Height, Backness, C2) and their interactions. The details of the models will be provided in the next section, with the results.
4.2 Acoustic study: results
4.2.1 Acoustic realisation of vowels
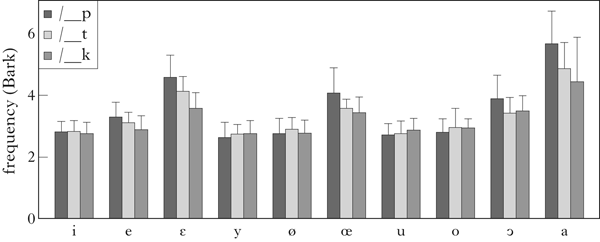
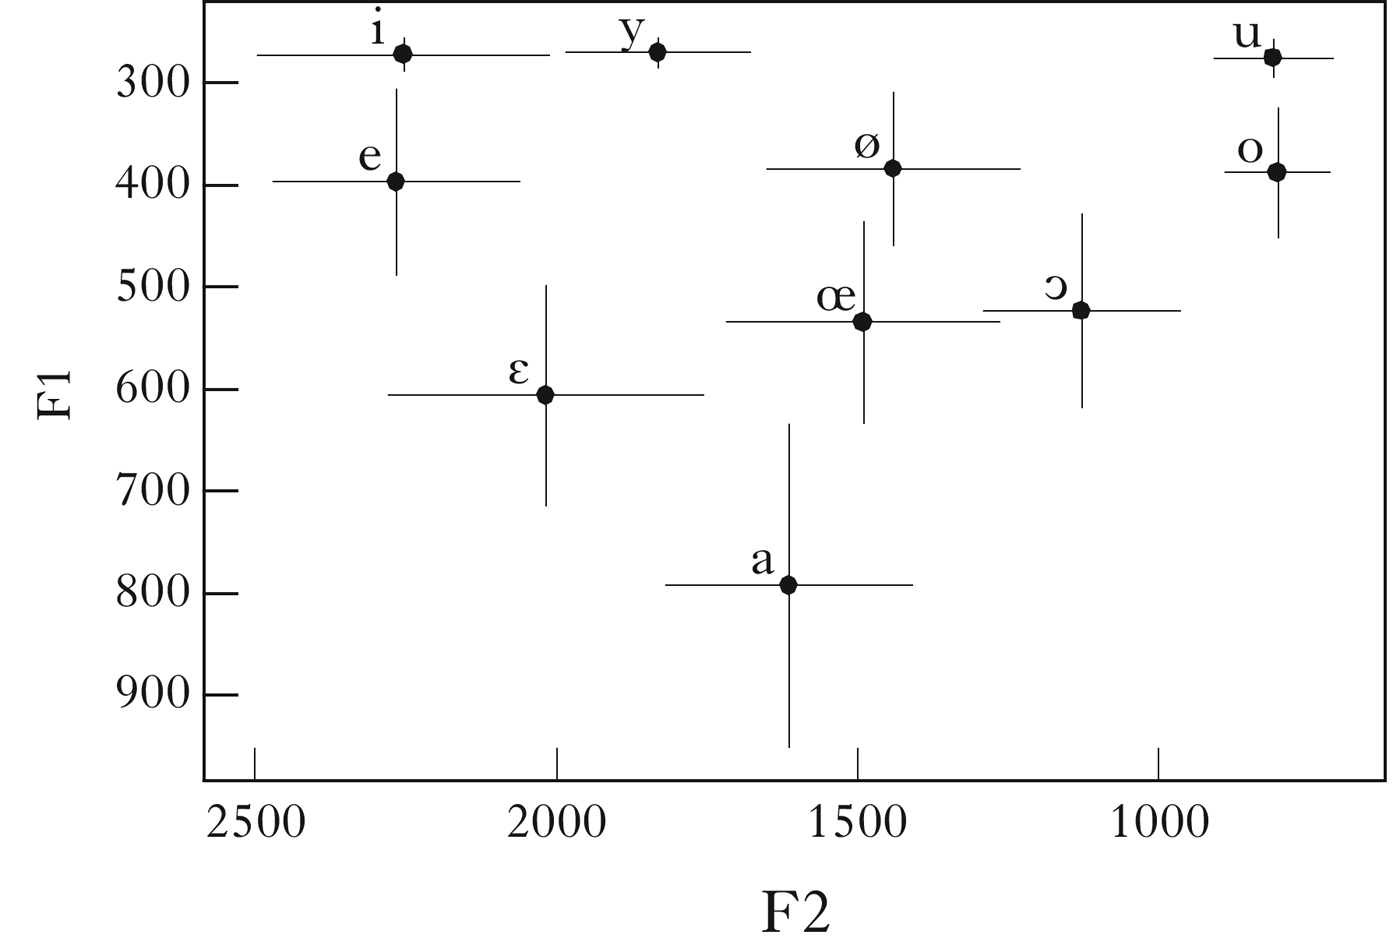
Figure 4 summarises the distribution of the ten oral vowels over the F1 × F2 space across speakers and consonantal contexts. The results are generally compatible with previous studies on the realisation of oral vowels in final syllables. One difference is that [ε] appears to have a slightly higher F1 value than [œ] and [ɔ], although these vowels have been found to have roughly the same F1 values in other studies (Ménard et al. Reference Ménard, Schwartz and Aubin2008). The average vowel durations are reported in Table VI (with standard deviations). [o ø] are longer than their lax counterparts [ɔ œ], as has been found in other studies (e.g. Gottfried & Beddor Reference Gottfried and Beddor1988). With the exception of [o ø], lower vowels are generally longer than higher vowels, in accordance with Lehiste's (Reference Lehiste1970) cross-linguistic findings.
Mean F1 and F2 (Hz) of the Standard French vowels, with standard deviations (measured at the midpoint of the vowel).
Average vowel duration (ms), with standard deviations.
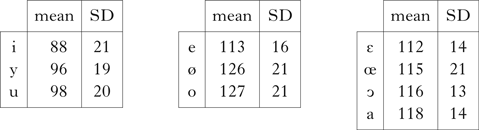
As noted in §4.1, [e] is the only French oral vowel that is phonotactically illicit in the context elicited in this study. The formant and duration data reported in Fig. 4 and Table VI suggest that the realisation of [e] in this context is consistent with typical realisations in contexts where [e] is available in French. As found in other studies (e.g. Ménard et al. Reference Ménard, Schwartz and Aubin2008), the F1 realisation of [e] is similar to the F1 realisations of the other tense mid vowels [ø o]. The F2 realisation of [e] in the present study is also consistent with the results in Ménard et al. (Reference Ménard, Schwartz and Aubin2008). The fact that [e] was not found to be longer than its lax counterpart [ε] is also in accordance with descriptions of Standard French, which report tense–lax durational differences only for rounded mid vowels (e.g. Tranel Reference Tranel1987: 51–58).
4.2.2 F1 realisations of consonants
Figure 5 shows how F1 measured at the vowel offset varies as a function of the vowel and the following consonant. To test the effect of vowel height on the acoustic distinctiveness of F1 realisations of postvocalic consonants, a linear mixed-effects model was fitted to the F1 data. The fixed effects included Height (a variable with three levels: high, tense mid, lax mid), Backness (front unrounded, front rounded, back rounded) and C2 ([p t k]), and all their interactions. The variables Height and Backness define the nine vowels [i y u e ø o ε œ ɔ]. Because there is only a single low vowel in French, it is not possible to define a full model including this vowel and the interaction of Height and Backness. For this reason, [a] was excluded from the statistical analysis. The random effect structure included a by-speaker/by-repetition random intercept and a by-speaker/by-repetition random slope for C2. This model was compared to more complex models that were able to converge, using likelihood-ratio tests. But the increase in model complexity was not justified by an improvement in fit. In particular, including C1 in the model (along with interactions involving C1 and all other variables) was not found to significantly improve model fit (χ 2(54) = 42.571, p = 0.869). The p-values reported below were obtained using the lmerTest package (Kuznetsova et al. Reference Kuznetsova, Brockhoff and Bojesen Christensen2015).
F1 of vowel before [p t k] in C2 position, measured 5 ms before the end of the vowel (mean and standard deviation).
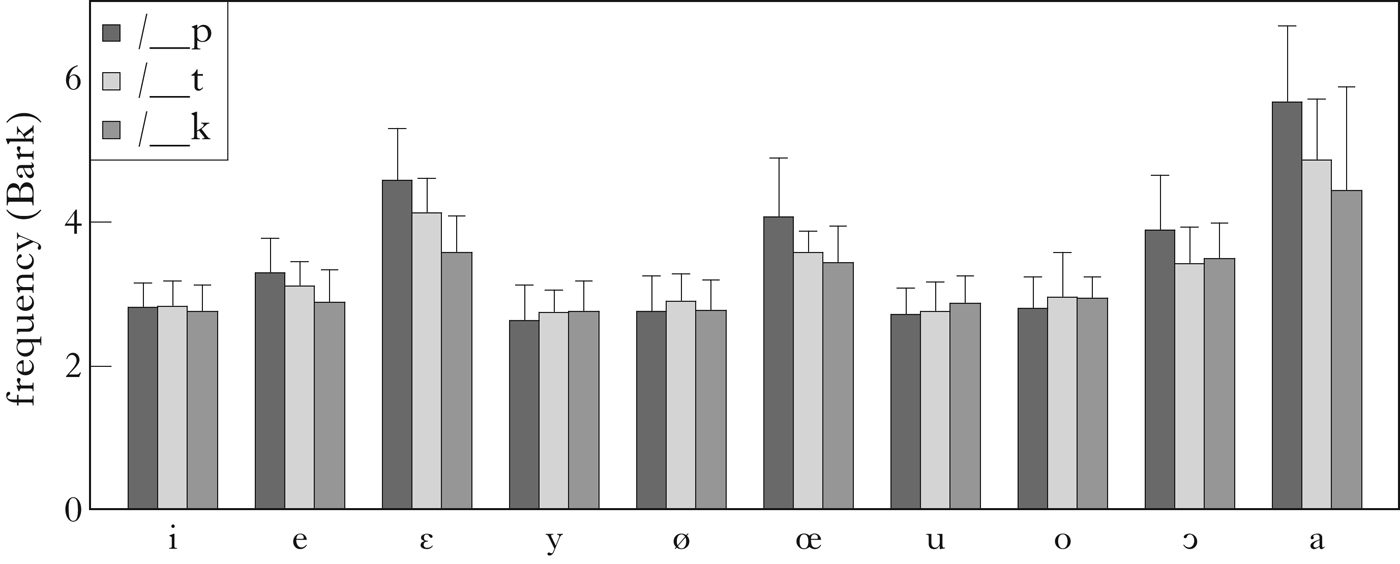
After high vowels, the F1 realisations of [p t k] were not found to be significantly different. After tense mid vowels, the F1 realisation of [k] was found to be slightly lower than that of [t] but this effect did not reach significance (β = ―0.11, SE = 0.07, p = 0.1). After lax mid vowels, the F1 realisation of [k] was found to be lower than that of [t] (β = ―0.20, SE = 0.07, p < 0.005) and the F1 realisation of [p] was found to be higher than that of [t] (β = 0.41, SE = 0.07, p = 2.91e-09), i.e. F1([k]) < F1([t]) < F1([p]); see Stevens et al. Reference Stevens, Sharon, Matthies, Ohala, Hasegawa, Ohala, Granville and Bailey1999 for similar results for English). However, the effect of laxing on the [k]–[t] F1 distance is probably entirely driven by [ε], as indicated by the significant three-way interaction of Height, Backness and Consonant (β = ―0.21, SE = 0.09, p < 0.05). These findings are summarised in Table VII in §4.3.
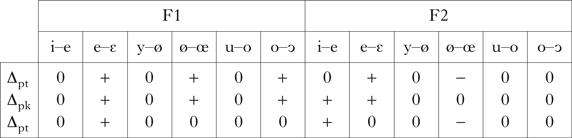
Summary of the results of the acoustic study. Cases in which the F1 or F2 acoustic distance (Δ) between the two consonants in the corresponding row is larger after the lower vowel than after the higher one are indicated by ‘+’, those in which the distance is larger after the higher vowel than after the lower one by ‘–’ and those in which there is no significant difference by ‘0’.
4.2.3 F2 realisations of consonants
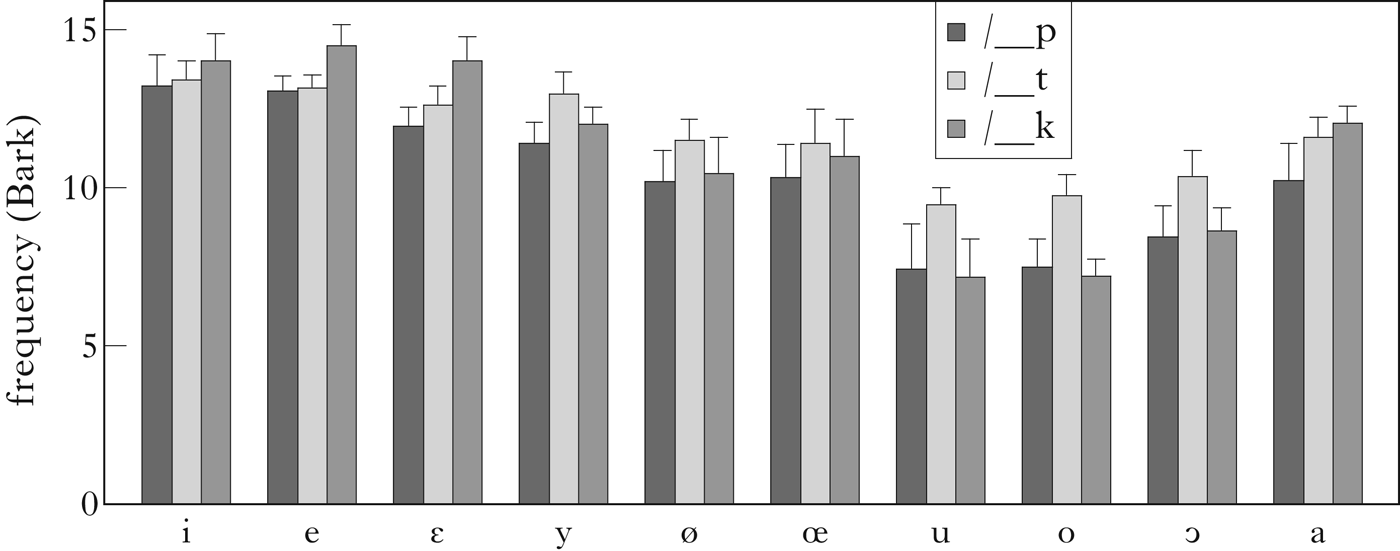
Figure 6 shows how F2 measured at the vowel offset varies as a function of the vowel and the following consonant. To test the effect of vowel height on the acoustic distinctiveness of the F2 realisations of postvocalic consonants, linear mixed-effects models were fitted to the F2 data. Different models were fitted for each level of the Backness variable (front unrounded, front rounded and back rounded). The low vowel was excluded from the analyses, as for F1. The three models differed in how Backness and C2 were coded: in the first model the baseline for comparison was front unrounded vowels before [t], in the second model it was back rounded vowels before [p] and in the third model front rounded vowels before [k]. Analysing the effect of Height on consonantal F2 realisations within a single level of Backness was easier, because Backness had a large effect on the realisations (as expected), and three-way interactions of Height, Backness and C2 were difficult to interpret in a single model.
F2 of vowel before [p t k] in C2 position, measured 5 ms before the end of the vowel (mean and standard deviation).
The fixed effects in the three models were Height, Backness, C1 and C2, all two-way and three-way interactions involving Height, Backness and C2, and all two-way and three-way interactions involving Backness, C1 and C2. The random effect structure included a by-speaker random intercept, a by-speaker random slope for Height and a by-speaker random slope for C2.
These models were compared to more complex models that were able to converge, using likelihood-ratio tests. The increase in model complexity was not justified by an increase in model fit. In particular, the model including all interactions of the four variables Height, Backness, C1 and C2 as fixed effects did not provide a significantly better fit to the data (χ 2(36) = 33.437, p = 0.591). Concretely, this means that the effect of Height on the F2 realisation of C2 can be analysed independently from C1 in this dataset. Indeed, the final model does not include any interactions involving both C1 and Height, yet does not provide a worse fit than the full model including these interactions. The effect of Height on the F2 realisation of C2 reported below is averaged across the three different values for C1.
The results are summarised in Table VII in §4.3, and described in more details in the following paragraphs.
Front unrounded vowels. [t] and [k] have significantly different F2 realisations after [e], (β = 0.59, SE = 0.11, p < 0.05), but not [t] and [p] (β = ―0.05, SE = 0.15, p = 0.772). After [i], the [t]–[k] distance is significantly decreased compared to after [e] (β = ―0.32, SE = 0.11, p < 0.005), but the [t]–[p] distance is not (β = ―0.04, SE = 0.11, p = 0.732). Concretely, this means that the F2 of [p t k] is generally more similar after [i] than after [e]. After [ε], the distance between the F2 realisations of [t] and [p] (and as a consequence those of [p] and [k]) is significantly increased compared to after [e] (β = ―0.24, SE = 0.11, p < 0.05), but the [t]–[k] distance is not (β = ―0.03, SE = 0.11, p = 0.762). Concretely, this means that [p t k] are generally more distinct along F2 after [ε] than after [i] and [e].
Back vowels. After [o], [p] and [t] have significantly different F2 realisations (β = 0.99, SE = 0.15, p < 0.05), but [p] and [k] do not (β = ―0.13, SE = 0.09, p = 0.190). There is no significant effect of Height on the F2 distances between [p t k] after back vowels. This means that raising F2 (i.e. centralising) from [o] to [ɔ] does not affect the F2 distinctiveness of [p t k].
Front rounded vowels. After [ø], the F2 realisation of [k] is significantly different from both [p] (β = ―0.27, SE = 0.11, p < 0.05) and [t] (β = 0.33, SE = 0.13, p < 0.05). The distances between [p t k]’s F2 realisations are not significantly different after [ø] and after [y]. However, the F2 distance between [k] and [t] (and therefore between [t] and [p]) decreases significantly after [œ] as compared to after [ø] (β = ―0.28, SE = 0.11, p < 0.05). The distance between [k] and [p] does not vary significantly after [ø] and after [œ]. Concretely, this means that [p t k] are generally more distinct with respect to F2 after [y] and [ø] than after [œ].
4.3 Acoustic study: summary
For each pair of vowels differing in Height, Table VII summarises whether the F1 or F2 acoustic distance between the two consonants in the corresponding row is (i) larger after the lower vowel than after the higher one, (ii) larger after the higher one than after the lower one or (iii) not significantly different after the two vowels.
The distances between the formant realisations of [p t k] generally do not differ after high and tense mid vowels. One exception concerns [i] and [e]: the F2 distance between [k] and the other two consonants was found to be larger after [e] than after [i].
Mid-vowel laxing was found to generally increase the distance between the F1 realisations of [p t k], in accordance with the predictions of acoustic theory laid out in §3.1. The increase was observed for all pairs after [ε], but only for the pairs involving [p] after the rounded vowels [ɔ œ]. This difference could be due to the fact that [ε] had a higher F1 value than [ɔ œ] in this study (see Fig. 4).
The results for F2 do not straightforwardly support the predictions laid out in §3.1. For the front unrounded vowels [e]–[ε], mid-vowel laxing was found to increase the distance between the F2 realisations of [p t], as expected. But it was also found to increase the F2 distinctiveness of [p k], a result that was not particularly expected (the F2 distance between [p] and [k] appeared roughly constant across front vowels in Fig. 3b). For the back rounded vowels [o]–[ɔ], mid-vowel laxing (i.e. centralising) was not found to have any effect on F2 distinctiveness, contrary to what was predicted in §3.1. For the front rounded mid vowels [ø]–[œ], vowel laxing was actually found to decrease the F2 distance between consonant pairs involving [t]. This is a little surprising, since the two vowels do not have very different F2 targets. However, the English stimuli used to establish the locus equations that served as a basis for the predictions in §3.1 did not include central vowels like [ø] and [œ] (see Sussman et al. Reference Sussman, Bessell, Dalston and Majors1997: 2828). Therefore, these locus equations are probably not fully appropriate for estimating how small variations in the centre of the F2 range for vowels could affect place distinctiveness.
4.4 Perceptual study: methods
A third of the stimuli recorded in the acoustic study (the first recording of each syllable) were used in a perceptual study evaluating the effect of vowel quality on place distinctiveness. The final burst was edited out, in order to directly test the effect of vowel transitions on place discriminability. In order to control for the effect of stimulus intensity on the task, the amplitude of the sound files was equalised, and scaled to a maximum peak value equal to one.
Both English and French speakers were recruited to participate in the study. There were two reasons for this choice. First, perception is known to be language-dependent (e.g. Iverson et al. Reference Iverson, Kuhl, Akahane-Yamada, Diesch, Tohkura, Kettermann and Siebert2003), and therefore it is important to test whether the effects hypothesised here are robust across different languages. Second, as previewed in §4.1, the tense front mid vowel [e] is phonotactically illicit before word-final consonants in French and, because phonotactics may influence perception (e.g. Dupoux et al. Reference Dupoux, Kakehi, Hirose, Pallier and Mehler1999), this could affect French listeners’ performance on place discrimination after this vowel. By contrast, English phonotactics are not expected to confound the results in the same way, because the tense front vowel is available before word-final consonants in English.
85 participants took part in an online experiment. 43 English speakers were recruited through Mechanical Turk, and 42 French speakers through the CNRS RISC mailing list. They were paid for their participation. All participants gave their informed consent. The 180 CVC syllables with the final burst edited out were presented in randomised order. Participants were instructed to identify the final consonant among [p t k]. They all indicated that they wore headphones while taking the test.
Confusion matrices were built for the two groups of listeners (French listeners vs. English listeners), collapsing across speakers, listeners and C1 within each group. These confusion matrices indicate how many times each of the three stimuli ([p t k]) was identified as each of the three possible responses ([p t k]) in the ten vowel contexts. The confusion matrices were analysed using Luce's (Reference Luce, Duncan Luce, Bush and Galanter1963) Biased Choice Model, which infers measures of stimulus similarity and response bias from a confusion matrix, and can be used as a model of identification tasks (see Luce Reference Luce, Duncan Luce, Bush and Galanter1963 for details). The model was implemented as a log-linear model in R, and fitted to the confusion matrices. Two contextual parameters (vowel and listeners’ native language) were added in order to obtain estimates of consonant similarity after different vowels for each of the two groups of listeners. Only the estimates of the perceptual distances between the stimuli are reported.Footnote 7
4.5 Perceptual study: results
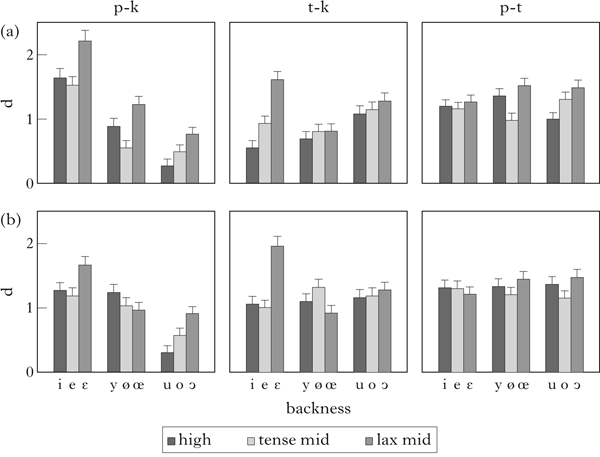
Figure 7 shows, for each pair of consonants and each vowel, the estimated perceptual distance between the two consonants after this vowel. Overall, the distance between [k] and [p] varies substantially as a function of the identity of the preceding vowel, whereas the distance between [p] and [t] is much less dependent on the vowel context. This is consistent with the finding that the identification of [k] is the most dependent on vowel transitions, and the identification of [t] the least (Cooper et al. Reference Cooper, Delattre, Liberman, Borst and Gerstman1952, Winitz et al. Reference Winitz, Scheib and Reeds1972).
Perceptual distances between [p], [t] and [k] after French high, tense mid and lax mid vowels: (a) English listeners; (b) French listeners. Error bars represent standard errors.
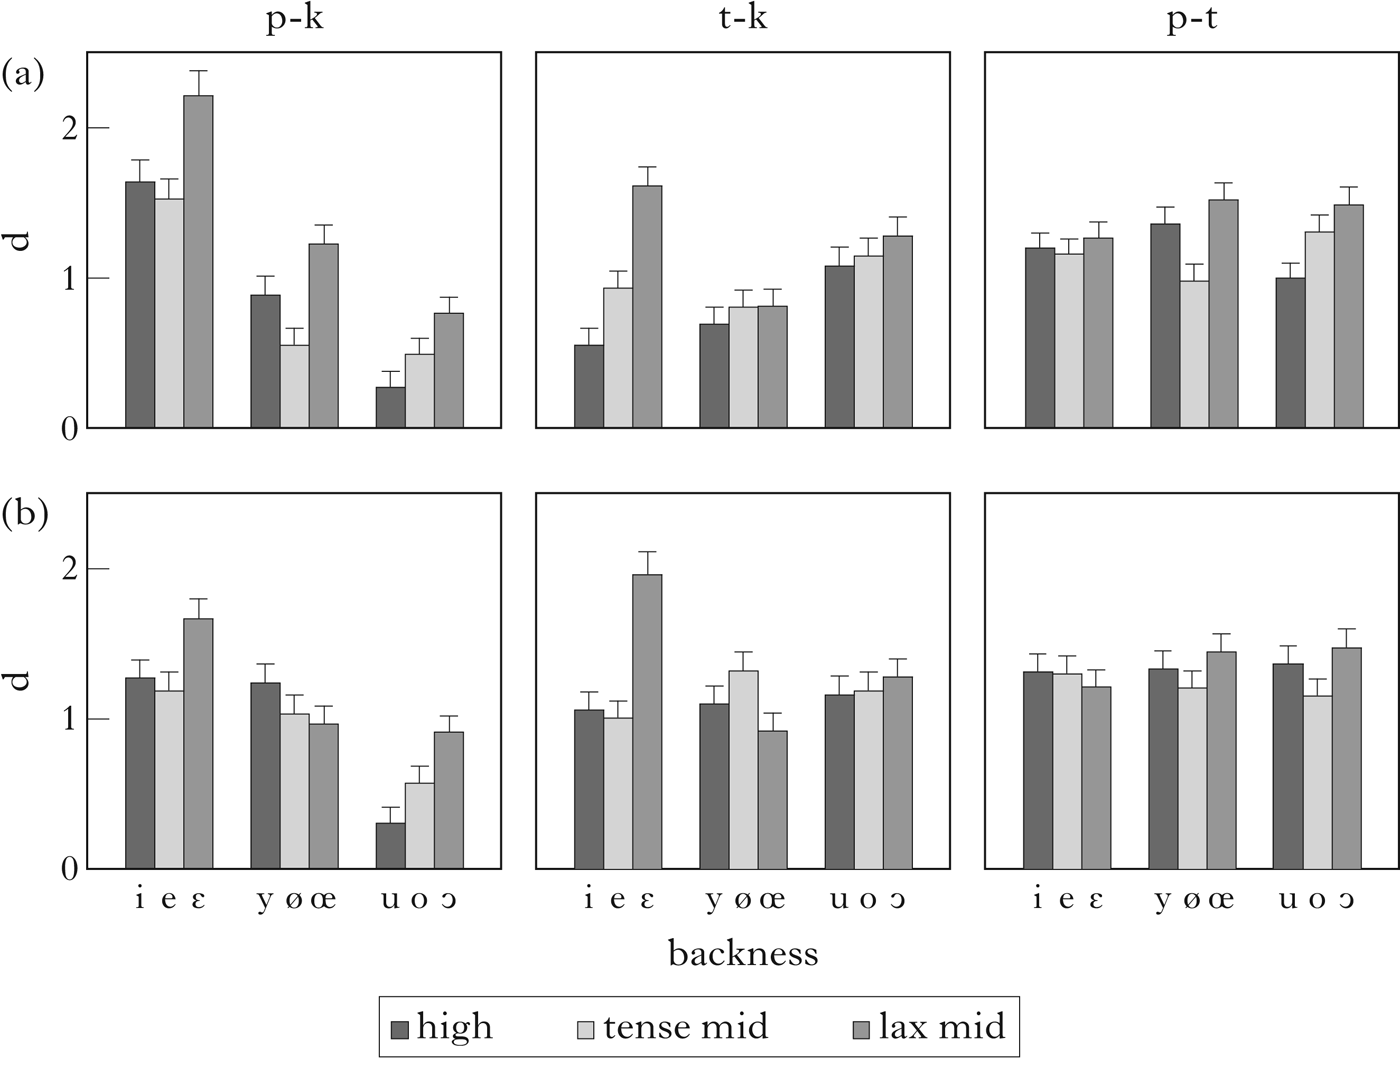
Front unrounded vowels [i e ε]. [p]–[k] and [t]–[k] are significantly more distinct after [ε] than after [e] (β = ―0.59, SE = 0.14, p = 3.39e-05; β = ―0.82, SE = 0.13, p = 1.54e-10). The perceptual improvement due to laxing before [p] and [k] was found to be slightly smaller for the French listeners, but this effect did not reach significance (β = 0.17, SE = 0.09, p = 0.066). However, laxing was not found to increase (or decrease) the distinctiveness of [p]–[t]. Place contrasts were not found to be less distinct after [i] than after [e], except for [t]–[k] for English listeners (β = ―0.22, SE = 0.11, p = 0.057).
Back vowels [u o ɔ]. [p]–[k] and [p]–[t] were found to be significantly more distinct after [ɔ] than after [o] (β = ―0.31, SE = 0.11, p < 0.005; β = ―0.25, SE = 0.12, p < 0.05), independently of the listeners’ native language. However, laxing was not found to increase (or decrease) the distinctiveness of [t]–[k] in either group. Raising from [o] to [u] was found to significantly decrease the distinctiveness of [p]–[k] (β = 0.24, SE = 0.11, p < 0.05), independently of native language. Raising had opposite effects on the distinctiveness of [p]–[t] in the two groups of listeners: it improved the contrast for French listeners, but made it worse for English listeners (β = ―0.26, SE = 0.12, p < 0.05).
Front rounded vowels [y ø œ]. The results for front rounded tense vs. lax mid vowels are less consistent across the two groups of speakers. Only [p]–[t] was found to be consistently more distinct after [œ] than after [ø] for both groups (β = ―0.39, SE = 0.12, p < 0.005). For [t]–[k], the results suggest a slight decrease in distinctiveness after [œ] as compared to after [ø] across the two groups (β = 0.20, SE = 0.12, p = 0.094), but this effect is entirely driven by the French listeners (β = 0.20, SE = 0.12, p = 0.088). For [p]–[k], the results suggest an increase in distinctiveness after [œ] as compared to after [ø] across the two groups (β = ―0.30, SE = 0.12, p < 0.05), but this effect is entirely due to the English listeners (β = 0.37, SE = 0.12, p < 0.005). The effects of raising from [ø] to [y] on place distinctiveness are more consistent across the two groups. Raising actually improves place distinctiveness for [p]–[k] (β = ―0.27, SE = 0.12, p < 0.05) and [p]–[t] (β = ―0.25, SE = 0.12, p < 0.05), independently of native language. Raising was not found to have any significant effect on the distinctiveness of [t]–[k] in either group.
4.6 Summary and discussion
The results of the acoustic and perceptual studies are summarised in Table VIII.
Summary of the results of the perceptual study. The symbol on the left of the slash corresponds to the results for English listeners, the one on the right to French listeners. There is a single symbol when the results were the same for both groups of listeners. Cases in which the perceptual distance (d) between the two consonants in the corresponding row is larger after the lower vowel than after the higher one are indicated by ‘+’, those in which the distance is larger after the higher vowel than after the lower one by ‘–’ and those in which there is no significant difference by ‘0’.
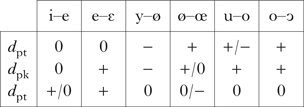
For each tense–lax mid-vowel pair [e]–[ε] and [o]–[ɔ], two place contrasts are perceptually better after the lax vowel than after the tense vowel; these are the same contrasts for both groups of listeners. In other words, each consonant among [p t k] is involved in a contrast that is improved by vowel laxing, and the effect is robust across the two languages. Note that, for [e], the results are the same for English and French listeners, regardless of phonotactic acceptability in each language.
The acoustic study shows that the perceptual improvement after lax [ε] and [ɔ] correlates with an increase in the distance between the F1 realisations of the relevant consonants in this context: when place contrasts were found to be more distinct after the lax mid vowel than after the tense mid vowel, the acoustic distance between the F1 realisations of the two relevant consonants was also found to be increased, but not necessarily the acoustic distance between the F2 realisations. However, an increase in the F1 distance is not sufficient to guarantee a perceptual improvement after these vowels (compare [p]–[t] after [e] vs. after [ε]). Further work is needed to better establish what drives the perceptual improvement after lax vowels and what is the contribution of F1.
For the tense–lax pair [ø]–[œ], the results are as expected for the English listeners (two place contrasts are improved by laxing, and this improvement correlates with an increase in the distance between the F1 realisations of the relevant consonants), but not for the French listeners (one contrast is improved by laxing, while another one is actually made less distinct). The contrast that is made perceptually less distinct by laxing ([p]–[k]) is actually less distinct along F2. The French listeners might have been relying on a complex combination of F1 and F2 as perceptual cues for place after front rounded vowels, whereas the English listeners apparently relied more on F1.
In any case, laxing does not robustly improve place contrasts in the case of front rounded mid vowels. This raises the question of why closed syllable laxing should ever affect these vowels in languages like Southern French. Two answers can be considered. Listeners might rely on the same acoustic cues as the English listeners. Alternatively, laxing of the front round mid vowel in closed syllables could be driven by a pressure to align this vowel with the other vowels of the same height ([ε] and [ɔ]). Alignments of vowels along F1 beyond what is predicted by perceptual dispersion have been observed, for instance in Catalan (Recasens & Espinosa Reference Recasens and Espinosa2006) and in French (Ménard et al. Reference Ménard, Schwartz and Aubin2008).
Lowering high vowels to tense mid vowels does not result in greater consonant distinctiveness for the French listeners. This fact may explain why high vowels are not lowered/laxed before word-final and pre-obstruent consonants in Standard and Southern French: the loss in vowel distinctiveness is not compensated by a gain in place distinctiveness for these listeners. For the English listeners, lowering was actually found to improve three out of six place contrasts. This suggests that English listeners might be sensitive to acoustic cues that are ignored by French listeners. However, the acoustic study does not provide any clear explanation for the perceptual results for high vs. tense mid vowels. The reason for this might be the fact that only the endpoints of formant trajectories were considered. Whole trajectories are conceivably important in identifying consonant place in vowels with high F1 targets, since endpoints are very close to each other.
5 Laxing as enhancement of poorly cued consonant-place contrasts
The preceding sections motivated the hypothesis that non-low vowel laxing increases the distinctiveness of postvocalic consonant-place contrasts. This section briefly addresses the hypothesis that laxing is used to compensate for the absence of strong perceptual cues to the consonant's identity in VC. The patterns discussed are taken from the languages surveyed in §2.
5.1 Pre-liquid and pre-glide consonants
In several languages, pre-liquid and pre-glide consonants are reported to be syllabified as onset consonants and therefore to favour tensing, like prevocalic consonants. For instance, in Chamorro, stressed non-low vowels are obligatorily tense before C{l, r}V and CwV (Topping Reference Topping1973: 38–40). This pattern is also found in the different varieties of French, in Javanese (Yallop Reference Yallop, Halim, Carrington and Wurm1982: 300) and in Kairiru (Wivell Reference Wivell1981: 34–35). According to the cue-based hypothesis, liquids and glides typically pattern with vowels because they have formant structure and can therefore provide sufficiently informative release transitions to a preceding consonant (Flemming Reference Flemming, Trouvain and Barry2007).
5.2 Pre-obstruent vs. word-final consonants
In some languages, word-final consonants and pre-obstruent consonants pattern differently with respect to laxing/lowering. In Dutch, tense and lax vowels contrast before word-final single consonants, but not before clusters, unless all consonants in the cluster are coronal (in this case, tense–lax contrasts are allowed, e.g. [e] beeld ‘idea’ vs. [ε] geld ‘money’). Before non-coronal clusters, all vowels are systematically lax (Trommelen Reference Trommelen1984: 67–69). In Javanese, all of [ɪ ε ɔ ʊ] are available before word-final consonants, but only [a ə] (the two lowest and most central vowels) occur before pre-obstruent consonants in the native vocabulary (Dudas Reference Dudas1976: 10).
These asymmetries are expected in the current approach if consonant-place contrasts are more distinct word-finally than within a cluster. Coarticulation with the following consonant in a C1C2 cluster is likely to weaken C1’s internal place cues and make C1 less perceptible than word-finally.Footnote 8 The hypothesis that laxing happens preferentially in contexts where C1 has worse place cues then explains why laxing may occur in VC1C2 in Dutch, but not in VC1#.Footnote 9 The Javanese pattern can be explained similarly: non-low vowels are required to lower all the way to [ə] or [a] before clusters but not before word-final consonants, because place contrasts are less distinct and therefore more in need of enhancement in clusters than word-finally.
5.3 Consonants preceding schwa and high vowels
Two languages in the survey present exceptions to the generalisation that prevocalic consonants favour tensing. In Javanese, pre-schwa syllables and syllables followed by word-final high vowels pattern with closed syllables with respect to laxing: they must be preceded by a lax mid vowel [ε ɔ] (Yallop Reference Yallop, Halim, Carrington and Wurm1982: 302). Similarly, in Southern French, mid vowels are lax in pre-schwa syllables (Coquillon & Turcsan Reference Coquillon and Turcsan2012).
The fact that high vowels or schwa may favour laxing as compared to other vowels can be derived in the present analysis if these vowels provide less informative place cues to a preceding consonant. The reason could be that they are short (and typically subject to syncope across languages), and therefore do not provide sufficiently distinct release transitions (or any release transitions in the case of syncope). The hypothesis that laxing in these contexts is related to the duration of the vowel in the following syllable is supported by Storme's (Reference Storme, Jesney, O'Hara, Smith and Walker2017a) experimental results, according to which French speakers who lax mid vowels in pre-schwa syllables (i.e. Southern speakers) have shorter schwas on average than speakers who do not (i.e. Standard speakers).
5.4 Geminate vs. singleton consonants
In some languages, laxing is observed not only before clusters, but also before geminates (e.g. Chamorro; Topping Reference Topping1973). The fact that geminates can pattern differently from singletons receives an explanation under the cue-based approach if clusters (e.g. [ikta]) are more confusable with geminates (e.g. [itːa]) than with singletons (e.g. [ita]), as a result of the longer closure duration of geminates. Vowel laxing before geminates is used to enhance the contrast between the closure transitions into the geminate and into the first consonant of the competing cluster (e.g. [ɪtːa]–[ɪkta]). In the case of singletons (e.g. [ita]), the consonant closure is too short for the consonant to be confused with a cluster, and laxing is superfluous.
6 Dispersion-theoretic analysis
The preceding sections have motivated the main hypotheses underlying the enhancement-based analysis of CSL and OST. This section sketches a preliminary dispersion-theoretic analysis of the typology of tense–lax vowels, based on these hypotheses. The analysis is simplified in several respects. In particular, vowel duration will not be included, although it was argued to be crucial to explain OST-only patterns like Dutch (see §2.2) and patterns of low-vowel raising in closed syllables (see §2.3). The main goal of this section is to pave the way for a more comprehensive analysis, which would include both formant and temporal information.
6.1 Model
A key hypothesis in Dispersion Theory (Liljencrants & Lindblom Reference Liljencrants and Lindblom1972, Flemming Reference Flemming2002) is that sounds used in languages should be distinct enough to allow for efficient communication between language users. For this reason, this theory is well suited to model patterns of contrast enhancement. This paper follows the implementation of Dispersion Theory in Optimality Theory proposed by Flemming (Reference Flemming2008), and elaborated upon by Stanton (Reference Stanton2017: ch. 1). Contrast preservation is ensured by a constraint which favours large phonological inventories over smaller ones. Contrast neutralisation or enhancement is made possible by a set of constraints which favour more distinct contrasts over less distinct ones.
The specific grammatical architecture used by these authors is modular, with the selection of sound inventories and the selection of sound sequences belonging to two distinct modules: the sounds of a language are selected in a first module (the inventory module), these sounds are then concatenated and coarticulated according to a language-specific phonetic grammar (the phonetic realisation module) and the resulting sound sequences are evaluated as to their phonotactic well-formedness (in the phonotactic module). This modular architecture is convenient, because it makes it possible to treat inventory selection and phonotactics as distinct optimisation problems, and therefore to keep the analysis simple by focusing on a single problem at a time. This section focuses on the phonotactic problem.
6.2 Analysis
To simplify, only two tense–lax pairs will be considered in the analysis, [i]–[ɪ] and [u]–[ʊ]. Vowel inventories are selected in an auditory space with two dimensions, corresponding to the auditory correlates of F1 and F2. According to Liljencrants & Lindblom's (Reference Liljencrants and Lindblom1972) model, the best-dispersed five-vowel inventory in this space is [i e a o u], with the three corner vowels and two mid vowels. In general, lax high vowels have similar F1 and F2 targets to the corresponding mid vowels (see Fig. 1). The five-vowel inventory can therefore be transcribed as [i ɪ a ʊ u]. This latter notation will be used in order to allow the tense–lax pairs [i]–[ɪ] and [u]–[ʊ] to be identified more clearly.
Because tense–lax alternations and contrasts are the main focus in the paper, the inventory without any tense or lax vowels (i.e. [i̞ a̝ u̞]; see Table IIe in §2.1) is not considered in this analysis. This pattern could arguably be derived in a more comprehensive model, including articulatory as well as perceptual factors, as will be discussed in §6.3. Similarly, the lax low vowel is not included in the inventory, because low-vowel laxing in closed syllable was analysed as vowel reduction in §2.3, rather than enhancement.
I assume the minimal consonant inventory [C1 C2], where C1 and C2 stand for two consonants with different places of articulation among labial, coronal and velar (see Schwartz et al. Reference Schwartz, Boë, Badin and Sawallis2012 for a discussion of consonant-place features in the context of Dispersion Theory). In addition, it is assumed that, for all possible phonetic grammars for VC coarticulation, (i) the contextual realisations of [i a u] are always more distinct than the contextual realisations of [ɪ a ʊ], and (ii) the contextual realisations of C1 and C2 are always more distinct after the lax vowels [ɪ ʊ] than after the tense vowels [i u].
The phonotactic module evaluates the well-formedness of concatenations over the set of sounds. There is a total of 5 + (5 × 2) = 15 V and VC syllables that can be formed by conatenating the five vowels and two consonants considered here. There are as many candidate syllable inventories as there are non-empty subsets of the set of V and VC concatenations (i.e. 215−1). However, this analysis only considers a small subset of candidates, i.e. the nine patterns in Table IX. These patterns correspond to the nine possible ways of distributing the three tense–lax patterns (tensing, laxing and tense–lax contrasts) in two contexts (V and VC). The table indicates which among those patterns are attested in the language survey in §2.
Attested patterns vs. patterns predicted by the duration-free Dispersion Theory model (/VC1,2/ = /VC1 VC2/; A = attested; P = predicted; ATB = across-the-board).
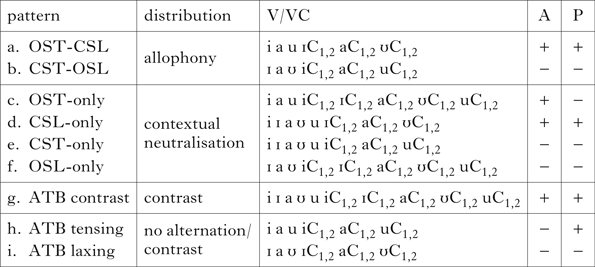
Pattern (b) is an unattested pattern of allophonic distribution with open syllable laxing (OSL) and closed syllable tensing (CST). Pattern (e) has only CST, and (f) has only OSL. In patterns (h) and (i), there are no tense–lax alternations or contrasts, and vowels are respectively tense and lax across the board. These patterns are considered unattested because, in inventories without tense–lax alternations or contrasts, vowels are reported to have an intermediary quality between the corresponding tense and lax vowels (see §2.1).
The patterns in Table IX were evaluated by a constraint-based phonotactic grammar, with a constraint assigning a violation for each syllable among the 15 basic V and VC syllables that is missing in the relevant candidate inventory.Footnote 10 This constraint has the effect of favouring large syllable inventories over small ones (cf. Flemming's Reference Flemming2002 MaxContrast constraint).
A family of constraints assigns violations to syllable pairs according to the perceptual distinctiveness of their internal segments (cf. Flemming's MinDist constraints). For instance, the pair [ɪC1]–[ʊC1] violates a constraint requiring the distance between two vowels to be strictly larger than the [ɪ]–[ʊ] distance. This constraint is not violated by the more distinct pair [iC1]–[uC1] and will therefore favour more distinct vowel contrasts, as desired. In typology.txt, vowel-dispersion constraints penalise vowel contrasts in the following order (from least distinct to most distinct): [i]–[ɪ], [ɪ]–[a], [u]–[ʊ], [ʊ]–[a] > [ɪ]–[ʊ] > [ɪ]–[u], [ʊ]–[i]. Contrasts among corner vowels are not penalised by any constraint. This ordering enforces a preference for [i u] over [ɪ ʊ].
Similarly, the pair [uC1]–[uC2] violates a constraint requiring the distance between [C1] and [C2] to be strictly larger than allowed after [u]. This constraint is not violated by [ʊC1]–[ʊC2], because a lax vowel allows for more distinct VC transitions into [C1] and [C2], and will therefore favour more distinct place contrasts, as desired. In typology.txt, a place-dispersion constraint penalises [iC1]–[iC2] and [uC1]–[uC2], but there is no constraint penalising the more distinct [ɪC1]–[ɪC2] and [ʊC1]–[ʊC2].Footnote 11
6.3 Results
OT-Help 2.0 (Staubs et al. Reference Staubs, Becker, Potts, Pratt, McCarthy and Pater2010) was used to run a factorial typology using typology.txt as input. The analysis's predictions are indicated in the rightmost column in Table IX.
The analysis correctly predicts that CSL and OST should be attested as phonological processes (patterns (a) and (d)), but not CST and OSL (patterns (b), (e), (f)). It also correctly predicts that tense–lax contrasts may be maintained across the board (pattern (g)), and that there should be no default preference for lax vowels (pattern (i)).
One potentially problematic prediction concerns OST. OST is not predicted to be attested as an independent process. Indeed, it cannot occur alone (pattern (c) is ruled out). This result is not surprising, because the model does not include any context-specific preference for tense vowels: if tensing is observed in open syllables, then it should be observed in closed syllables as well. It was argued in §2.2 that OST-only patterns are best analysed as driven by neutralisation of duration contrasts. Modelling this type of patterns would therefore require a richer notion of vowel distinctiveness, involving both formants and duration. Among patterns without tense–lax alternations or contrasts, the analysis derives the apparently unattested pattern with across-the-board tensing (Table IXh). This is the best of all the candidates in terms of vowel dispersion. It can be derived when maximal vowel dispersion is required (e.g. when the vowel-distinctiveness constraints are top-ranked). This problematic prediction could arguably be avoided in a more comprehensive model, in which the preference for maximal dispersion is counterbalanced by a preference for less articulatory effort in small vowel inventories. Indeed, in such a model, the three-vowel inventory [i̞ a̝ u̞] could be preferred to the better-dispersed three-vowel inventory [i a u], because [i̞ a̝ u̞] have less extreme formant targets than [i a u], and are therefore less difficult to produce (see Becker-Kristal Reference Becker-Kristal2010: 15).
7 Conclusion
This paper has assigned a primary role to vowel quality in explaining the cross-linguistic preference for lax vowels in closed syllables and tense vowels in open syllables. Vowel laxing enhances poorly cued postvocalic consonant-place contrasts, by providing more distinct formant (in particular F1) transitions into a following consonant. In contexts where postvocalic consonant-place contrasts need not be enhanced, vowel tensing enhances vowel contrasts by providing more distinct formant realisations for vowels. The hypotheses that underlie this account were supported by phonetic and typological evidence.
This section concludes by briefly discussing the relationship between vowel quality and vowel duration in tense–lax patterns. On purely articulatory grounds, lax vowels should be longer than tense vowels, since lower vowels require greater articulatory movement and are generally longer than high vowels (Lehiste Reference Lehiste1970). This raises the question of why lax vowels are often shorter than tense vowels (Lindau Reference Lindau1978).
In languages where tense and lax vowels are in allophonic distribution, laxness and shorter duration might go together because contexts where the postvocalic consonant lacks good cues to place generally happen to be contexts that trigger vowel shortening, i.e. consonant clusters and word-final consonants (see Maddieson Reference Maddieson and Fromkin1985 on closed syllable shortening and Katz Reference Katz2012 on vowel compression before clusters in English). However, if laxing and shortening are caused by different mechanisms, they should not always have the same distribution. And indeed, mid-vowel laxing in Southern French applies before coda [s], but mid-vowel shortening does not (Storme Reference Storme2017b).
In languages where tense–lax contrasts are signalled by both vowel-quality and vowel-duration differences, covariation of duration and quality is probably best understood in terms of enhancement, as originally proposed by Stevens (Reference Stevens1998: 294–299): differences along the two acoustic dimensions are mutually enhancing in signalling phonemic distinctions. This conclusion is strengthened by the fact that tense vowels are not always longer than lax vowels in systems with tense–lax contrasts. For instance, in Standard French, no durational difference is reported for contrasting tense [e] vs. lax [ε]. In Italian, lax mid vowels [ε ɔ] are actually reported to be longer than their tense counterparts [e o] (Kenstowicz Reference Kenstowicz2010), in accordance with Lehiste's (Reference Lehiste1970) results on inherent vowel duration.
If duration can be used as a secondary cue to enhance vowel quality distinctions in tense–lax contrasts, a dispersion-theoretic account of the tense–lax distinction should ultimately also include duration as a phonetic dimension. And indeed, the distribution of duration contrasts was argued to be crucial in deriving the distribution of tense and lax vowels in languages with OST only (see §2.2). Duration and articulatory effort should also be included in the analysis to model patterns of low-vowel laxing (analysed as coarticulation in §2.3) and vowel centralisation in small vowel inventories (see §6.3). In view of these limitations, the model presented in §6 should be seen as only a first step towards a more comprehensive analysis, where (i) both distinctiveness and effort constraints play a role and (ii) both vowel quality and duration play a role in contrast distinctiveness.