History and occurrence
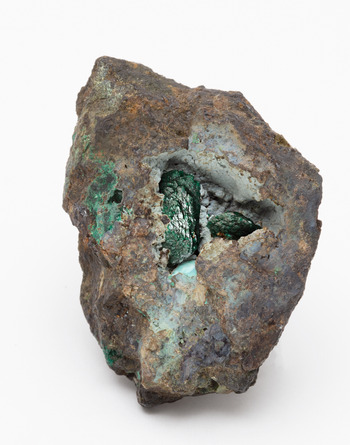
Kernowite was identified on an old museum specimen labelled as a liroconite from Wheal Gorland in the Sir Arthur Russell Collection of British Minerals housed at the Natural History Museum in London (Fig. 1). The specimen, registered as BM 1964,R8908 was, prior to the ownership of the NHM and Russell before that, in the collection of the important Cornish mineral collector and Member of Parliament, Philip Rashleigh (1729–1811) and bears some notable resemblance to one of the earliest figured examples of liroconite by James Sowerby in 1803 (Sowerby, Reference Sowerby1804).
Holotype sample BM 1964,R8908, the large central crystal is ~12 mm in size, all material used in the study was removed from the remnants of the cavity infill, probably the base of a broken crystal present on the left of the image. The large crystals were not sampled so that their form on this historic specimen was preserved.

The specimen was selected as being of interest during a systematic study of liroconite by one of us (MSR) in the mid 2000's. Since its discovery, probably in the late 1790's (De Bournon, Reference Count1801) and approximate naming (as liriconite) by Jameson (Reference Jameson1821) it has been regularly recognised as varying in colour from sky-blue to ‘verdigris’ or grass-green, speculation suggested this was due to variation in phosphate–arsenate content (Berry, Reference Berry1938), but no modern confirmatory work had been performed. Specimen BM 1964,R8908 was selected for study due to its unusual dark-green colour, more akin to that of an emerald (Fig. 1). Chemical (energy-dispersive spectroscopy) analysis of a small fragment suggested that the material was an Fe-dominant analogue of liroconite, but the work was never formally written up.
Due to the historic nature of the specimen, probably collected between 215–225 years ago, there is an element of uncertainty with respect to its locational provenance, exacerbated in this case as there has been informal debate for years questioning if all old liroconite specimens are from the commonly attributed Wheal Gorland. For lack of a means of verifying the exact source location, the attributed locality of Wheal Gorland, given either by Sir Arthur Russell or Philip Rashleigh is, henceforth, assumed to be correct.
Wheal Gorland was situated in the Parish of St. Day, Cornwall, United Kingdom (50°14’30”N, 5°10’58”W) and was first recorded as a working mine in 1792 (Anon., 1799). It's history since this time is well documented, as is its fame within the mineral collecting community for its rich, beautiful and largely unique suite of copper arsenate minerals, including the iconic liroconite. The locality and most of its mineral dumps no longer exist, having been removed or levelled for recent housing developments. Only a small dump, preserved as an SSSI (Site of Special Scientific Interest) remains.
Kernowite occurs with poorly-crystalline arsenic phases including pharmacosiderite and olivenite-group minerals in cavities in a quartz-gossan, rich in undifferentiated micro-crystalline grey sulfides. Recent work by Plumhoff et al. (Reference Plumhoff, Dachs, Benisek, Plášil, Sejkora, Števko, Rumsey and Majzlan2020) suggests that the crystallisation of liroconite is related closely to the formation of arsenic-rich gels/mineraloids and it is suggested here, on the basis of the assemblage present, that kernowite is similar. It is interesting to note that the mineral and textural associations on this sample are subtly different to the majority of specimens labelled liroconite from Wheal Gorland.
An extensive study by one of us (MS) recently identified a second kernowite-containing specimen, also attributed to Wheal Gorland, providing context to the rarity of the kernowite–liroconite distinction. In a full study of over 60 samples, 25 of which were analysed and ten of which were ‘green’, only one with crystals exhibiting a 0.5 mm green rim and blue cores could be described as kernowite-containing and this was only in the green rims. This colour zonation from a blue core to green rim has been noted in liroconite specimens since at least 1803 (Sowerby) and is now deserving of more attention. Considering the many liroconite samples in existence, it is likely that other specimens bearing kernowite are present in public and private collections. However, we stress that accurate chemical analysis is essential for determination, as very few of the ‘green-liroconites’ analysed thus far have been kernowite.
Kernowite, is named after the word for Cornwall in the Cornish language, which is commonly spelt ‘Kernow’. As the exact locality attribution of Wheal Gorland, although likely, is not certain it is reasonable to name the mineral after the region that we know the sample is from. Furthermore, as the analogue of liroconite, kernowite is a doubly appropriate name, reflecting liroconite's place as one of Cornwall's most iconic mineral species famous around the world for its striking colour, historic origin and rarity. Kernowite will join both cornwallite and cornubite as markers of the historic importance of Cornwall in mineral sciences. The region recognised by UNESCO as a world heritage site based on its importance to the history of mining.
The mineral and name have been approved by the International Mineralogical Association (IMA) Commission on New Minerals, Nomenclature and Classification (IMA2020-053, Rumsey et al., Reference Rumsey, Welch, Spratt, Kleppe and Števko2020). Holotype material is stored at the Natural History Museum in London, within the Sir Arthur Russell Collection of British Minerals, the sample consists of a specimen, two polished microprobe blocks, a number of mounted crystal fragments for single crystal studies and a small number of loose tiny fragments, are all registered collectively under the number BM1964,R8908.
Composition
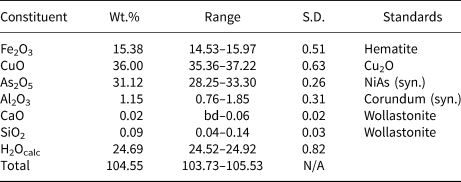
All fragments subsampled for analysis from the holotype specimen were taken from a cavity infill with no obvious crystal form due to it completely encompassing the cavity. The largest fragment sub-sampled, ~2 mm in size, was mounted in epoxy, polished and carbon coated. Fourteen chemical analyses were obtained on a Jeol JXA-8530A+ Hyper probe at the Natural History Museum, London. Settings were 15 kV (beam voltage) and 10 nA (beam current) with a 10 μm spot size. Cu, Al, Fe, Na, Si, Ca and As were sought, and other potentially relevant elements, including P, Pb, Bi and Zn were ruled out through prior analyses on a Cameca SX100. The data were corrected for any elemental overlaps and, like other studies on liroconite-series minerals (Plumhoff et al., Reference Plumhoff, Dachs, Benisek, Plášil, Sejkora, Števko, Rumsey and Majzlan2020), showed dehydration under vacuum, resulting in only the first nine points being used. It should be noted that elemental ratios remained consistent across all 14 analyses made. H2O was calculated using data from the crystallographic study. Results are presented in Table 1, which correspond to an average composition of Cu1.88(Fe0.79Al0.09)Σ0.88(As1.12O4)(OH)4⋅3.65H2O, the most Fe-rich analysis, normalising Al+Fe, was Fe93, the least Fe83.
Chemical data (n = 9) for kernowite.

S.D. – Standard deviation; bd – below detection.
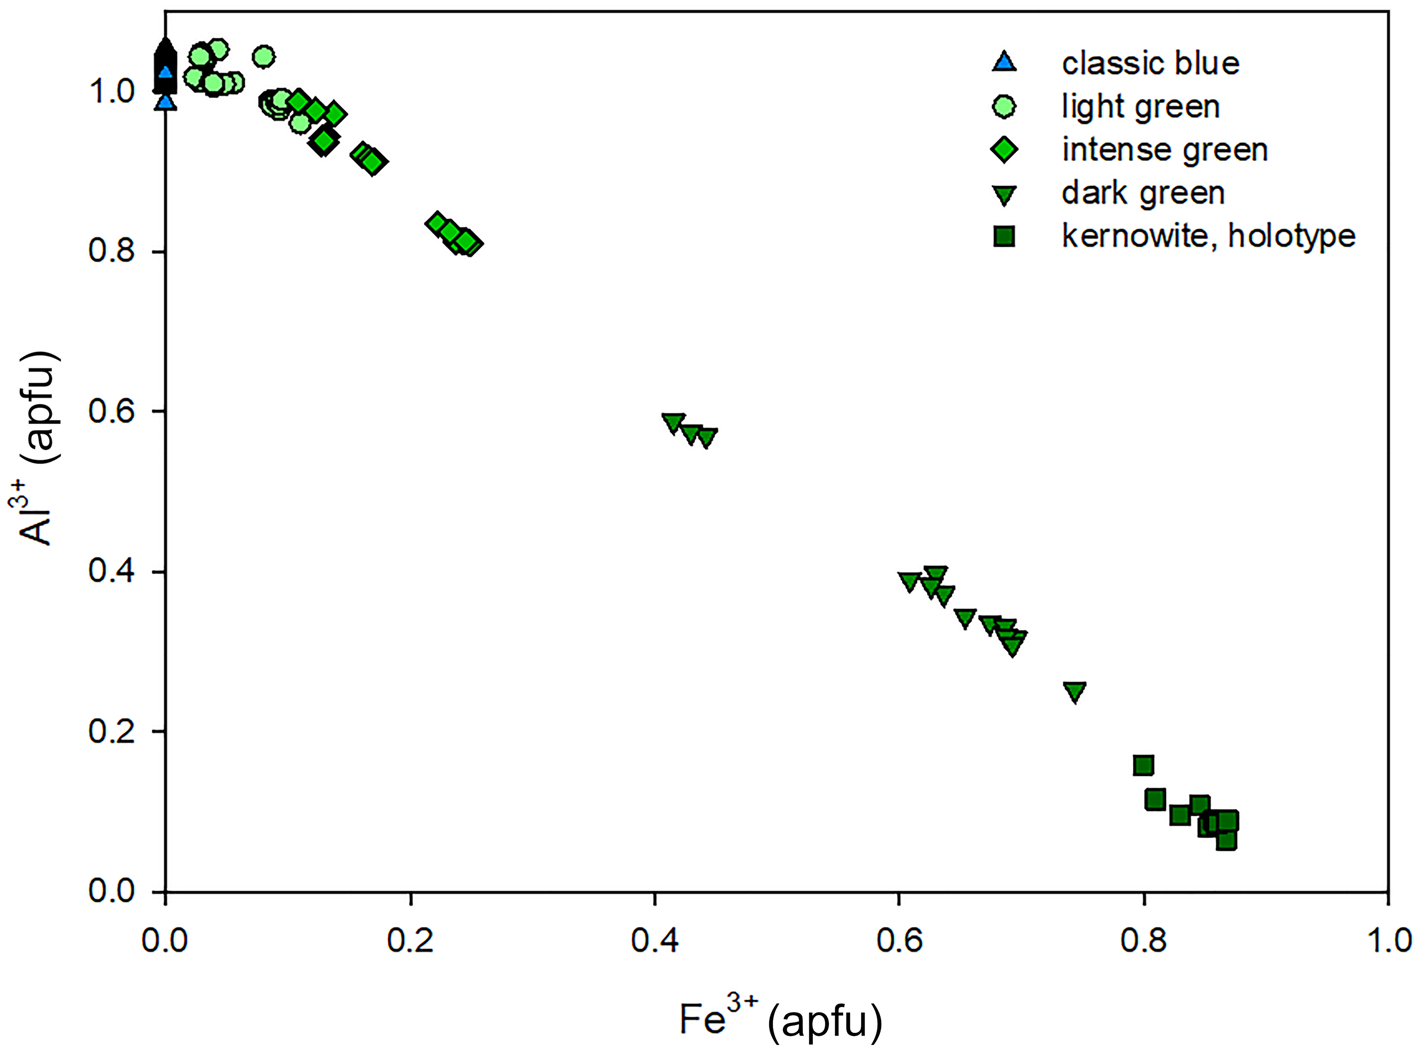
The additional study utilised a Cameca SX100 electron microprobe at the Laboratory of Electron Microscopy and Microanalysis of the Masaryk University and Czech Geological Survey in Brno, Czech Republic, operating in the wavelength-dispersive (WDS) mode (15 kV, 20 nA and 10 μm wide beam). The following standards and X-ray lines were used to minimise line overlaps: albite (NaKα), almandine (FeKα), fluorapatite (CaKα and PKα), Bi (BiMα), celestine (SKα), diopside (MgKα), gahnite (ZnKα), lammerite (CuLα and AsLα), sanidine (AlKα, KKα and SiKα), ScVO4 (VKα), spessartine (MnKα), topaz (FKα) and vanadinite (PbMα and ClKα). A total of 114 analyses from the 25 representative samples of liroconite (15 blue and 10 with various shades of green) as well as data for the holotype sample of kernowite are shown in an Fe vs. Al plot (Fig. 2).
Plot of the Al–Fe composition of 26 liroconite–kernowite specimens, the most Fe rich being the kernowite holotype. The plot additionally features an approximation of how the colour of the sample changes with increasing Fe content from blue through blue–green to green and dark green, many green and blue–green samples still fall in the compositional field of liroconite.

Crystal structure
A fragment of kernowite (0.165 mm × 0.115 mm × 0.080 mm) removed from the cavity infill was attached to a non-diffracting amorphous carbon fibre (0.01 mm diameter), itself glued to a glass support rod (0.1 mm diameter), and turned out to be singularly crystalline. Data collection used an XcaliburE four-circle diffractometer equipped with an Eos area detector and graphite-monochromated MoKα radiation operated at 50 kV and 40 mA. Raw reflection intensities were corrected for polarisation and Lorentz effects and converted to structure factors using the program CrysalisPro ® (Rigaku Oxford Diffraction). Structure solution (Direct Methods) and refinement used SHELX (Sheldrick, Reference Sheldrick2015). Neutral atomic scattering factors (Wilson, Reference Wilson1992) were used for all atoms H, O, Al, Fe and Cu.
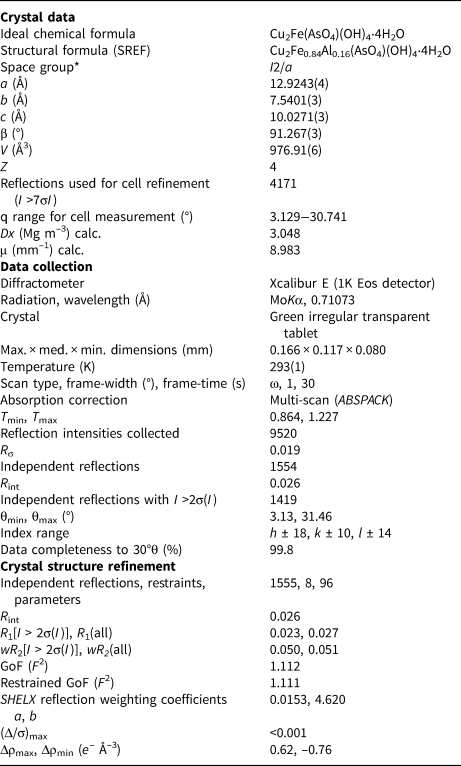
Systematic absences were consistent with space groups C2/c and Cc. Structure solution and refinement indicated that C2/c is the correct space group. To facilitate a comparison with the structure of the Al-analogue liroconite, Cu2Al(AsO4)(OH)4⋅4H2O, reported by Burns et al. (Reference Burns, Eby and Hawthorne1991), we have used the non-standard setting I2/a and the data presented here were obtained by refinement in this space group. We note that an attempt to determine the structure in non-centrosymmetric space group Ia (the other possibility) resulted in high correlations between atoms related by a centre of symmetry. Furthermore, the Flack parameter was close to 0.5, indicative of true centrosymmetry and confirms space group I2/a as the correct choice.
Site scattering at the M 3+ site was modelled using Al and Fe neutral scattering factors and refined to 84(1)% Fe and 16% Al. As no other trivalent cations were detected by electron microprobe analysis, this ratio is considered to indicate the true occupancy of this site. The site composition is also within the range of compositions determined by EMPA as Fe83–Fe93 (see above). The occupancies of Cu and As sites were also allowed to vary: their site-scattering values were consistent with full occupancy by Cu [0.95(1)] and As [0.96(1)], consistent with Al, Fe, Cu and As being the only significant cationic species detected by EMPA. Cu and As occupancies were set at 100% Cu and 100% As for subsequent refinements.
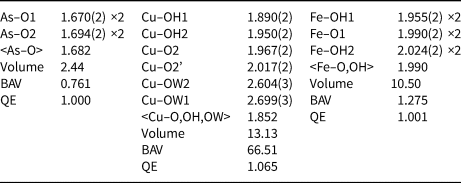
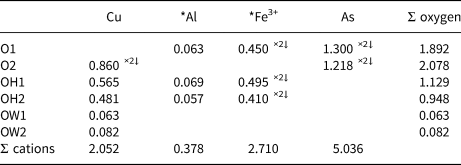
All six non-equivalent H atoms were found after eight cycles of least-squares isotropic refinement. A soft restraint on the O–H bond-length of 0.85 ± 0.05 Å was used in the refinement of H positions. A further soft restraint on the H⋅⋅⋅H distance (1.35 ± 0.05 Å and consistent with the bond-length restraint) was used to ensure a refined value of the H–O–H angle near to 104.5°, the near-tetrahedral angle associated with sp 3 bonding in H2O. Two H atoms are associated with a pair of non-equivalent OH groups and four H with two non-equivalent H2O molecules. The U iso values of H atoms of the hydroxyl and water molecules were refined independently as a pair and a quartet, respectively. Full anisotropic refinement of all non-H atoms and isotropic refinement of all six H atoms gave final agreement indices R 1 = 0.023, wR 2 = 0.051 and Goodness-of-Fit = 1.112. Information relating to the data collection and structure refinement are summarised in Table 2. Atom coordinates and atom displacement parameters are given in Table 3; bond-lengths and polyhedral parameters in Table 4; bond-valences are shown in Table 5. A list of structure factors and the crystallographic information file has been deposited with the Principal Editor of Mineralogical Magazine and is available as Supplementary material (see below).
Summary of information relating to data collection and structure refinement of kernowite.

*non-standard setting of C2/c
Atom coordinates of kernowite (SG I2/a) and atom displacement parameters (Å2).

*Refined occupancy of M 3+ site = 0.84(1) Fe + 0.16 Al.
**U iso
Bond lengths (Å) and polyhedral data for kernowite*.

*Polyhedral volume (Å3), bond-angle variance (BAV, °2) and quadratic elongation (QE) calculated according to Robinson et al. (Reference Robinson, Gibbs and Ribbe1971) using VESTA (Momma and Izumi, Reference Momma and Izumi2011).
Bond-valence parameters (valence units) of kernowite calculated using Brown and Altermatt (Reference Brown and Altermatt1985).

*Calculated for M 3+ = 0.84 Fe3+ + 0.16 Al.
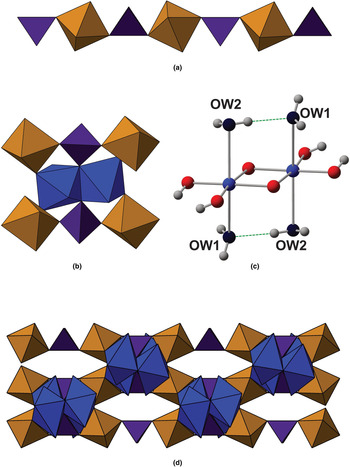
The structure of kernowite is shown in Fig. 3. It consists of chains of alternating corner-sharing Fe3+O4(OH)2 octahedra and AsO4 tetrahedra extending parallel to the a axis. A chain is connected to two adjacent chains by CuO2(OH)2(H2O)2 dimers in which the pair of octahedra share an edge. CuO2(OH)2(H2O)2 dimers connect to an Fe–As chain by corner-sharing involving OH groups shared between Cu and Fe octahedra or an unprotonated oxygen between the Cu octahedron and As tetrahedron.
Crystal structure of kernowite. AsO4 tetrahedra, FeO2(OH)4 and CuO2(OH)2(H2O)2 octahedra are shown in purple, brown and blue, respectively. (a) The AsO4−FeO2(OH)4 chain extending parallel to [100]; (b) the fundamental structural polyhedral unit of kernowite that is polymerised to build the full structure; (c) a Cu2O2(OH)4(H2O)4 dimer showing the intra-dimer hydrogen bond between the two non-equivalent H2O molecules; (d) the structure of kernowite projected onto (001) and showing the chequerboard arrangement of polymerised structural units.

Hydrogen bonding in kernowite
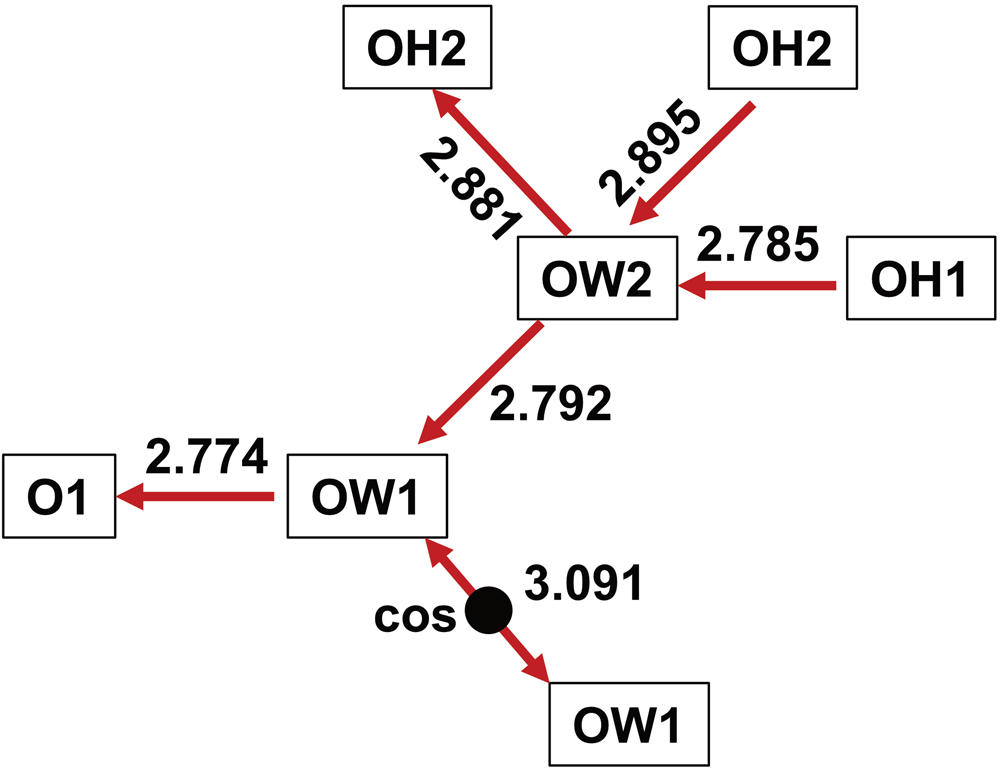
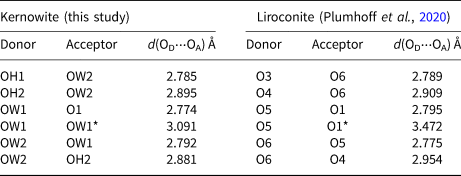
Two of the six H atoms, H1 and H2, form OH groups whereas the remaining H3–H6 atoms are associated with two non-equivalent water molecules that form long Cu–O bonds. The latter are arranged in trans configuration and form two long Cu−O bonds (2.604 Å and 2.699 Å). The hydrogen-bonding network of kernowite is shown schematically in Fig. 4 and donor–acceptor OD(H)⋅⋅⋅OA distances are given in Table 6. The H–O–H angles for both H2O molecules are 106(3)°.
Schematic diagram of the hydrogen-bonding network in kernowite. Oxygen donor−acceptor distances (Å) are shown with an arrow pointing from the donor to the acceptor. ‘COS’ indicates a centre of symmetry that acts upon the network topology.

Oxygen donor−acceptor distances OD(H)⋅⋅⋅⋅OA in kernowite (this study) and those of liroconite (Plumhoff et al., Reference Plumhoff, Dachs, Benisek, Plášil, Sejkora, Števko, Rumsey and Majzlan2020). The correspondence for atom labels of the two studies is kernowite/liroconite: O1/O1, O2/O2, OH1/O3, OH2/O4, OW1/O5 and OW2/O6.

* Different acceptor atoms are reported for the two minerals. See text for discussion.
Powder X-ray diffraction
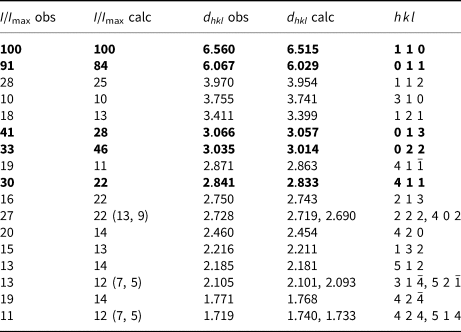
The decision to use only a small quantity of kernowite for study precluded a standard flat-plate powder X-ray diffraction pattern being obtained. This was considered by the authors as an acceptable compromise as single-crystal data show that kernowite is clearly isostructural with its chemical analogue liroconite. A quasi-randomised powder pattern using the crystal for which the structure was determined was obtained using a Gandolfi-like movement of φ and ω circles on a Rigaku RAPID-II diffractometer equipped with a cylindrical image-plate and graphite-monochromated CuKα radiation operated at 45 kV and 40 mA. The pattern was fitted using the Pawley method and refined unit-cell parameters (space group I2/a) obtained using the program HighScore (®PanAnalytical Industries, Degen et al., Reference Degen, Sadki, Bron, König and Néner2014): a = 12.927(1), b = 7.5430(9), c = 10.0332(7) Å, β = 91.212(4)° and V = 978.1(1) Å3. These values are in good agreement with those determined by single-crystal X-ray diffraction. A list of reflection data for kernowite obtained by the Gandolfi method described above is given in Table 7.
Quasi-powder diffraction data (d in Å, I in %) for kernowite collected from the single crystal used in the structure determination. The calculated intensities are based upon the structure determination.*

*Only observed reflections with I/I max ≥ 10% are listed (2θmax = 52.8°). The five strongest reflections are shown in bold.
Raman spectroscopy
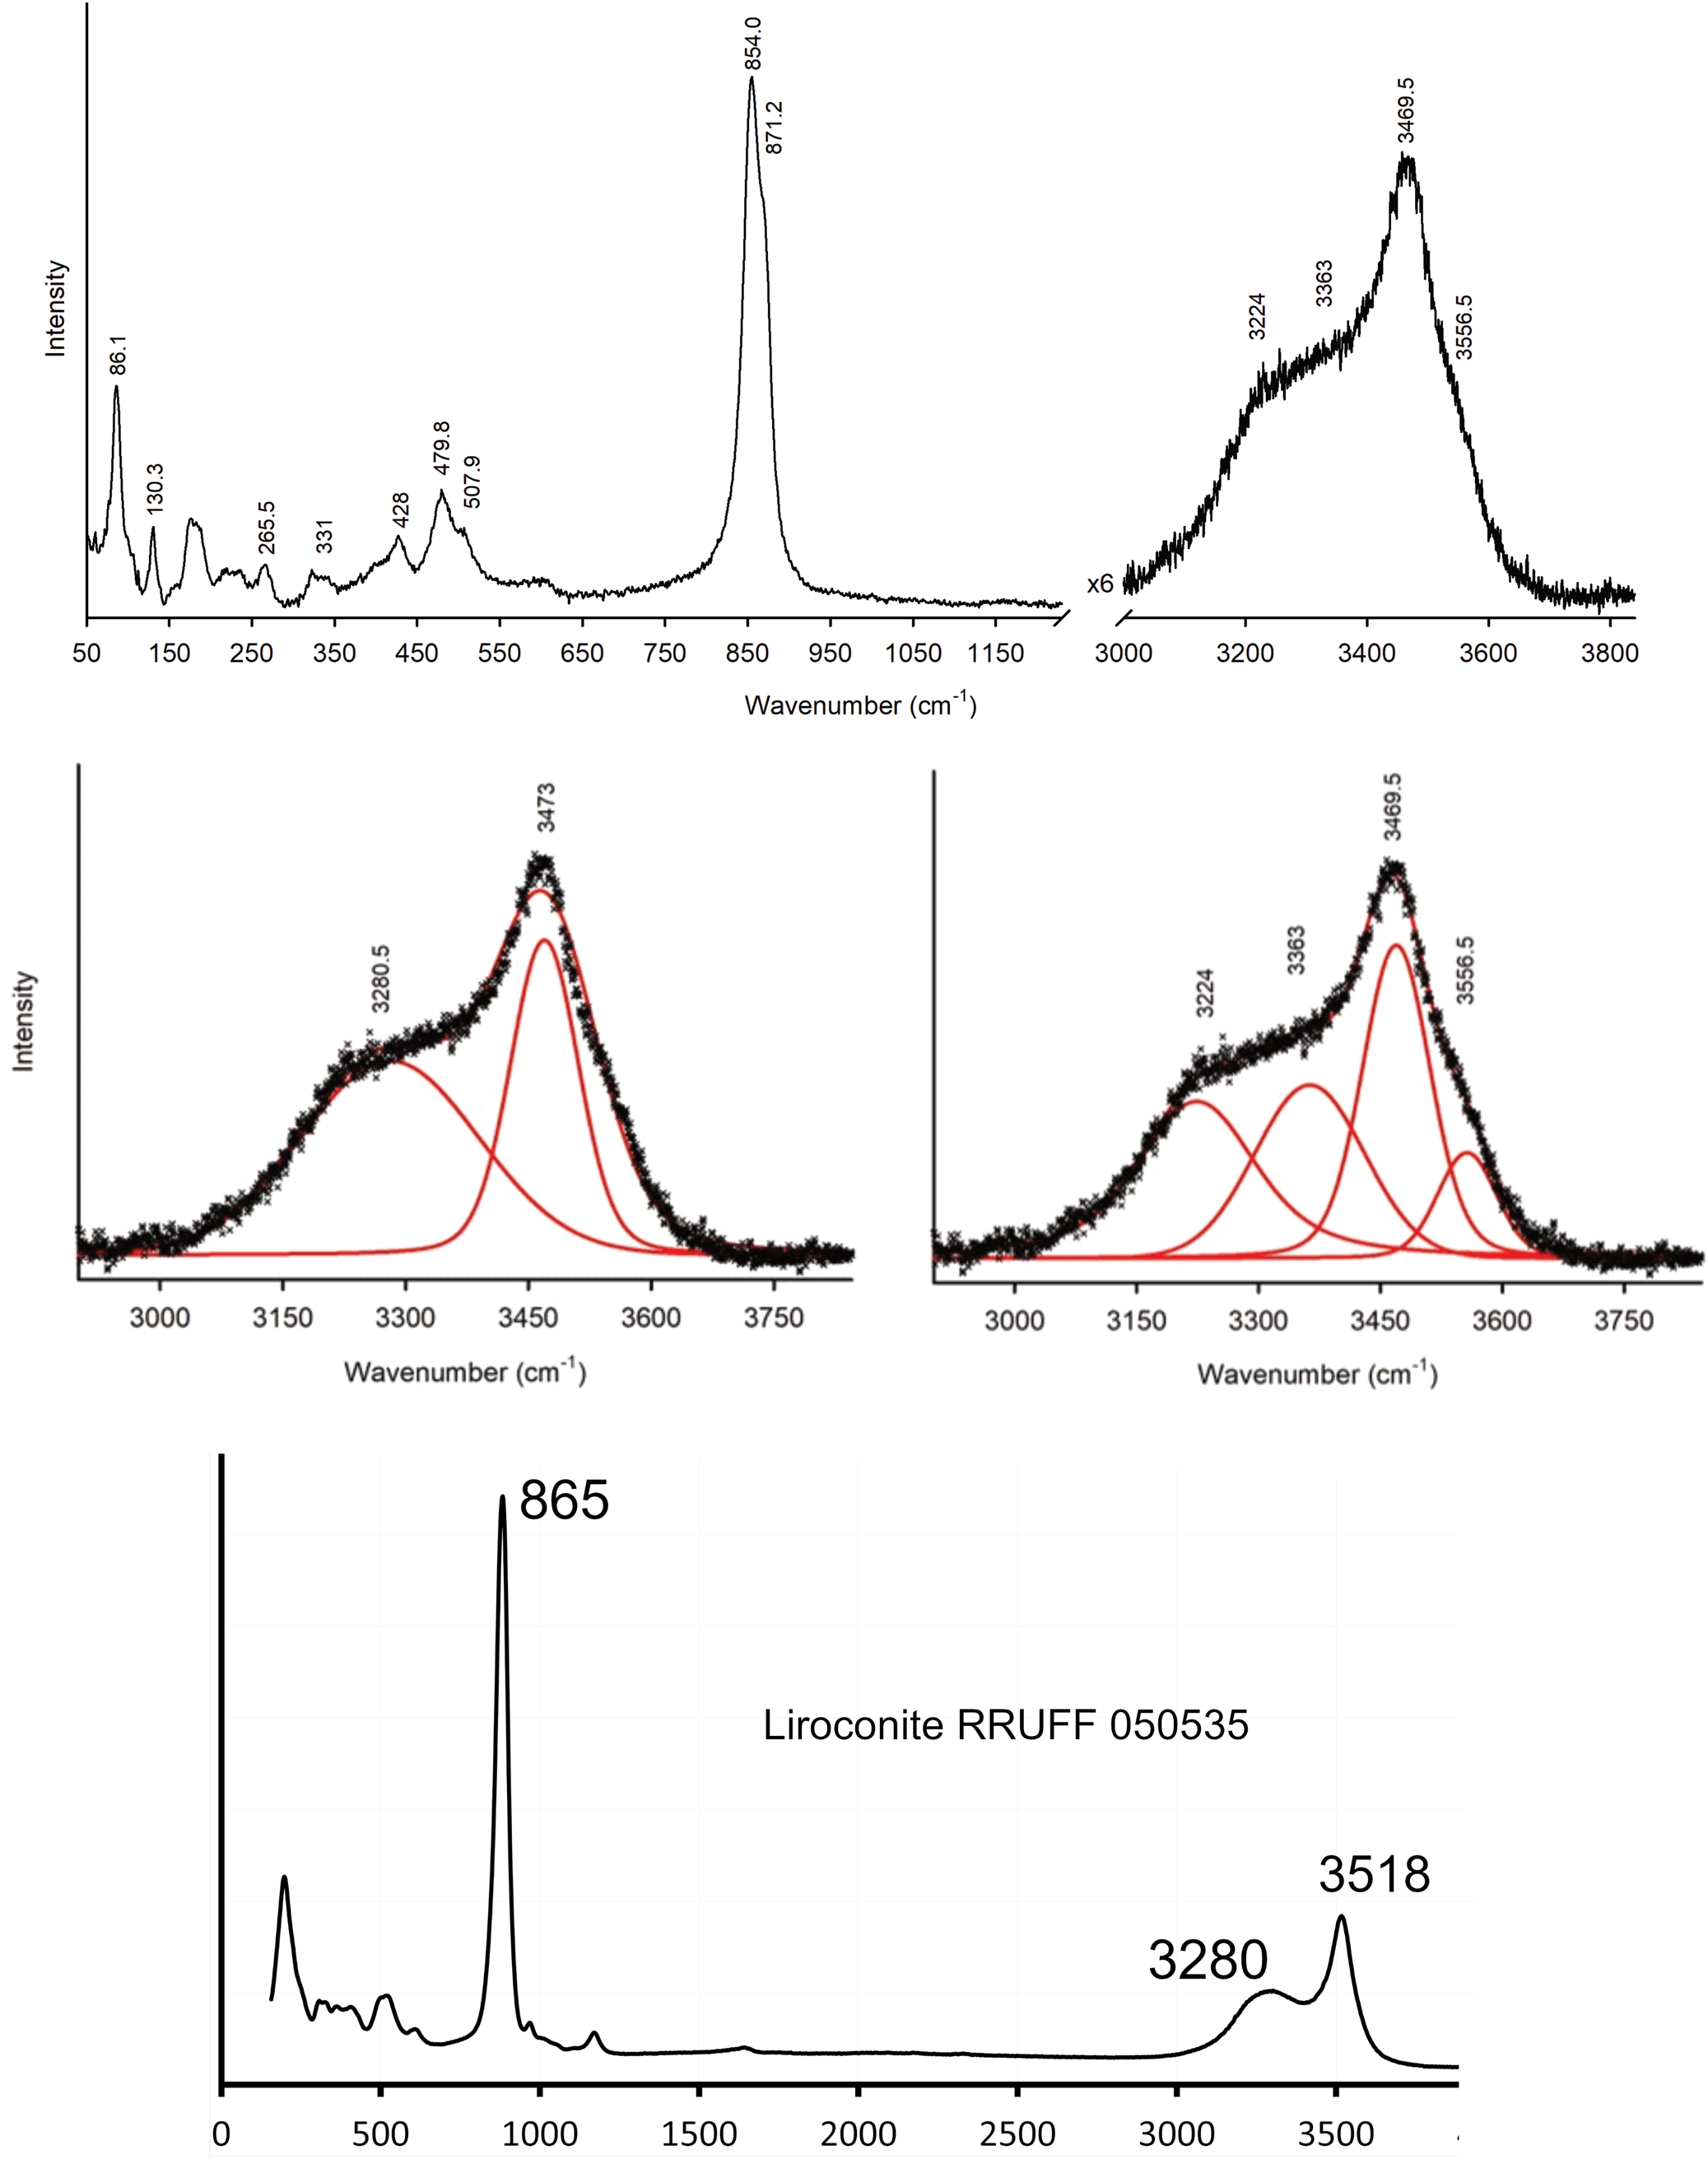
The unpolarised Raman spectrum of kernowite was obtained by dispersing crystal fragments (<0.1 mm maximum size) on a 0.3 mm diameter culet of an ultra-low fluorescence Raman diamond (Almax Industries). Ambient spectra were collected in 180° back-scattering geometry over the range 100–4000 cm−1. The instrument used was a Labram HR800 (Horiba Jobin–Yvon) spectrometer on beamline I15 at Diamond Light Source, UK. It was equipped with 1200 g grating and a CCD detector. The spectra were excited by the 473 nm line of a 50 mW Cobalt Blues TM laser focused down to a 0.01 mm spot on the sample and collected through a 0.05 mm confocal aperture. The intrinsic resolution of the spectrometer is <1 cm−1 and calibrations are accurate to ±1 cm−1. The frequency of each Raman band was obtained by fitting Voigtian line profiles using a least-squares algorithm. The Raman spectrum of kernowite is shown in Fig. 5 for the 100–1100 cm–1 and 2950–3800 cm–1 ranges, where peaks occur. Peak assignments are based up on those for liroconite (Makreski et al., Reference Makreski, Jovanovski, Pejov, Petruševki, Ugarković and Jovanovski2015). A Raman spectrum of liroconite from Wheal Gorland obtained from the RRUFF database (Lafuente et al., Reference Lafuente, Downs, Yang, Stone, Armbruster and Danisi2015), spectrum ID R050535 is also shown in Fig. 5. There is a close correspondence between kernowite and liroconite Raman spectra. Modes between 300 cm–1 and 800 cm–1 can be associated with vibrations of the AsO4 tetrahedron and Fe/Al and Cu octahedra. The strong doublet 854, 871 cm–1 in the kernowite spectrum (not resolved in the RRUFF liroconite spectrum) corresponds to the symmetric and antisymmetric stretching modes of the AsO4 tetrahedron.
Ambient unpolarised Raman spectrum of a single crystal of kernowite. The fits of the two- and four-peak models for the OH-stretching region are shown. The Raman spectrum of liroconite from the RRUFF database is also shown. See text for discussion.

The O–H stretching region (2950–3800 cm–1) comprises a broad feature centred on 3280 cm–1, and a sharp peak with a weaker shoulder at a higher wavenumber. The OH spectrum is fitted best with a four-peak model in which the broad feature comprises two similar peaks at 3224 cm–1 and 3363 cm–1, and two narrow peaks at 3470 cm–1 and 3557 cm–1. Following Makreski et al. (Reference Makreski, Jovanovski, Pejov, Petruševki, Ugarković and Jovanovski2015) we assign the two broad peaks to the two non-equivalent H2O groups, and the two narrow peaks to the two non-equivalent hydroxyl groups. The two narrow peaks are assigned to O–H vibrations of non-H2O hydroxyl groups. In addition to the broad modes centred on 3280 cm–1 (due to H2O), the RRUFF Raman spectrum of liroconite has a single narrow peak at 3518 cm–1, a value that lies between the wavenumber values of the two narrow peaks of kernowite.
Provisionally, we interpret the two narrow peaks of the kernowite Raman spectrum as being due to OH for the bridging configurations Cu–O(H)–Fe and Cu–O(H)–Al. The much lower intensity of the 3557 cm–1 peak compared with the 3470 cm–1 peak, is then consistent with the minor Al content of kernowite. Composition-sensitive vibrational frequencies for O–H groups are well-documented for many minerals, most notably amphiboles and micas. An alternative interpretation is that the two narrow OH modes are due to the two crystallographically non-equivalent O–H groups. However, this interpretation (1) assumes that there is no compositional effect; and (2) ignores the fact that O(H1)⋅⋅⋅O and O(H2)⋅⋅⋅O distances are similar (2.8 Å and 2.9 Å), i.e. the hydrogen bonds are likely to be of similar strength, implying similar bond-lengths/bond-strengths for the two O–H groups. However, we recognise that this point needs further study. Nonetheless, the wavenumber difference between the narrow peaks of kernowite and liroconite is clear and may be of diagnostic value in recognising Fe-rich and Al-rich crystals.
Discussion
Plumhoff et al. (Reference Plumhoff, Dachs, Benisek, Plášil, Sejkora, Števko, Rumsey and Majzlan2020) determined the structure of liroconite of composition Cu2Al(AsO4)0.86(PO4)0.14(OH)4⋅4H2O from Wheal Gorland in space group I2/c with the same unit-cell setting as I2/a [a = 12.643(1), b = 7.5684(7), c = 9.880(1) Å, β = 91.276(8)° and V = 945.1(2) Å3]. This liroconite is nearly identical topologically to liroconite with space group I2/a (Burns et al., Reference Burns, Eby and Hawthorne1991) and kernowite. Its hydrogen-bonding configuration (Table 6) is essentially analogous to that of kernowite, except for one H atom, their H2O(5), for which Plumhoff et al., found a very long associated OD⋅⋅⋅⋅OA distance of 3.47 Å. This H atom does not appear to be directed towards any plausible hydrogen-bond acceptor. The corresponding atom in kernowite (H4) shows a clear orientation towards oxygen OW1, thereby providing connectivity between the two OW1 H2O molecules. The OW1⋅⋅⋅OW1 distance in kernowite is 3.09 Å, compared with the corresponding O5⋅⋅⋅⋅O5 distance of 3.18 Å in liroconite reported by Plumhoff et al. (Reference Plumhoff, Dachs, Benisek, Plášil, Sejkora, Števko, Rumsey and Majzlan2020), which is almost the same as 3.17 Å of Burns et al. (Reference Burns, Eby and Hawthorne1991), who did not locate H atoms for their liroconite crystal. The shorter OW1⋅⋅⋅OW1 (O5⋅⋅⋅O5) distance in kernowite may be responsible for the formation of a more directional hydrogen bond for the H4 atom in this mineral compared with H2O(5) in liroconite. This subtle difference between the structures of kernowite and liroconite requires further elucidation.
An exploration of the extent of Al–Fe3+ solid solution and its structural systematics in liroconite–kernowite would seem to be worthwhile. Thus far, it appears that the compositions of natural liroconite and kernowite are binary with respect to Al and Fe and the intensity of green colouration is a reasonable indicator for samples worthy of further analysis. The substitution of P for As at the tetrahedral site is a further aspect of the structure that would benefit further study. In view of the success of Plumhoff et al. (Reference Plumhoff, Dachs, Benisek, Plášil, Sejkora, Števko, Rumsey and Majzlan2020) in synthesising liroconite crystals large enough for structure determination by single-crystal XRD, syntheses of a series of Al–Fe and As–P phases would seem to be worth undertaking in order to quantify the crystal-chemistry of the solid solution.
Acknowledgments
We thank Roy Starkey for clarifying information pertaining to the Sir Arthur Russell collection of British Minerals, Ed Loye for discussion and Callum Hatch and Tony Wighton of the NHM Preparation laboratories for creating the holotype probe blocks.
Supplementary material
To view supplementary material for this article, please visit https://doi.org/10.1180/mgm.2021.40