Introduction
The implementation of intensity-modulated radiation therapy (IMRT) for both static gantry and rotational delivery in conjunction with inverse planning has revolutionised modern radiotherapy. Since the introduction of the inverse planning concept by Brahme Reference Brahme, Roos and Lax1,Reference Brahme2 in the 1980s and the development of inverse planning as an optimisation problem by Webb, Reference Webb3 continuous advancements have been made in computer treatment planning system optimisation algorithms leading to incremental improvements in the quality and efficiency of the treatment planning process. Hussein et al. Reference Hussein, Heijmen, Verellen and Nisbet4 provided a comprehensive review of recent innovations in IMRT planning encompassing solutions offered by all the major vendors including knowledge-based planning and multi-criteria optimisation approaches. In addition to improvements in plan optimisation, automation of the planning process has been shown to improve overall plan quality leading to less inter-user variation as a result of user experience and expertise. Reference Heijmen, Voet and Fransen5-Reference Giaddui, Bollinger and Glick7
The Philips Pinnacle3 treatment planning system’s (Philips Radiation Oncology Systems, Fitchburg, WI) approach to automated planning is the commercially available Auto-Planning (AP) software. The structure of the AP process, described in detail by Hazell et al., Reference Hazell, Bzdusek and Kumar8 begins with a template incorporating prioritised objectives for target volumes and organs at risk (OARs) that are specified by the user. The inverse planning software then generates a series of optimisation ‘pseudo’ structures that function to handle overlapping volumes as well as shape and control the dose distribution and fall-off. The last stage in the automated process is a series of iterative optimisation loops that fine-tune the plan to achieve a solution that fits the original goals defined by the user. The fine-tuning of the dose distribution in the final stage of the optimisation process creates additional pseudo structures outlining hot and cold regions and subsequently adjusts control point weightings and multi-leaf collimator (MLC) apertures in an effort to improve dose homogeneity in the target volume. Reference Xhaferllari, Wong, Bzdusek, Lock and Chen9 While this process results in better dose conformity and homogeneity within the target volumes, it has also the potential to increase the modulation within the plan leading to an increase in the complexity of plan delivery. Reference Rønn Hansen, Bertelsen and Hazell6,Reference Jurado-Bruggeman, Hernandez and Saez10
The benefits of AP for head and neck radiotherapy treatment planning, namely better OAR sparing for equivalent or improved target volume coverage, more consistency in plan quality and automated planning with minimal user intervention, have been described in a number of studies. Reference Rønn Hansen, Bertelsen and Hazell6,Reference Hazell, Bzdusek and Kumar8,Reference Krayenbuehl, Norton, Studer and Guckenberger11,Reference Gintz, Latifi and Caudell12 For prostate-only radiotherapy planned with volumetric-modulated arc therapy (VMAT), Nawa et al. Reference Nawa, Haga and Nomoto13 reported that in addition to improvement in the quality of treatment plans, AP also produced a more homogenous outcome when dealing with instances where anatomical structures (e.g. bladder and rectum) overlapped with the target volume. Utilisation of the AP software is widely reported across other anatomical sites including oesophagus Reference Li, Wang and Wang14 and breast Reference Marrazzo, Meattini and Arilli15 as well as applications for stereotactic body radiotherapy (SBRT) of the pancreas, Reference Cilla, Ia, niro and Romano16 lung Reference Duan, Gan and Wang17 and liver. Reference Gallio, Giglioli and Girardi18
In this study, we evaluate the use of AP for prostate and prostate bed cases with or without pelvic lymph node irradiation. IMRT and VMAT plans generated with the AP tool are compared to plans created under the conventional Pinnacle3 inverse planning platform. A comprehensive analysis of target volume coverage, OAR doses and metrics related to plan quality and complexity are presented.
Methods and Materials
Patient cohort
The patient cohort for this study consisted of a randomly selected sample of 30 patients previously treated with IMRT. Of these 30 patients, 10 had radiotherapy to the prostate with inclusion of the seminal vesicles in the primary target volume (PTV), and 10 had radiotherapy to the prostate, seminal vesicles and pelvic lymph nodes. In addition to the 20 intact prostate cases, a further 10 prostate bed cases (5 treating the prostate bed alone and 5 incorporating pelvic lymph nodes) were included in the study. The dose prescribed to the primary PTV was 78 Gy in 39 and 66 Gy in 33 fractions for the intact prostate and prostate bed, respectively. An integrated dose of between 50 and 54 Gy was delivered to a secondary PTV for patients receiving pelvic lymph node irradiation. For plan comparison and analysis, the cohort was divided evenly into two groups: those with a single PTV and those with dual PTVs of differing dose prescriptions.
Planning and dosimetric end points
The 30 original patient cases had been planned and treated with IMRT. For the study, three additional plans were created for all patients retrospectively, one using the conventional inverse planning platform for VMAT delivery and the other two plans utilising the AP tool for IMRT and VMAT, respectively. All plans were created in Pinnacle3 v14.
AP technique templates had previously been developed locally for IMRT and VMAT prostate treatment with separate techniques for single and dual dose level PTVs. The development of these techniques was performed on a different patient cohort to the ones presented in this study. The aim with all AP technique templates was to produce a class solution that achieved all dosimetric goals specified within the technique ‘scorecard’ with minimal or no user intervention. The scorecard tool represents a summary of the target volume and OAR dose goals required for each plan based on local protocols. In cases where modification of the plan was required subsequent to the initial AP optimisation, a small adjustment to the dose or relative weighting of existing optimisation objectives was performed prior to a rerun of the optimiser, a process referred to as a ‘warm-start’. All plans in the study were reviewed by a radiation oncologist to confirm their suitability for clinical treatment.
Minimum requirement for dose coverage of the PTV was greater than 98% of the target volume encompassed by 95% of the prescribed dose. Dose limits placed on OARs were taken from local protocols based on the NSW Cancer Institute eviQ guidelines. 19 These guidelines provide evidence-based information sourced from a database of peer-reviewed publications such as QUANTEC Reference Bentzen, Constine and Deasy20 as well as from clinical trial protocols. Dose constraints on the rectum included V 75Gy < 10 %, V 70Gy < 20 %, V 60Gy < 30 % and V 40Gy < 60 %, whilst for the bladder the constraints included V 50Gy < 50% and V 40Gy < 60%. The femoral heads were limited to V 45Gy < 60 % and V 35Gy < 100%. For the patients with pelvic lymph node irradiation, a bowel bag contour and planning at risk volume (PRV) were generated based on Radiation Therapy Oncology Group (RTOG) guidelines. 21 Dose to the bowel bag PRV was limited to V 45Gy < 195 cm3.
Plan comparison and analysis
Plans generated with the AP software were compared to those developed with the conventional inverse planning platform in Pinnacle3. The nomenclature used to distinguish the delivery techniques and optimisation method are c-IMRT, AP-IMRT, c-VMAT and AP-VMAT with the prefix ‘c’ indicating plans created with the conventional inverse planning platform and ‘AP’ for plans generated with the AP tool. Dose–volume histogram (DVH) data for each plan was exported from Pinnacle3 and analysed with the DVHmetrics library 22 in the R statistical analysis package. 23 The evaluation was not limited to dose–volume statistics for target volumes and OARs, with incorporation of a range of metrics to assess plan quality and uniformity across all plans within each patient cohort. This included the conformity index (CI) calculated as the quotient of the volume encompassed by the 95 % of prescription isodose line and volume of the PTV, that is, CI = V 95%/V PTV, as well as the homogeneity index as defined by The International Commission on Radiation Units and Measurements (ICRU) Report 83, Reference Gregoire, Mackie and De Neve24 HI = (D 2% - D 98%)/D 50%. Lastly, the total number of beams, beam segments and MUs contained in each plan were also recorded.
Plan complexity
A comparison of plan complexity for AP plans and plans optimised with the conventional platform was calculated using the modulation complexity score (MCS) formalism described by McNiven et al. Reference McNiven, Sha, rpe and Purdie25 for IMRT and later adapted by Masi et al. Reference Masi, Doro, Favuzza, Cipressi and Livi26 for VMAT delivery. The formalism incorporates MLC aperture openings, leaf travel and segment weighting to produce a single score designed to indicate the relative complexity of a plan. The MCS value ranges from 0 to 1, with lower MCS values representing a higher degree of modulation within a plan and therefore more complexity.
Statistical analysis
Statistical significance in the metrics used to compare plans generated with and without AP was assessed using the Wilcoxon signed-rank test. In this study, a p-value of <0·05 was considered statistically significant.
Results
A summary of the results comparing plans generated with the conventional inverse planning platform and those with AP for both IMRT and VMAT techniques is provided in Table 1. The table separates the data between the two patient cohorts, single PTV and dual PTVs of differing dose levels.
Summary of mean (±S.D.) doses to PTVs and OARs, complexity (MCS), total MU and number of segments (SEGS) presented as a comparison between plans created with conventional inverse planning (c-IMRT and c-VMAT) and those generated with auto-planning (AP). p-values are based on the Wilcoxon signed-rank test. Table separated into two sections: plans with a single dose level and plans with two dose levels incorporating pelvic lymph node irradiation.

a Mean value based on n = 10 instead of n = 15 as the prostate bed prescription is less than the OAR dose metric.
Single dose level cohort
In the single dose level cohort, AP achieved comparable dose coverage of the PTV to plans created with the conventional inverse planning platform for the respective delivery techniques. The AP plans also showed a small but consistent increase in dose within the target volumes as indicated by the median (D 50%) and near-maximum (D 2%) dose metrics.
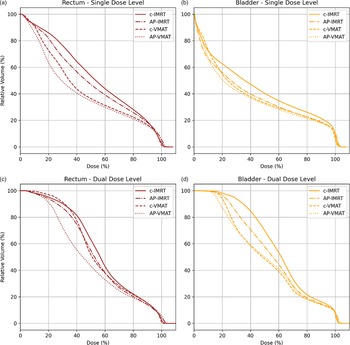
More distinguishable differences between the plans were observed in the OAR doses than the target volumes. For the rectum, Figure 1a demonstrates the improvement in OAR sparing achieved with AP through the separation of the DVH curves for both IMRT and VMAT plans, particularly in the lower dose range. In the cases planned with IMRT, AP-IMRT plans saw a reduction from 49·4 % to 43·6 % in the mean rectum V40Gy value (p = 0·03). For the bladder, the reduction in OAR sparing in AP-VMAT plans was less pronounced (Figure 1b) with the greatest benefit observed in the AP-IMRT plans resulting in a mean reduction in V50Gy by 4·2 % and V40Gy by 4·8 % (p < 0·01), respectively.
Mean DVH curves incorporating all four planning approaches for (a) rectum in the single dose level patient cohort; (b) bladder in the single dose level patient cohort; (c) rectum in the dual dose level patient cohort and (d) bladder in the dual dose level patient cohort. The prefix ‘c’ indicates plans created with the conventional inverse planning platform and ‘AP’ for plans created with the Auto-Planning tool.

The plan quality and complexity metrics used to compare the plans demonstrate that for IMRT, AP-IMRT plans typically delivered more MU, had an increase in HI within the target and produced a higher degree of modulation based on the MCS. The combination of these parameters also saw a large improvement in the conformity of dose to the target as measured by the CI. For those planned with VMAT, the number of MU, CI and HI was comparable regardless of whether AP was used. However, a point of difference was observed in the MCS scores for AP-VMAT plans suggesting that they contained less modulation and complexity than c-VMAT plans. This is most likely attributed to the shorter arc length used in the AP technique template.
Dual dose level cohort
The rectum doses in the dual dose level cohort (Figure 1c) are analogous with the single dose level DVH curves with improved sparing observed at lower doses. For plans created with VMAT, the AP-VMAT plans showed statistically significant lower rectum doses by 2·0, 2·7 and 7·3 % for V 70Gy, V 60Gy and V 40Gy, respectively. Substantial improvement in bladder sparing was found in the AP-IMRT plans resulting in a mean reduction in V50Gy by 4·7 % (p ≤ 0·01) and V40Gy by 11·3 % (p < 0·01) which can be observed in the separation of the DVH curves in Figure 1d. Similar trends are observed in the mean DVH curves for the other OARs such as the femoral heads and bowel bag PRV, with AP offering some amount of improvement in OAR sparing when compared to non-AP plans. Mean DVH curves for the left and right femoral heads as well as the bowel bag PRV can be viewed in the supplementary material in Figures S1(a-d) and S2, respectively.
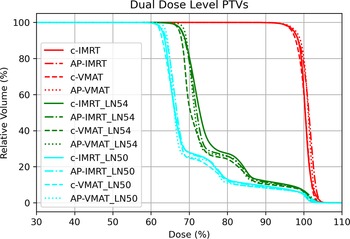
Consistent with the single dose level cohort, AP achieved comparable dose coverage of the primary PTV with a small increase in the median dose inside the target. However, in the AP-VMAT plans, a notable improvement in dose coverage of 0·8 % (p < 0·01) was produced in the mean V95% value for the lower dose pelvic lymph node PTVs when compared to those produced with c-VMAT (Figure 2).
Mean DVH curves for the primary and lymph node PTVs in the dual dose level patient cohort for all four planning approaches. The prefix ‘c’ indicates plans created with the conventional inverse planning platform and ‘AP’ for plans created with the Auto-Planning tool. Two different prescription levels for the lymph nodes were present within the cohort, 54 Gy (LN54) and 50 Gy (LN50).

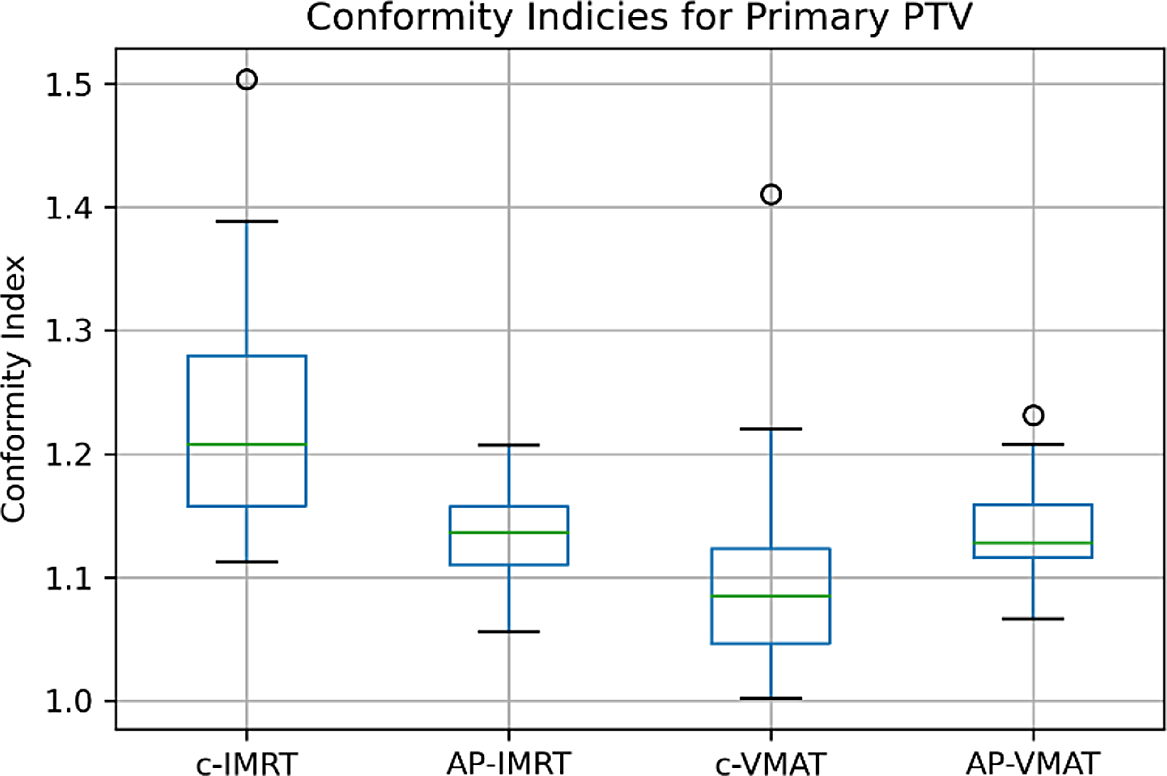
For the AP-IMRT plans, a 10 % decrease in the number of allowed segments set in the optimisation options meant that plans had less beam segments but often with more MU for the total plan when compared with the c-IMRT approach. This also led to an increased HI within the target and a higher degree of modulation based on the MCS. However, the resultant plans possessed significant improvement in dose conformity to the target volumes evident in the box and whisker plot of CI for the PTV in Figure 3. Note that Figure 3 contains the combined CI for the primary PTV across both patient cohorts, whereas the CI is tabulated separately for the primary and pelvic lymph node target volumes in Table 1.
Box and whisker plot of conformity index (CI) for the primary PTV in all four planning approaches. The prefix ‘c’ indicates plans created with the conventional inverse planning platform and ‘AP’ for plans created with the Auto-Planning tool.

Contrary to the findings in the single dose level cohort, AP-VMAT plans with dual dose levels had a higher number of MU, more complexity and a greater dose splash outside the PTV (larger CI value) when compared to c-VMAT plans. That said, improvement in the CI was observed for all plans created using a VMAT technique when compared with the original c-IMRT plans.
Discussion
The application of AP for IMRT and VMAT treatment planning resulted in superior dose distributions in terms of equivalent or slightly enhanced target volume coverage supplemented by improvement in OAR sparing when compared to the conventional inverse planning platform. In general, further OAR dose sparing was evident in the plans created using VMAT techniques when compared to IMRT. While this observation can be made, a direct comparison of delivery technique, that is, IMRT versus VMAT, was not the purpose of the study as the dosimetric benefits offered by VMAT are already well established in the literature. Reference Palma, Vollans and James27,Reference Kopp, Duff and Catalfamo28
Much of the improvement in the AP plans can be attributed to the progressive optimisation algorithm and its iterative nature, building in the capacity to identify and boost dose to regions of lower dose coverage in the target volume and at the same time drive down OAR doses. The c-VMAT plans did result in a lower CI compared to those planned with AP-VMAT, but this was likely a result of the statistically significant lower median dose (D 50%) within the PTVs suggesting that the c-VMAT plans were generally colder overall. The improved dose coverage produced by AP, particularly in the nodal PTV for AP-VMAT plans, as well as the more favourable OAR DVHs do come at a cost of a small but statistically significant increase in plan complexity based on the MCS for the dual dose level cohort cases. Examination into whether a small increase in plan complexity translates to a measurable difference in plan delivery, and dosimetry is beyond the scope of this study but may be explored in future work.
In addition to the benefits in plan quality, the fact that the AP tool generates plans from a preconfigured technique template also led to less variation between the patient plans in each cohort. This is evident in the lower standard deviation across most of the plan metrics analysed in Table 1 as well as the smaller spread in the range of the CI observed for AP plans in Figure 3. The class solution provided by the use of the technique templates also meant that a more standard approach was taken to the number of beams used for AP-IMRT plans, consistency in chosen collimator angle, and common arc trajectories for AP-VMAT plans. Of the 30 cases, a single optimisation of the AP-IMRT technique produced plans meeting all scorecard target volume and OAR objectives in 63 % of cases, whilst a subsequent warm-start on those plans falling short of the scorecard goals resulted in 87 % of plans fulfilling all dose metric requirements. Using the AP-VMAT template, the single optimisation success rate went up to 87 % and the subsequent warm-start led to 97 % of plans meeting all scorecard goals. The few cases where all planning objectives were unable to be met were usually due to a small patient bladder volume or significant overlap between an OAR structure and the PTV. In these instances, guidance on an appropriate compromise was provided by the radiation oncologist as to what was an acceptable concession in the final plan.
The limitations of this study are that it was limited to a 30 patient data set originating from a single institution, although it encompassed two radiotherapy centres that share common planning procedures and protocols. A larger sample size may yield more statistically significant findings for the dose metrics examined. Nevertheless, the benefits observed with the use of the AP tool in this study have seen the widespread adoption of AP in local radiotherapy treatment planning practice for a broad range of anatomical sites.
Conclusion
In this study, we have evaluated the application of the Pinnacle3 Auto-Planning software for both IMRT and VMAT treatment planning of intact prostate and prostate bed cases, with and without pelvic lymph node irradiation. Treatment plans generated with AP were found to produce comparable, or in some instances improved dose coverage of the target volumes compared with the same plans created using the conventional inverse planning platform. However, the primary benefit of AP was observed in the significant reduction in OAR doses, which is consistent with the outcomes reported for other anatomical sites such as head and neck. A small increase in plan complexity was observed amongst AP plans for cases with dual PTVs of differing prescription dose levels. The automated nature of the AP software led to more consistency in achievable dose and plan metrics between cases, effectively minimising variation in plan quality as a result of user expertise.
Acknowledgements
The authors would like to thank Dr Jose Cuenca from the Illawarra-Shoalhaven Local Health District (ISLHD) Research Central team for his advice on the statistical methods and analysis for this study.
Financial Support
This research received no specific grant from any funding agency, commercial or not-for-profit sectors.
Conflicts of Interest
The authors declare none.
Supplementary Material
To view supplementary material for this article, please visit https://doi.org/10.1017/S1460396921000327.