INTRODUCTION
In Ireland, agriculture is the largest single contributor of greenhouse gas (GHG) emissions, accounting for 0·320 of total emissions in 2011, followed by the energy (0·208) and transport (0·196) sectors (EPA 2013). The primary GHGs from agricultural production are methane (CH4) and nitrous oxide (N2O) with carbon dioxide (CO2) being a smaller contributor, primarily from the combustion of fossil fuels (EPA 2011). Of the emissions from agriculture, enteric fermentation, manure management and nitrogenous losses from agricultural soils represent 0·47, 0·28 and 0·20 of total GHG emissions, respectively (EPA 2011). The contribution of enteric fermentation to total agricultural emissions is due largely to the importance of livestock production, with the bovine population in Ireland exceeding the human population (Breen et al. Reference Breen, Donnellan, Hanrahan, Gillespie, Miller and O'Donoghue2010a). Approximately 0·90 of Irish farmers are engaged in beef and/or dairy cattle production (Hennessy et al. Reference Hennessy, Kinsella, Moran and Quinlan2012). Export markets are a critical outlet for Irish agricultural produce with c. 0·90 of beef and 0·80 of dairy produce exported (Breen et al. Reference Breen, Donnellan, Hanrahan, Gillespie, Miller and O'Donoghue2010a). As a result of increased awareness of global warming and carbon footprint by society and consumer preference for ‘low carbon-footprint’ food (Schulte et al. Reference Schulte, Lanigan and Gibson2011), it is important to quantify the carbon footprint of agricultural products.
Life-cycle assessment (LCA) is a method that evaluates the environmental impact of products and good practice guidelines have been developed by the International Organisation for Standardisation (ISO 2006). One of these environmental impact categories is Global Warming Potential (GWP) which is a relative measure of how much heat a GHG traps in the atmosphere. The GWP is typically reported in carbon dioxide equivalents (CO2e) that are based on the 100-year GWP of 25, 298 and 1 for CH4, N2O and CO2, respectively (Forster et al. Reference Forster, Ramaswamy, Artaxo, Berntsen, Betts, Fahey, Haywood, Lean, Lowe, Myhre, Nganga, Prinn, Raga, Schulz, Van Dorland, Solomon, Qin, Manning, Chen, Marquis, Averyt, Tignor and Miller2007). Other environmental impact factors used in LCA include eutrophication potential, acidification potential, land occupation and non-renewable energy use (Nguyen et al. Reference Nguyen, Hermansen and Mogensen2010). The result of an LCA study is reported in terms of relative impact per unit product, known as the functional unit (ISO 2006). A number of LCA assessments (Nguyen et al. Reference Nguyen, Hermansen and Mogensen2010; Peters et al. Reference Peters, Rowley, Wiedemann, Tucker, Short and Schulz2010; Roy et al. Reference Roy, Orikasa, Thammawong, Nakamura, Xu and Shiina2012) have been carried out on beef production and in most cases the GHG emissions are reported per unit (kg) of meat produced. Greenhouse gas emissions for beef production are also reported per unit of protein (Stewart et al. Reference Stewart, Little, Ominski, Wittenberg and Janzen2009), per ha, per year, per livestock unit (Foley et al. Reference Foley, Crosson, Lovett, Boland, O'Mara and Kenny2011), per head of livestock per day and per kg of hot standard carcass weight (Peters et al. Reference Peters, Rowley, Wiedemann, Tucker, Short and Schulz2010).
Roy et al. (Reference Roy, Orikasa, Thammawong, Nakamura, Xu and Shiina2012) showed that GHG emissions of beef (35·6 kg CO2e/kg meat) were greater than that of pork (6·9 kg CO2e/kg meat) or chicken (6·0 kg CO2e/kg meat). Nguyen et al. (Reference Nguyen, Hermansen and Mogensen2010) reported that an EU suckler cow calf–beef production system produced 27·3 kg CO2e/kg meat (carcass weight), while dairy calf to bull systems with a slaughter age of 12 and 16 months, and a dairy calf to steer system produced 16·0, 17·9 and 19·9 kg CO2e/kg meat (carcass weight), respectively. However, these studies (Nguyen et al. Reference Nguyen, Hermansen and Mogensen2010; Peters et al. Reference Peters, Rowley, Wiedemann, Tucker, Short and Schulz2010; Roy et al. Reference Roy, Orikasa, Thammawong, Nakamura, Xu and Shiina2012) and other studies evaluating GHG emissions (Casey & Holden Reference Casey and Holden2006; Stewart et al. Reference Stewart, Little, Ominski, Wittenberg and Janzen2009; Beauchemin et al. Reference Beauchemin, Janzen, Little, Mcallister and Mcginn2010; Pelletier et al. Reference Pelletier, Pirog and Rasmussen2010) only take account of GHG emissions and not the concomitant economic performance of the production systems under evaluation. By outlining both the economic and environmental benefits of reducing GHG emissions, the acceptability of mitigation measures to the farming community is likely to be much greater.
The relationship of beef output per ha and GHG emissions arising from variation in stocking intensities has been evaluated by a number of authors. Foley et al. (Reference Foley, Crosson, Lovett, Boland, O'Mara and Kenny2011) examined farm systems at low, moderate and high stocking rates and reported that GHG emissions were lowest at moderate stocking rates relative to low or high stocking rates. However, this analysis was confounded by differences in reproductive and animal live weight performance between scenarios. Increasing the fertilizer N application rates to facilitate higher stocking rates was also found to increase GHG emissions per kg of beef in the studies of Casey & Holden (Reference Casey and Holden2006) and White et al. (Reference White, Snow and King2010). However, these studies were also confounded by production systems differences (conventional, organic and environmentally friendly systems in the case of Casey & Holden (Reference Casey and Holden2006) and lowland and hill land systems in the case of White et al. (Reference White, Snow and King2010)). The results from White et al. (Reference White, Snow and King2010) showed that an alternative form of intensification can result in lower GHG emissions per kg product via the introduction of whole crop maize into the cropping and feeding system. In general, results appear to indicate that GHG emissions per kg of beef do not necessarily increase at higher stocking rates if nitrogen (N) application rates are not increased excessively.
The objective of the present paper is to describe the development of an LCA model of beef cattle production systems and to apply this model to evaluate the effect of stocking intensity of spring calving suckler cow herds on the GHG emissions profile and economic performance.
METHODOLOGY
In evaluating the GHG emissions from suckler beef production systems a hybrid modelling approach was adopted, similar to that reported by Foley et al. (Reference Foley, Crosson, Lovett, Boland, O'Mara and Kenny2011). The scenarios were first run in a bioeconomic farm systems model, the Grange Beef Systems Model (GBSM) (Crosson et al. Reference Crosson, O'Kiely, O'Mara and Wallace2006; Crosson Reference Crosson, Hopkins, Gustafsson, Bertilsson, Dalin, Nilsdotter-Linde and Spörndly2008), and the output of this model were used to specify the system characteristics required for the LCA model that evaluated the GHG emissions generated from the respective scenarios. Each stocking intensity scenario was examined separately.
Grange Beef Systems Model
The key data used to describe the individual scenarios to be examined were generated by the GBSM, which runs on a monthly time-step and assumes a steady-state system over a calendar year. Animal numbers and weights for each animal group (cows, calves, yearlings and 2-year olds) were specified. Default values for the proportion of grass and silage of the animals’ diet were specified on a monthly basis. Using the French net energy system (Jarrige Reference Jarrige1989) modified for Irish conditions (O'Mara et al. Reference O'Mara, Caffery and Drennan1997), animal feed requirements were calculated and grass and silage intake was calculated based on these. Supplementary concentrates were fed where the energy supplied in the forage diet was not sufficient to meet the target live weight gain. For all animal groups, estimations of live weights and kill out percentage at slaughter were taken from Murphy et al. (Reference Murphy, Drennan, O' Mara and Mcgee2008a, Reference Murphy, Drennan, O' Mara and Mcgeeb). The output data of the GBSM provided the required input data for the LCA model, which in turn estimated the GHG emissions associated with grass-based suckler beef production systems. The GBSM also provided financial performance data such as livestock revenues, variable and fixed costs of production and farm net margin. Land and labour costs were not included as the farm was assumed to be family run and all land is owned. European Union farm support payments were also excluded.
Life-cycle assessment model
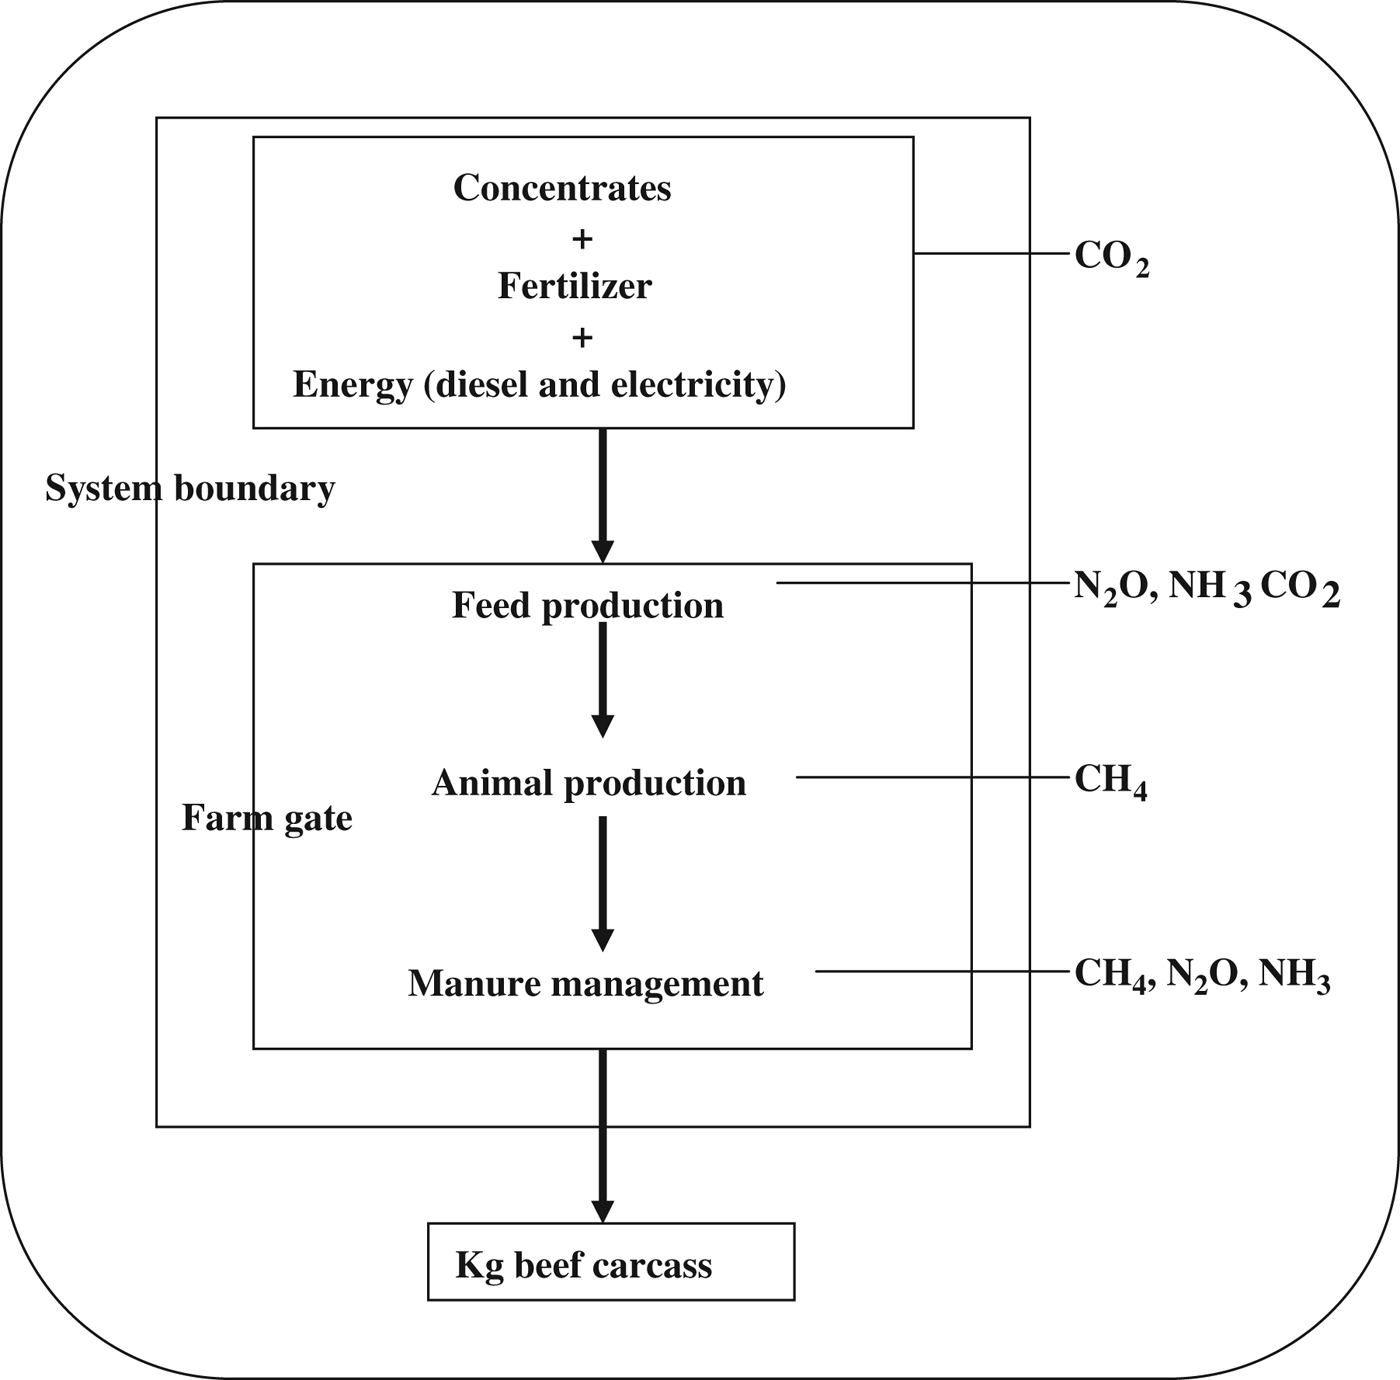
The objective was to determine the impact of stocking intensity and accompanying grassland management (as quantified by the grass utilization rate (kg consumed per kg grown)) on GHG emissions from Irish grass-based suckler beef production systems. The functional unit of the current study was 1 kg of beef carcass produced on the farm. The system boundary is illustrated in Fig. 1. Included within the boundary were direct GHG emissions generated on the farm and indirect GHG emissions. Indirect GHG emissions were those arising from the production of purchased inputs used on the farm and from indirect N2O emissions from nitrate leaching and ammonia (NH3) volatilization. Greenhouse gas emissions associated with activities after the farm gate (such as slaughtering, processing and distribution) were outside the boundary of the analysis. It was assumed that beef carcass takes the full GHG burden of the production system and therefore only one output (beef) and no co-products were defined for the farm system modelled. For this reason, no allocation (partitioning of inputs and outputs) was used in the current study.
Schematic diagram of life-cycle assessment model.

The model described in the current paper was developed using the software package SimaPro (PRe Consultants 2012). The input data (generated as outputs from GBSM as described previously) were imported into the SimaPro software in the form of a Microsoft Excel worksheet (Microsoft Corporation 2000). The model simulates production systems involving up to seven animal groups. The animal groups were suckler cows, male and female calves (<1-year old), male and female yearlings (animals between 1 and 2 years of age) and male and female adult cattle (>2 years of age).
Direct Emissions: To take account of the difference in CH4 emissions between cattle grazing forage in situ and cattle fed conserved forage diets (Yan et al. Reference Yan, Porter and Mayne2009), two alternative calculation methods were employed. A fixed emission factor was used when grazed grass was the main dietary component (0·065 of GEI (gross energy intake, mega joules (MJ)); IPCC Reference Eggleston, Buendia, Miwa, Ngara and Tanabe2006) or the equation of Yan et al. (Reference Yan, Agnew, Gordon and Porter2000) (DEI×(0·096+0·035S DMI/T DMI)–2·298(FL-1) where DEI=digestible energy intake, S DMI/T DMI=silage dry matter intake (DMI)/total dry matter intake; FL=feeding levels (metabolizable energy (ME) intake/maintenance ME requirement); CH4 energy output, MJ per day) when grass silage was the largest component of the diet. Nitrogen excretion was calculated according to Yan et al. (Reference Yan, Frost, Keady, Agnew and Mayne2007) and volatile solids production (organic material in livestock manure) was calculated according to IPCC (Reference Eggleston, Buendia, Miwa, Ngara and Tanabe2006). Assuming a dry matter (DM) content of 0·16 (Rotz et al. Reference Rotz, Mertens, Buckmaster, Allen and Harrison1999), faecal DM was converted to a fresh weight basis in order to calculate urine production (IPCC Reference Eggleston, Buendia, Miwa, Ngara and Tanabe2006). By relating the housing period to the excreta production profiles of the different beef production systems, excretory output was partitioned between that which requires storage and that which is deposited directly onto pasture. The slurry and manure application profile as described by Hyde et al. (Reference Hyde, Carton and Murphy2008) was used to calculate the default slurry and manure storage period and resulted in a storage period of 160 and 210 days for slurry and farm yard manure, respectively. The CH4 emissions from stored slurry, farmyard manure and excreta deposited at pasture were calculated based on methane conversion factors (MCFs) and maximum CH4 potentials (Bo) according to IPCC (Reference Eggleston, Buendia, Miwa, Ngara and Tanabe2006). Similarly, N2O emissions from stored slurry and farmyard manure, spreading of slurry and farmyard manure, direct deposition at pasture and application of chemical N fertilizers were based on IPCC (Reference Eggleston, Buendia, Miwa, Ngara and Tanabe2006).
In terms of silage effluent, the quantity produced was estimated according to the equation of Weissbach & Peters (Reference Weissbach and Peters1983), thus the height of the silage clamp was assumed to be 3 m and the DM of the silage 200 g DM/kg fresh weight. Silage effluent was assumed to be stored prior to disposal via land spreading. Methane emissions from silage effluent were calculated according to 0·165 kg CH4 per 10−6 Biological Oxygen Demand (BOD; where BOD is in units of mg/l; EPA 1990).
Greenhouse gas emissions from use (2·88 kg CO2e/l) and production (1·01 kg CO2e/l) of diesel were estimated according to Lothe et al. (Reference Lothe, Fuchs, Zeddies, Adger, Pettenella and Whitby1997) and Carbon Trust (2010), respectively. The processes of silage production and slurry spreading were assumed to have a diesel consumption requirement of 1·5 and 1·8 litres/t respectively, (Foley et al. Reference Foley, Crosson, Lovett, Boland, O'Mara and Kenny2011). The processes of silage feeding and silage loading and handling were assumed to have a diesel use requirement of 0·2 and 0·3 litres/t, respectively (Dalgaard et al. Reference Dalgaard, Halberg and Porter2001).
Indirect emissions: Indirect GHG emissions are those associated with inputs brought onto the farm and GHG emissions associated with nitrate leaching and NH3 volatization. Emissions associated with electricity and fertilizer production were calculated using emission factors of 0·601 kg CO2e/kW h (Howley et al. Reference Howley, O'Leary and O'Gallachoir2007) and 7·11 kg CO2e/kg N (Carbon Trust 2010), respectively. Greenhouse gas emissions from concentrate production are due to cultivation of the crop, drying, transportation to animal feed manufacturers, processing into a compound feed and transportation to the farm. A barley ration was assumed for the concentrate ration since this is typical for Irish cattle farms (Drennan et al. Reference Drennan, Mcgee and Keane2005; Murphy et al. Reference Murphy, Drennan, O' Mara and Mcgee2008b) and the emission factor used was 0·28 CO2e/kg DM fed (Ecoinvent 2010).
Nitrate leaching and NH3 volatilization are responsible for the production of indirect GHG emissions through fugitive N2O production (IPCC Reference Eggleston, Buendia, Miwa, Ngara and Tanabe2006). Ammonia emissions from direct deposition of excreta at pasture (0·20 kg NH3/kg N in slurry and farmyard manure applied to grassland) were according to IPCC (Reference Eggleston, Buendia, Miwa, Ngara and Tanabe2006). Ammonia emissions from slurry during deposition and storage (0·792 kg NH3/m2 slurry surface area) and from spreading (dependent on the season of application with emission factors of 0·925, 1·50 and 0·925 kg NH3/m3 of slurry applied for spring, summer and autumn applications, respectively) were according to McGettigan et al. (Reference Mcgettigan, Duffy and Hyde2009). Nitrous oxide production from NH3 was estimated according to IPCC (Reference Eggleston, Buendia, Miwa, Ngara and Tanabe2006). It was assumed that 0·1 of applied N was lost through leaching (McGettigan et al. Reference Mcgettigan, Duffy, Hyde, Hanley, O'Brien, Ponzi and Black2010) and that 0·0075 of leached N was converted to N2O (IPCC Reference Eggleston, Buendia, Miwa, Ngara and Tanabe2006).
The effects of stocking intensity on GHG emissions were of interest in the current study. Stocking intensity was based on the N content of excreta (i.e. organic N) from each animal subject to a maximum organic N level per ha. The maximum level of organic N permitted per hectare is regulated within the European Union by the European Communities (Good Agricultural Practice for Protection of Waters) Regulations, 2009 which sets an upper limit of 250 kg organic N/ha. In effect, this limits the number of animals that can be carried per ha; suckler cows and cattle >24 months of age contribute 65 kg organic N per head; cattle between 24 and 48 months of age contribute 57 kg of organic N per head; and cattle <12 months of age contribute 24 kg of organic N per head. The scenarios modelled were suckler beef cattle production systems finishing heifer progeny at 20 months of age and male progeny as bulls at 16 months of age or steers at 24 months of age. The general management of these production systems are described by Drennan & McGee (Reference Drennan and Mcgee2009). Briefly, the mean calving date was 15 March after which the calves suckle their dam for 8 months while at pasture. Following weaning, it was assumed that males finished as bulls were housed and offered a concentrate and silage diet until slaughter at 16 months of age with a carcass weight of 372 kg (Murphy et al. Reference Murphy, Drennan, O' Mara and Mcgee2008a, Reference Murphy, Drennan, O' Mara and Mcgeeb). Where males were finished as steers and females finished as heifers for slaughter, they were housed following weaning and offered grass silage ad libitum and 1 kg of concentrates daily. At the end of the first winter housing period steers and heifers were turned out to pasture for a second grazing season, where they grazed predominantly perennial ryegrass swards on a rotational paddock system. Heifers were housed in September of the second grazing season, offered a diet comprising grass silage ad libitum and 3 kg concentrate daily and slaughtered at 20 months of age. Similarly, steers were housed in November at the end of the second grazing season, offered a diet of grass silage ad libitum and 4 kg of concentrate daily and slaughtered at 24 months of age. Respective carcass weights for steers and heifers were 397 kg (Drennan et al. Reference Drennan, Mcgee and Keane2005) and 317 kg (Murphy et al. Reference Murphy, Drennan, O' Mara and Mcgee2008a, Reference Murphy, Drennan, O' Mara and Mcgeeb).
In the scenarios modelled, stocking intensity was increased by increasing the chemical N application rates on the pasture grazing area of the farm, thus reducing the land area needed to maintain a fixed cattle herd. At the highest stocking intensity (220 kg organic N/ha), grazed grass utilization rate was assumed to be 0·85 (i.e. 0·85 kg grass consumed per kg grown). As a result of lower grazing pressure, it has been shown that the utilization rate of grazed grass decreases at lower stocking intensities (Macdonald et al. Reference Macdonald, Penno, Nicholas, Lile, Coulter and Lancaster2001, Reference Macdonald, Penno, Lancaster and Roche2008; Kennedy et al. Reference Kennedy, O' Donovan, Murphy, O'Mara and Delaby2006, Reference Kennedy, O' Donovan, Murphy, Delaby and O'Mara2007). To model the effect of stocking intensity on the grass utilization rate a regression equation (y=0·0024x+0·276; R 2=0·872), where y represents the grass utilization rate (kg consumed per kg grown) and x represents the stocking intensity (organic N applied per hectare) was generated based on the data presented in the literature relating the stocking intensity of livestock production systems to the grass utilization rate (Authors own calculations based on data from National Farm Survey (Connolly et al. 2006); French et al. Reference French, O'Donovan, Horan and Shalloo2010; Baudracco et al. Reference Baudracco, Lopez-Villalobos, Romero, Scandolo, Maceil, Comeron, Holmes and Barry2011; Horan et al. Reference Horan, Mccarthy and Brennan2012).
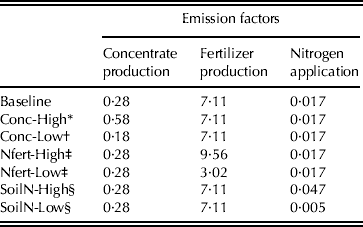
Given the differential importance of N fertilizer and concentrate feed inputs for steer/heifer and bull/heifer production systems, six scenarios to explore the effect of changes in the emission factors for these GHG emission sources were evaluated (Table 1). The emission factors used for sensitivity analysis were based on ranges available from the literature. Concentrate production emissions ranged from 0·18 kg CO2e/kg feed (Conc-Low; Carbon Trust 2010) to 0·58 kg CO2e/kg feed (Conc-High; Foley et al. Reference Foley, Crosson, Lovett, Boland, O'Mara and Kenny2011). Greenhouse gas emissions associated with N fertilizer use was disaggregated into production GHG emissions and direct GHG emissions from application to soils. The emission factors for N fertilizer production were taken from Wood & Cowie (Reference Wood and Cowie2004) and ranged from 3·02 kg CO2e/kg fertilizer (Nfert-Low) to 9·56 kg CO2e/kg fertilizer (Nfert-High). In the case of N fertilizer application emission factors, the values of IPCC (Reference Eggleston, Buendia, Miwa, Ngara and Tanabe2006) were applied and thus, ranged from 0·005 kg N2O/kg N applied (SoilN-High) to 0·047 (SoilN-low).
Scenarios and emission factors used for sensitivity analysis
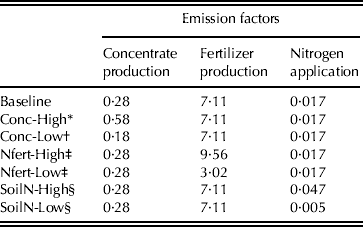
* ,† Concentrate production emissions (kg CO2e/kg feed) from Foley et al. (Reference Foley, Crosson, Lovett, Boland, O'Mara and Kenny2011; Conc-High) and Carbon Trust (2010; Conc-Low).
‡ Fertilizer production emissions (kg CO2e/kg N fertilizer) from Wood & Cowie (Reference Wood and Cowie2004).
§ Nitrogen application emissions (kg N2O/kg N applied) from IPCC (Reference Eggleston, Buendia, Miwa, Ngara and Tanabe2006).
RESULTS
Technical and economic performance
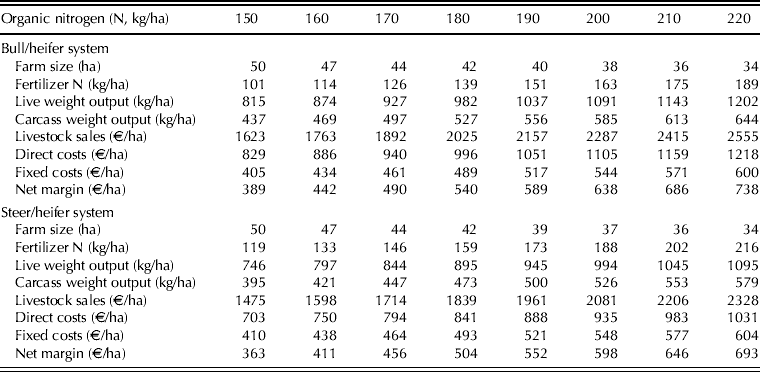
The technical and economic performance of bull/heifer and steer/heifer suckler beef cattle production systems with stocking intensity ranging from 150 to 220 kg of organic N per ha are summarized in Table 2. The amount of grazed grass, grass silage and concentrates required were 253, 106 and 62 t DM for the bull/heifer systems, respectively. Corresponding values for steer/heifer systems were 271, 106 and 34 t DM, respectively.
Effect of stocking intensity on the technical and economic performance of suckler calf to bull/heifer and steer/heifer beef production systems*
* Key assumptions. Beef price €3·75/kg carcass with variation among scenarios due to carcass grading and seasonality effects. Fertilizer CAN, €270/t. Urea €360/t. Concentrate (finishing ration), €210/t/DM. Bull system: suckler cows at calving, 60·4; calves weaned, 57·3; cattle finished, 28·4 heifers and 28·3 bulls. Steer system: suckler cows at calving, 52·6; calves weaned, 50·0; cattle finished, 24·8 heifers and 24·5 steers.
Stocking intensity increases were facilitated by higher chemical fertilizer N (inorganic) application rates, which increased by 85% on average as stocking intensity increased from 150 to 220 kg organic N. Correspondingly, the farm area needed was reduced by 32% for both bull/heifer and steer/heifer systems. Nitrogen application rates were also 15% greater for steer/heifer systems when compared with bull/heifer systems arising from the greater reliance on home-produced forage for the steer/heifer system. Output in terms of live weight, carcass weight and livestock sales were a function of stocking intensity and therefore, increased by 47% between the lowest and highest stocking intensities. Although variable and fixed costs also increased with stocking intensity, net margin per ha was considerably greater at the highest stocking intensity level simulated. Similarly, output costs and profitability were greater for bull/heifer systems than for steer/heifer systems. On average, net margin was 6% lower for steer/heifer systems relative to bull/heifer systems.
Greenhouse gas emissions profiles
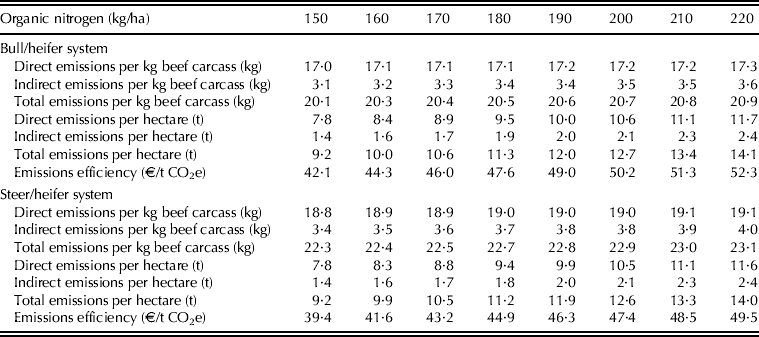
The effect of stocking intensity on both direct and indirect GHG emissions expressed per kg of beef carcass produced and per hectare for bull/heifer and steer/heifer production systems are summarized in Table 3. The lowest total GHG emissions per kg carcass and per hectare were found at the lowest stocking intensity for both bull/heifer and steer/heifer systems. As stocking intensity increased, GHG emissions per kg of carcass increased modestly with the highest stocking intensity being only 4% greater than the lowest stocking intensity for both bull/heifer and steer/heifer systems. When expressed per ha, GHG emissions increased considerably and were 52% higher at the highest stocking intensity relative to the lowest stocking intensity for both systems.
Effect of stocking intensity on greenhouse gas emissions per kg of beef carcass and per hectare for suckler calf to bull/heifer and steer/heifer beef production systems
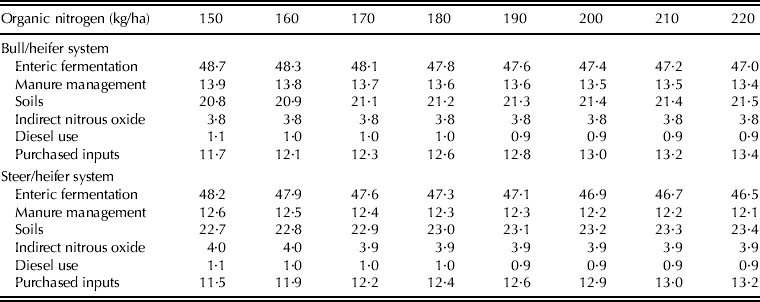
The contribution to the total GHG emissions of the various GHG emission sources for bull/heifer and steer/heifer production systems are detailed in Table 4. Across all scenarios, when stocking intensity increased, the contribution of enteric fermentation and manure management to total GHG emissions reduced slightly. This was primarily associated with increases in inorganic N fertilizer application rates and thus, accordingly, the contribution to total GHG emissions from soils, indirect N2O and purchased input emissions increased at higher stocking intensities. In particular, GHG emissions from purchased inputs increased by 14% at the highest stocking rate when compared with the lowest stocking rate. There was a lower GHG emissions contribution from manure management for steer/heifer systems relative to bull/heifer systems. However, the contribution from GHG emission sources that related to soils and indirect N2O emissions were greater for steer/heifer systems when compared with bull/heifer systems.
Effect of stocking rate on the percentage of the total contribution to the total greenhouse gas emissions for suckler calf to bull/heifer and steer/heifer beef production systems
Emissions efficiency
To relate profitability (net margin, €) to GHG emissions (t CO2e), the emissions efficiency (€/t CO2e; Foley et al. Reference Foley, Crosson, Lovett, Boland, O'Mara and Kenny2011) of the alternative scenarios were quantified. Emissions efficiency increased with increasing stocking intensity (Table 3); however, there was a diminishing returns response such that the incremental increase was greater at lower stocking intensities than at higher stocking intensities. Emissions efficiency was greater for bull/heifer systems relative to steer/heifer systems.
Sensitivity analysis
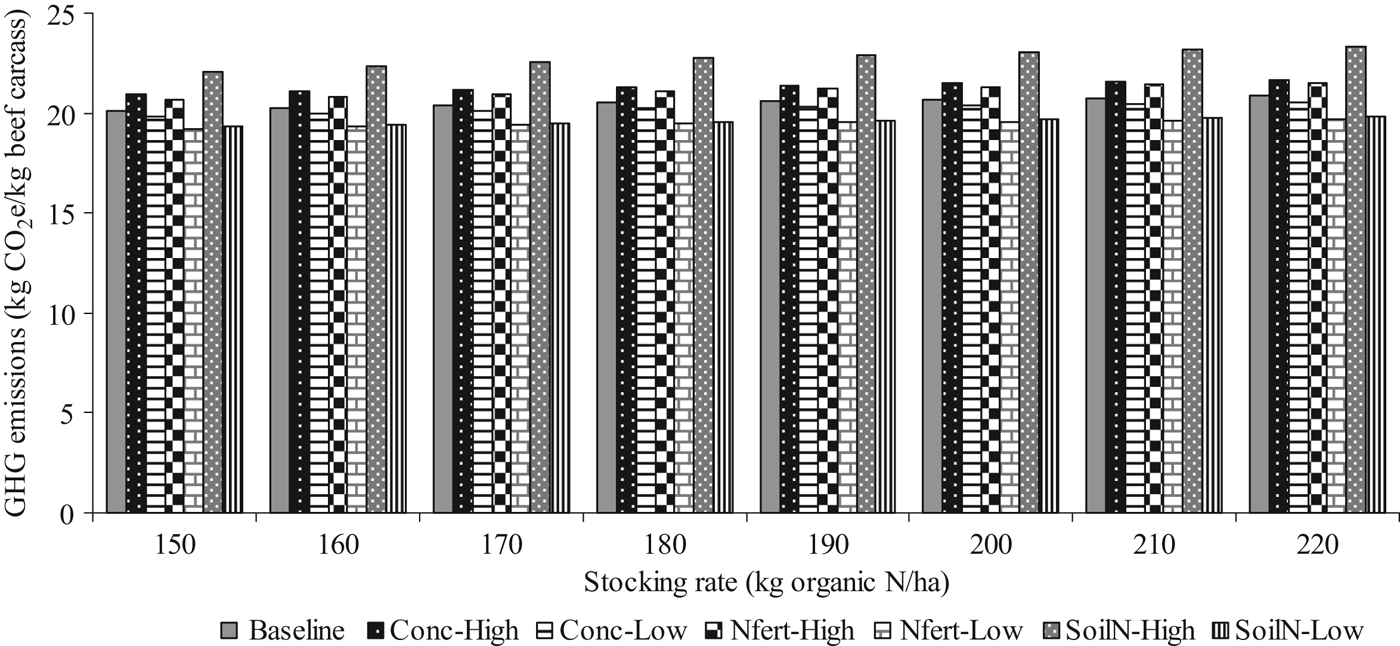
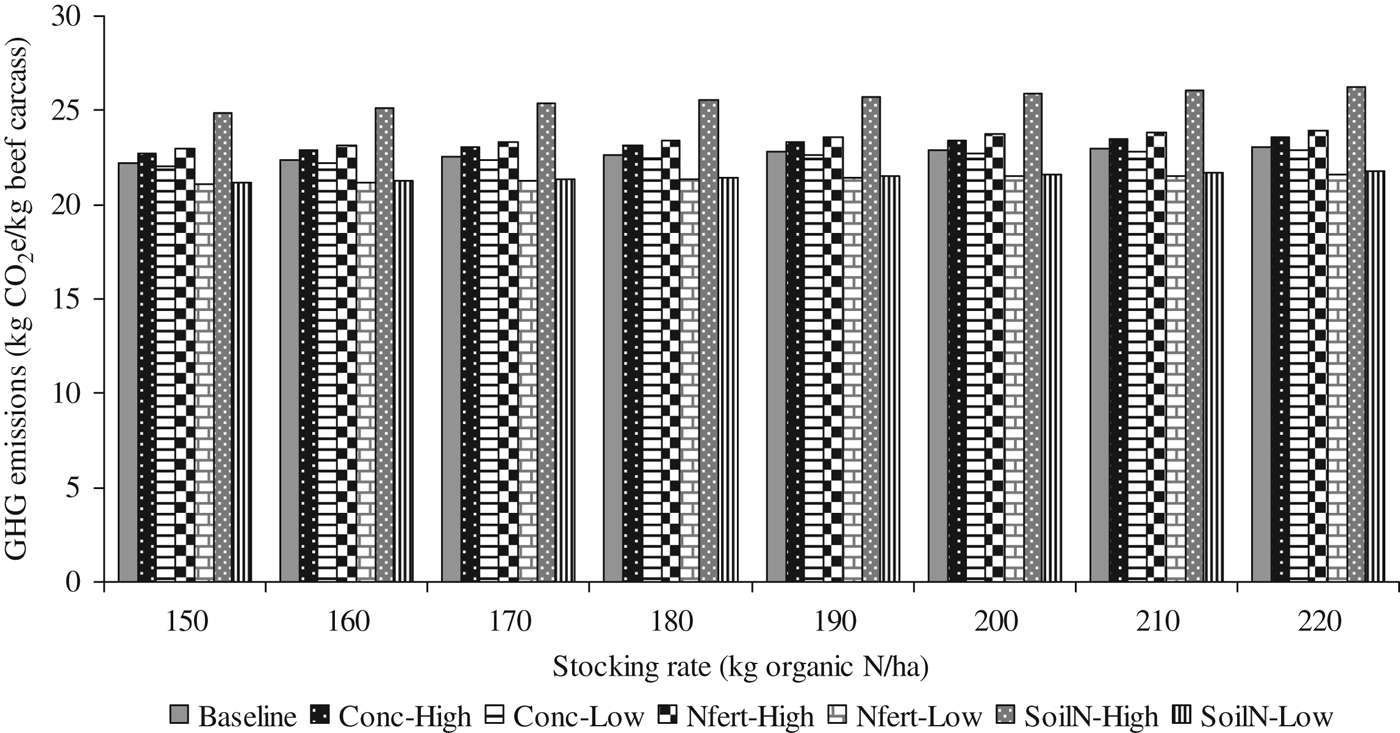
The N application emission factor had the largest impact, with total emissions increasing on average by 11 and 13% for bull/heifer (Fig. 2) and steer/heifer (Fig. 3) systems, respectively, for the SoilN-High scenario relative to the baseline scenario. Corresponding increases for the Conc-High and Nfert-High scenarios were 4 and 3%, respectively, for the bull/heifer system and 2 and 3%, respectively, for the steer/heifer system. The reductions in GHG emissions for the low emission factor scenarios were more modest and were similar for bull/heifer and steer heifer systems, being 1, 5 and 5% lower for Conc-Low, Nfert-Low and SoilN-Low, respectively. The increase in GHG emissions as stocking rate increased was similar for each scenario. The greatest reduction was for the Nfert-Low scenario, where the increase in GHG emissions was reduced to 2%. The greatest increase was for the SoilN-High scenario where the increase in GHG emissions was increased to 6%. The effects were similar for bull/heifer and steer/heifer systems.
Impact of stocking intensity and varying emission factors for concentrate and fertilizer production and for direct nitrous oxide emissions from agricultural soils on the greenhouse gas emissions from suckler calf to bull/heifer beef production systems. See Table 4 for key to scenarios.
Impact of stocking intensity and varying emission factors for concentrate and fertilizer production and for direct nitrous oxide emissions from agricultural soils on the greenhouse gas emissions from suckler calf to steer/heifer beef production systems. See Table 4 for key to scenarios.
DISCUSSION
Greenhouse gas model
In the current study, an LCA model was developed to evaluate GHG emissions from Irish suckler beef farms. An LCA of red meat production in Australia (Peters et al. Reference Peters, Rowley, Wiedemann, Tucker, Short and Schulz2010) showed that farm-level emissions were responsible for the largest proportion of the total burden compared with feedlot and, therefore, the approach taken in the present study was to evaluate GHG emissions up to the farm gate. The results are in agreement with previous studies (Crosson et al. Reference Crosson, Shalloo, O'Brien, Lanigan, Foley, Boland and Kenny2011) in that enteric fermentation was the principle contributor to GHG emissions. Emissions associated with manure management and soils, which include both CH4 and N2O sources, are other main contributors to the GHG profile on beef farms (Nguyen et al. Reference Nguyen, Hermansen and Mogensen2010). On average, 35% of the emissions were associated with manure management and soils in the scenarios analysed in the present study.
Owing to variations in methodology and production systems, comparison of modelling studies can prove difficult (Crosson et al. Reference Crosson, Shalloo, O'Brien, Lanigan, Foley, Boland and Kenny2011). Nevertheless, the results of the current study can be compared with those obtained by Foley et al. (Reference Foley, Crosson, Lovett, Boland, O'Mara and Kenny2011) who reported total emissions per kg of beef carcass ranging from 19·7 to 22·0 for moderate and intensive bull and steer production systems based on research farm production systems. The moderate bull system in the study of Foley et al. (Reference Foley, Crosson, Lovett, Boland, O'Mara and Kenny2011) and the 170 kg organic N per ha in the bull/heifer system of the present study are similar in stocking intensities; however, in the Foley et al. (Reference Foley, Crosson, Lovett, Boland, O'Mara and Kenny2011) study emissions were 1·5 kg CO2e per beef carcass lower. This is due to the fact that fertilizer N applied and concentrates purchased in the analysis of Foley et al. (Reference Foley, Crosson, Lovett, Boland, O'Mara and Kenny2011) were lower than in the present study. Casey & Holden (Reference Casey and Holden2006), who modelled an Irish suckler beef production system, reported average emissions of 11·3 kg CO2e/kg live weight which, if scaled to the functional unit used in the current study, would be 20·1 kg CO2e/kg beef carcass, and is therefore similar to the results in the current study.
Model application
The lower GHG emissions per kg beef carcass in the bull/heifer system compared with the steer/heifer system in the present study agree with studies of Casey & Holden (Reference Casey and Holden2006), Veysset et al. (Reference Veysset, Lherm and Bebin2010) and Foley et al. (Reference Foley, Crosson, Lovett, Boland, O'Mara and Kenny2011). Animal performance in terms of carcass gain per day of age is greater for bulls relative to steers (Steen Reference Steen1995; Clarke et al. Reference Clarke, Drennan, Mcgee, Kenny, Evans and Berry2009). This results in a shorter time to slaughter and therefore absolute enteric fermentation emissions, the most important GHG emission source, are lower (Foley et al. Reference Foley, Crosson, Lovett, Boland, O'Mara and Kenny2011). The higher performance of bull/heifer systems relative to steer/heifer systems also extends to economics with a mean difference in net margin of €36/ha in favour of bull/heifer systems across all scenarios in the current study.
Stocking intensity is the most important factor affecting production and profitability on farms (Fales et al. Reference Fales, Muller, Ford, O'Sullivan, Hoover, Holden, Lanyon and Buckmaster1995; Crosson & McGee Reference Crosson and Mcgee2011; Horan et al. Reference Horan, Mccarthy and Brennan2012) Higher stocking intensities due to increased fertilizer N/ha typically lead to greater GHG emissions (Casey & Holden Reference Casey and Holden2006; White et al. Reference White, Snow and King2010; Foley et al. Reference Foley, Crosson, Lovett, Boland, O'Mara and Kenny2011). Neufeldt et al. (Reference Neufeldt, Schafer, Angenendt, Li, Kaltschmitt and Zeddies2006) examined GHG emissions from a range of agricultural production systems in Southwest Germany and found that GHG emissions were highly correlated (R 2=0·85) with stocking rate. However, the stocking rate effect of these studies was confounded by a myriad of factors that affect productivity (e.g. reproductive performance, genetics, etc.) and thus, GHG emissions. Furthermore, there is a positive relationship between grass utilization rate and stocking rate on cattle farms. Shalloo et al. (Reference Shalloo, O' Donnell and Horan2007) reported that increasing stocking intensity will increase herbage utilization rate and have a positive effect on profitability. In modelling beef production systems with differing concentrate price and grass scenarios, an increase in gross margin of 11% as a result of a 15% increase in grass utilization was reported (Crosson et al. Reference Crosson, O'Kiely, O'Mara and Wallace2007). The present study demonstrated that where stocking intensity was higher, profitability was also greater with relatively modest (4%) increases in GHG emissions. The potential of grass-based cattle systems to reduce GHG emissions can be further exploited by extending the grazing season (Schulte & Donnellan Reference Schulte and Donnellan2012) and by managing sward quality (Wims et al. Reference Wims, Deighton, Lewis, O'Loughlin, Delaby, Boland and O'Donovan2010); these aspects of grassland management were not considered in the current analysis.
The global demand for meat is predicted to increase by 21% by 2020 relative to 2010 (OECD-FAO 2012). In the case of beef meat, the increase is projected to be 17%. There are a number of alternatives for the global cattle industry to meet these demands but in broad terms the two main options are to (1) increase the intensity of production, thus producing more beef on the current beef cattle areas or; (2) divert additional land resources to beef cattle production. An important aspect of the results presented in the current study is the capacity of grass-based beef cattle production systems to increase intensity of production and beef output for a fixed area of land with only small increases in GHG emissions intensity (CO2e/kg beef carcass). In addition to improvements in grassland management, further efficiency gains are possible if improvements in nutrient use efficiency were to be obtained. In particular, for pasture-based systems based on N fertilizer application, there are opportunities to reduce N2O emissions by improving fertilizer management (rate, source and timing of N fertilizer) and the use of nitrification inhibitors (de Klein & Eckard Reference De Klein and Eckard2008; Luo et al. Reference Luo, De Klein, Ledgard and Saggar2010). In the absence of a contraction in alternative agricultural production systems, which is unlikely based on global commodity demand projections (OECD/FAO 2012), the alternative approach to increase beef production by diverting more land resources to beef cattle production requires farmland expansion from non-agricultural land to pasture land to occur. Burney et al. (Reference Burney, Davis and Lobell2010) and Tilman et al. (Reference Tilman, Balzer, Hill and Befort2010) showed that intensification of cropland resulted in considerably lower emissions than cropland expansion. Similarly for beef cattle production systems it can be reasonably assumed that any increases in net global GHG emissions that arise due to intensification of production would be much lower than emissions from land use change.
Emissions efficiency in terms of € per tonne of CO2e suggests that there is lower profitability per unit of GHG emission at lower stocking intensities. Foley et al. (Reference Foley, Crosson, Lovett, Boland, O'Mara and Kenny2011) reported that in research farm systems at higher stocking intensities, higher GHG emissions are offset by higher profitability and, thus, GHG emission efficiency shows little change. The present study showed that economic returns, when expressed either in absolute terms or in terms of GHG emissions produced, are greater at higher stocking intensities. Commercial farm productivity in Ireland is much lower than that presented in the current paper, with an average stocking intensity of 71 kg organic N per ha (Hennessy et al. Reference Hennessy, Kinsella, Moran and Quinlan2012). Correspondingly, farm incomes were also very low at −€72/ha in 2011. As shown by Foley et al. (Reference Foley, Crosson, Lovett, Boland, O'Mara and Kenny2011), on average, emission efficiency is negative for Irish suckler beef cow farms. Therefore, Irish suckler beef farmers must firstly increase productivity to generate a positive financial margin per animal unit while reducing GHG emission per kg beef carcass. Provided the financial margin per animal unit is positive, margins per hectare can then be increased by increasing stocking rates. This would also capture the benefit of improving grass utilization rates with only small impacts on GHG emissions per kg beef carcass.
It is important to bear in mind that the boundary of the current analysis is at the farm gate. Therefore, the implications of increasing productivity at industry level were not taken into consideration. For the Irish beef sector Breen et al. (Reference Breen, Donnellan and Westhoff2010b) showed that, although profitability at farm level is often negative, the sector provides significant income at industry level both pre-farm gate from the services and supplies industries and post-farm gate from the meat processing, distribution and retail industries. The associated GHG emissions from these sectors are likely to be relatively modest (Peters et al. Reference Peters, Rowley, Wiedemann, Tucker, Short and Schulz2010) and therefore, the emissions efficiency value for the wider beef sector is likely to be much greater than that presented in the current study.
CONCLUSION
The current study shows that increasing stocking intensity via increased fertilizer N application rates and higher grass utilization rates lead to increased profitability on beef farms with only modest increases in GHG emissions when expressed per kg of beef carcass produced. However, when expressed per ha of farmland utilized, GHG emissions increased substantially. With increasing global demand for beef meat, the alternative pathways for the beef cattle sector are to intensify production or to expand farmland. Given the high carbon losses associated with farmland expansion, intensification is likely to yield lower GHG emissions per unit of additional beef carcass produced.
The authors gratefully acknowledge the financial support of Bord Bia (the Irish Food Board) for funding the research of one of the authors (A.M. Clarke).