INTRODUCTION
Biomass can be considered as a prominent option for affordable and sustainable energy production in the future, especially if the input/output energy balance ratio is readjusted with input minimization. One of the most important categories of biomass material is energy crops, which are high yielding crops grown specifically for energy applications (Biomass Energy Centre, 2007). Among the newly introduced annual energy crops able to produce stable amounts of biomass, fibre sorghum (Sorghum bicolor) has a significant yield potential, with energy destinations the production of electricity or heat through direct combustion of the biomass, or indirectly from gases and oils derived from it (Monti and Venturi, Reference Monti and Venturi2003).
Sorghum bicolor, a member of the Poaceae family, is of tropical origin, a C4 species of high photosynthetic efficiency under appropriate conditions of light and temperature, indicating a good potential for biomass production (Dolciotti et al., Reference Dolciotti, Marbelli, Grandi and Venturi1996). It is grown in 99 countries around the world on 44 million ha, mainly in poor and semi-arid areas, which are too dry for maize. Domesticated possibly in Ethiopia around 5000 to 7000 years ago, it has low fertilizer requirements (Cosentino et al., Reference Cosentino, Mantineo and Testa2012), making it ideal when used in a crop rotation scheme with its high biomass yields and dry matter accumulation rates. Previous research has shown that the crop is well adapted to warm southern European Union regions, especially in diverse geographic locations throughout Greece (Chatziathanassiou et al., Reference Chatziathanassiou, Christou, Alexopoulou and Zafiris1998; Dalianis et al., Reference Dalianis, Christou, Sooter, Kyritsis, Zafiris and Samiotakis1994). Sorghum, compared with other crops, is more environment-friendly (Dalianis et al., Reference Dalianis, Christou, Sooter, Kyritsis, Zafiris and Samiotakis1994), particularly because of its relatively low nitrogen needs (Duarte et al., Reference Duarte, Fernando, Guimaraes, Amparo, Alves and Santos Oliveira2000) and water requirements (Curt et al., Reference Curt, Fernandez and Martinez1995).
Land use planning involving sorghum cultivation for energy production is possible in infertile soils, or soils with declining fertility, especially under the growing concern that energy crops should be cultivated on abandoned agricultural or marginal lands in order to avoid food–fuel competition (Hattori and Morita, Reference Hattori and Morita2010) without need of large quantities of inorganic nitrogen (N) fertilization. The latter is responsible for a large share of the energy consumed by arable crops reaching 50% of the total energy input (Kuesters and Lammel, Reference Kuesters and Lammel1999; Reed et al., Reference Reed, Geng and Hills1986) unless nitrogen is provided through legume biological fixation. This alternative attracts increasing interest because of the depletion of fossil fuel and environment deterioration globally, as it is renewable, clean and environment-friendly compared with industrially produced N fertilizers (Giller, Reference Giller2001; Jensen and Hauggaard-Nielsen, Reference Jensen and Hauggaard-Nielsen2003); but the literature is scarce about the response of fibre sorghum to N provided through legume biological fixation as well as to organic N provided by legume crop residues.
Legume cover cropping or legume green manuring are widely accepted as sustainable practices due to yield advantage as well as high utilization efficiency of light, water and nutrients (Willey, Reference Willey1979) for subsequent crops; this has also gained the interest of researchers because these advantages are combined with improved reliability from season to season (Helenius, Reference Helenius1990), reduced inputs, better quality silage (Prithiviraj et al., Reference Prithiviraj, Carruthers, Fe, Cloutier Martin and Smith2000) and weed control (Bilalis et al., Reference Bilalis, Sidiras, Economou and Vakali2003). On sandy soils, the main aims of these practices are also combined with the effort to control soil erosion and maintain acceptable organic matter levels in the topsoil, especially when legumes are used as green manure (Kosmas et al., Reference Kosmas, Danalatos, Gerontidis and St2000; Salmeron-Miranda et al., Reference Salmeron-Miranda, Bath, Eckersten, Forkman and Wivstad2007). Legume crop residues are effective sources of N (Bremer and van Kessel, Reference Bremer and van Kessel1992; Haynes et al., Reference Haynes, Martin and Goh1993), and when released in synchrony of crop N demand, losses to the environment are minimized (Stute and Posner, Reference Stute and Posner1995). Legume residues generally have high N contents, and during the mineralization of leguminous materials up to 50% of N can be released within two months of incorporation into soil (Kirchmann and Bergqvist, Reference Kirchmann and Bergqvist1989). Faba bean seems to be an excellent candidate for a legume–fibre sorghum cover cropping system as it is grown during winter in subtropical and warmer temperate climates on residual moisture after crops such as fibre sorghum (Pala et al., Reference Pala, Saxena, Papastylianou, Jaradat, Muhlbauer and Kaiser1994).
In order to use cover crop plants efficiently under various cropping systems, it is essential to evaluate several eco-physiological traits such as dry matter production and nutrient-use efficiency of sequential crop (Daimon, Reference Daimon2006). Thus, the efficiency of legume contribution, such as faba bean, in these systems could be estimated both by biomass production and N use by the energy crop. Information on dry matter production and partitioning between various plant parts should permit better analysis and interpretation of results and also allow a better understanding of processes and resource exploitation for crop production (Williams et al., Reference Williams, Nageswara Rao, Dougbedji and Talwar1996). For N use, information is collected from N-use efficiency with two primary components: N-uptake efficiency and N-utilization efficiency (Moll et al., Reference Moll, Kamprath and Jackson1983). N-uptake efficiency refers to the quantity of N absorbed by the plant relative to the available soil N, while N-utilization efficiency quantifies the amount of total biomass produced per unit of N uptake. N uptake along the biological cycle reflects quite closely plant growth, since dry weight of biomass prevails over N concentration in influencing plant nutrient content. N-utilization efficiency is influenced by transportation, partitioning and remobilization of N within the plant or within the cell as well as by specific metabolic processes at cellular level (Masclaux et al., Reference Masclaux, Quillere', Gallais and Hirel2001).
At the same time, the cultivation of energy crops involves a careful consideration of other various implications: the crop should be economically appealing, environmentally safe, have a high energy efficiency and should contribute as CO2 sink to counterbalance earth's gas emissions in the atmosphere (Barbanti et al., Reference Barbanti, Grandi, Vecchi and Venturi2006), implications on which legume cover cropping-based farming systems tend to be more sustainable than fertilizer-based ones (Crews and Peoples, Reference Crews and Peoples2005).
Apart from sustainability in general, intensive farming on sandy soils requires careful planning and environmental safe management as it could generate high environmental risks. This is mainly because excessive N applications often result in nitrate leaching to deep soil layers due to intrinsic hydraulic characteristics (Sequi and Vittori-Antisari, Reference Sequi and Vittori-Antisari1989), causing ground water pollution with environmentally noxious chemicals. Therefore, quantification of plant uptake of soil mineral nitrogen (basic or control uptake) is important for understanding almost all aspects of nitrogen dynamics under all conceivable conditions as plant uptake is the major outflow from the soil mineral N pool (and the fraction taken up can be seen as an indicator of plant vitality, expressed as increased biomass productivity), whereas that not taken up represents potentially leachable N (Salmeron-Miranda et al., Reference Salmeron-Miranda, Bath, Eckersten, Forkman and Wivstad2007).
In this respect, the main objective of this study was the quantification of basic (control) N uptake, N-uptake efficiency and N-utilization efficiency, as well as total biomass production of Mediterranean land use systems, cultivated with fibre sorghum, pre-cropped with Vicia faba, either harvested (cover crop) or incorporated in the soil before the sowing of energy crop (green manure). The specific objectives were to (i) assist in proper N fertilization, especially of sandy soils, for economically viable, environmentally safe and sustainable production of energy crops; and (ii) determine whether a positive effect in nitrogen utilization efficiency (NUE) would be evident in such cover cropping systems in Greece and elsewhere. In addition, data from field experiments on the two farming systems were analyzed in combination with mean greenhouse gas emission factors described in the literature in an effort to obtain the integrated assessment of greenhouse gas emissions.
MATERIALS AND METHODS
Experimental sites
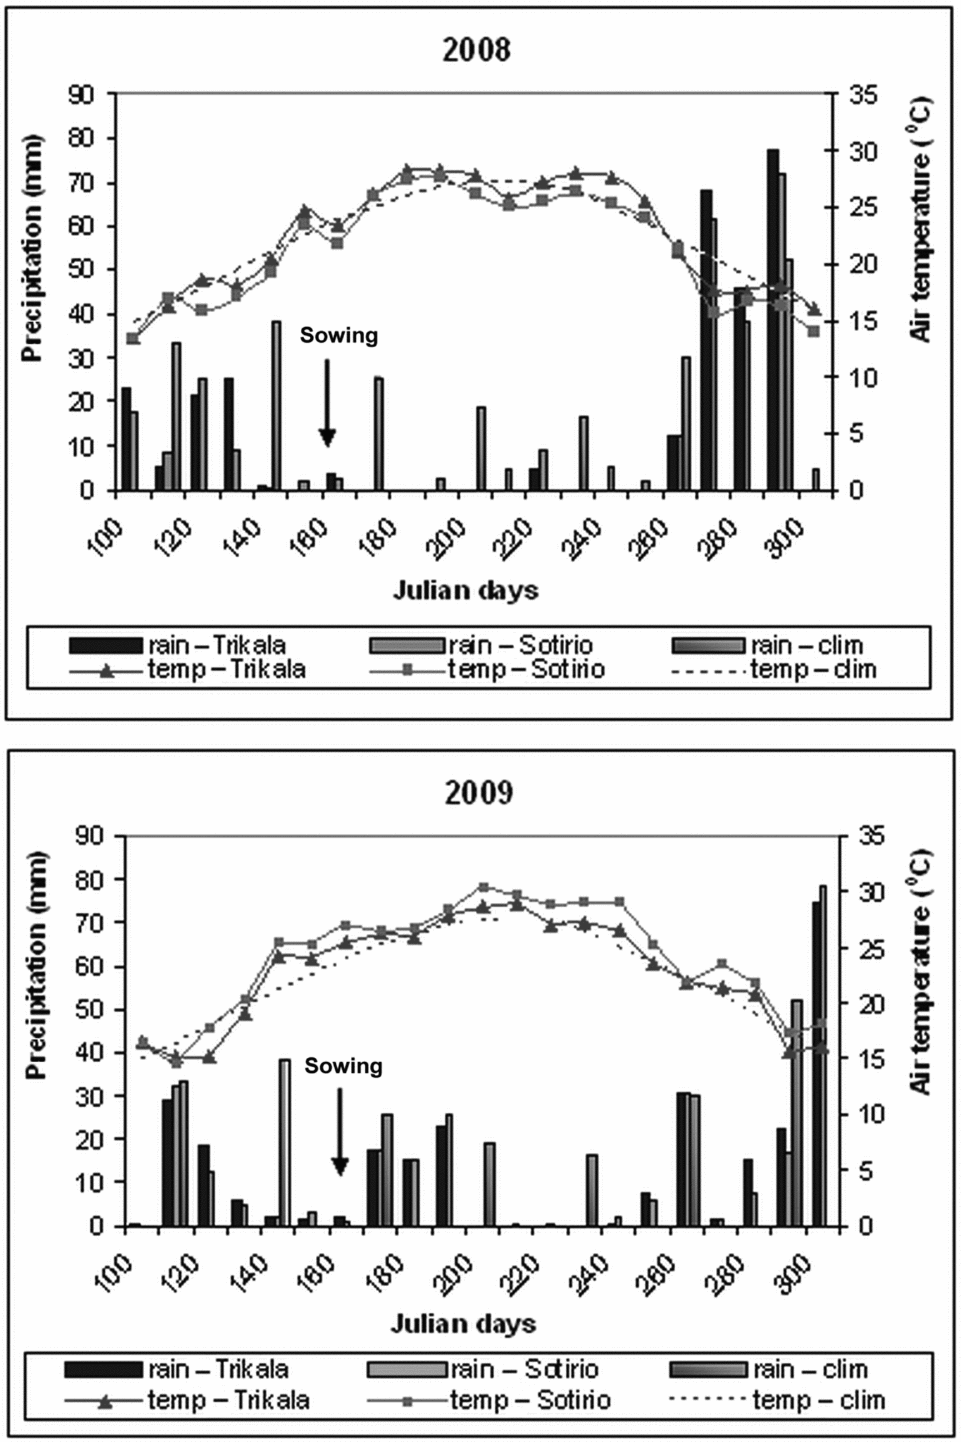
Field experiments involving the cultivation of Sorghum bicolor cv. H133, as energy crop, after the cultivation of Vicia faba cv. Extra Precoce, as cover crop, were carried out in central Greece from 2007 to 2009. The study area consisted of two experimental fields at two locations of the Thessaly plain with similar climate (Figure 1) but different soil characteristics. The first experimental field was located in the Trikala area (coordinates: 39o32′17.08″N, 21o46′19.17″E, elevation 120 m ASL). The soil was Typic Xerofluvent (Soil Survey Staff, 2010; USDA, 1975) with a calcareous sandy–clayey–loamy texture (average soil particle size distribution: clay 22%, silt 18% sand 60%), pH of 7.7 and organic matter content of 1.3% in the topsoil. The second field was located in the Sotirio area (coordinates: 39o30′02.85″N, 22o42′50.37″E, elevation 60 m ASL), and the soil was silty-clayey to clayey, classified as Vertisol (Soil Survey Staff, 2010; USDA, 1975) with the following average soil particle size distribution: clay 63%, silt 35%, sand 2%, and pH of 7.9 and 1.7% organic matter content in the topsoil. Both soils had a moderately shallow groundwater table, fluctuating from some 200 to 250 cm below the surface early in the spring to deeper layers later in the summer.
Temperature and precipitation (10-day mean values) occurring in the study areas during the growing period of sorghum in 2008 (above) and 2009 (below). Climatic air temperature (dashed line) and monthly total precipitation are also illustrated (National Meteorological Service, 1955–2005). Arrows indicate sowing dates of sorghum.

Field experiments and management
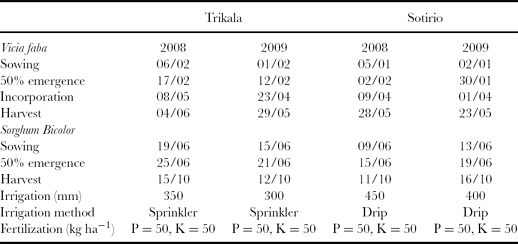
The experimental design was a factorial split plot with two factors: (1) nitrogen dressings (in the following four treatments: 0, 50, 100, 150 kg N ha−1 for sorghum), and (2) cover crop management (in the following three treatments: I = incorporated into the topsoil upon full flowering (flowers open on five racemes per plant), H = harvested before the sowing of the energy crop and C = control, no cover crop) applied in three replicates. All fertilization plots were maintained at the same spots during the entire experimental period. Planting arrangement was 75 × 20 cm for the energy crop and 25 × 15 cm for the legume crop. Plots with a size of 9 m2 consisted of four rows 0.75 cm apart and an average plant density of 10 plants m−2 for fibre sorghum. Control plots were left without legume cultivation during winter, while the same growing techniques and irrigation schedule were followed for all plots except for N dressings. In order to prevent N leaching (Mullen et al., Reference Mullen, Freeman, Raun, Johnson, Stone and Solie2003) fertilization was applied in two doses. The first was applied at sowing as basal dressing with 50 kg N ha−1 (nitrate form) in all plots except control plots, in which only P and K fertilization was applied. The second dose (ammonium form) was applied on the onset of vegetative phase of fibre sorghum, when plant height was approximately 50 cm. Sowing dates and other relevant agronomic data are summarized in Table 1. The amount of dry biomass of faba bean incorporated in the topsoil was calculated by destructive sampling (samples dried in a convection oven at 70 °C until constant weight) upon full flowering (flowers open on five racemes per plant) each year and reached a mean of 9–9.5 t ha−1 for both the regions and years. The energy crop was grown under optimum water and nutrient availability, and no macronutrient deficit or water stress was observed throughout the crop cycle.
Agronomic data for the two experimental areas and the two cultivation periods.
Measurements and calculations
At harvest period, all plots were sampled (1.5 m2 or the two middle rows of 1 m each) for plant dry weight, height and yield components. All plant samples were cut at 5 cm above soil surface and the below-ground fractions were left in the field. Dry matter of stems and leaves were determined by drying sub-samples in a convection oven at 70 °C until constant weight. The samples were then milled to a fine powder with a particle size of <1 mm to determine the total N content, using the standard Kjeldahl method (Nelson and Sommers, Reference Nelson and Sommers1973). N uptake was determined by multiplying the measured dry matter weights by their respective N concentrations.
Weather data for the Sotirio experimental field, such as incident solar radiation, air temperature, rainfall, wind speed and class-A pan evaporation rate, were recorded on hourly basis on an automatic meteorological station installed next to the experimental site; for the Trikala experimental field, actual weather data were obtained from the nearest meteorological station of the National Meteorological Service situated 200 m from the experimental field.
All measured and derived (from the calculations mentioned) data were subjected to analysis of variance (ANOVA) using SPSS18 software following the experimental design and the GLM method. As a test criterion for detecting differences between means, the LSD0.05 was used (Steel and Torrie, Reference Steel and Torrie1982). The results in this paper refer to the second and third year of the experiment as no significant differences aroused for the first year of the experiment, apparently due to residual N from previous applications over the years. The results are presented with the use of ‘three quadrant diagrams’ (Van Keulen, Reference Van Keulen1982; De Wit, Reference De Wit1992). With such diagrams, yield response to nutrient input can be visualized, while at the same time the ‘agronomic response’ (yield versus dose) is split up into its components: (l) the relation between uptake and yield, which is primarily determined by the physiology of the plant, and (2) the relation between supply (dose) and uptake, which is governed by processes in the soil.
Estimation of greenhouse gas emissions was made using a mean of 17.45 kg CO2 equivalents per kg N of synthetic N fertilizer (Adger et al., Reference Adger, Pettenella, Whitby, Adger, Pettnella and Whitby1997; Flessa et al., Reference Flessa, Ruser, Dörsch, Kampb, Jimenez and Munchb2002) to calculate the rate of kg CO2 equivalents per kg 103 of sorghum biomass produced for all treatments. The mean of 17.45 kg CO2 equivalents per kg N is much higher than the mean greenhouse gas emissions from the production of just 1 kg synthetic fertilizer N applied (5.5 kg CO2 equivalents) and results when emissions from fertilizer production and fertilized soils are considered together (as about 70% of these emissions originate from fertilized soils; Bouwman, Reference Bouwman1996). The following sources of greenhouse gas emissions were included in the estimation of total emissions: (1) N2O and CH4 emissions from soils; (2) N2O and CH4 emissions from mineral N fertilizers and the incorporation or mulching of crop residues; (3) CO2, N2O and CH4 emissions related to production of synthetic fertilizer; and (4) CO2, N2O and CH4 emissions related to consumption of fossil fuels (Flessa et al., Reference Flessa, Ruser, Dörsch, Kampb, Jimenez and Munchb2002). Emissions related to other agricultural inputs, such as pesticides and seeds, were not included in the analysis as these were considered to be negligible (Kramer et al., Reference Kramer, Moll and Nonhebel1999), nor emissions occurring from the production of investment goods (machines and buildings) or indirect N2O emissions (leaching of NO3− or NH3 volatilization), and it was assumed that soil organic carbon stocks remained unchanged.
RESULTS AND DISCUSSION
Weather conditions
In general, both study areas are characterized by a typical Mediterranean climate with hot, dry summers and cool, humid winters. Figure 1 illustrates the mean air temperature and precipitation for both experimental areas in 2008 and 2009. Mean air temperature reached a value of 26 °C and remained at this level during both the years despite higher fluctuation over climatic average in 2008. Total precipitation from April to October was 288 and 275 mm in 2008 and 267 and 256 mm in 2009 for Trikala and Sotirio respectively. During the vegetative phase of the crop, precipitation was higher in 2009, and as a result less irrigation was needed. In the experimental years, average relative humidity during the growing season was higher in the Trikala area, reaching an average of 62.5%, versus an average of 57.8% in the Sotirio area. Solar radiation was similar for both the study areas, and during the cultivation period of sorghum, reached higher values in 2008, with an average of 261.4 W m−2 over an average of 203.6 W m−2 in 2009.
Biomass production
Considerable increments in total dry biomass production as well as in total N uptake by the energy crop for both cover crop managements compared with mono-cropping were observed for fibre sorghum. The results allocated a significant effect (p < 0.05 and p < 0.01) of faba bean treatment in almost all cases (years and soil types) and for all N-fertilization levels. Significant differences (p < 0.05 and p < 0.01) in total dry biomass production as well as total N uptake were also observed between the N-fertilization levels, but no interactions of the faba bean treatment × N fertilization were found for any of the monitored parameters.
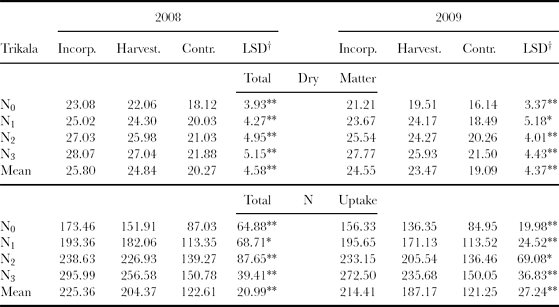
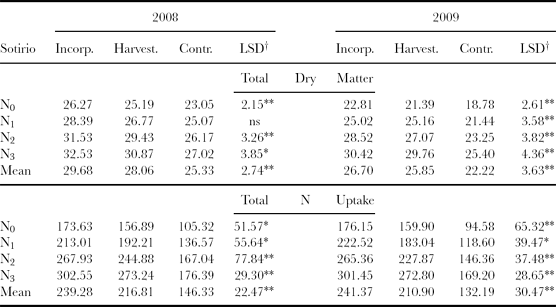
In the case of sandy soil (Table 2), total dry biomass productivity of plots with previous faba bean cultivation reached a mean difference of up to 5.5 t ha−1 compared with mono-cultivated in both the study years with an average of 25 t ha−1 total dm, which was considered satisfactory even for soils of high fertility in the study area. In the case of clayey soil (Table 3), the results also confirmed the positive effect of faba bean cover cropping, as total dry biomass productivity reached a mean of 29.7 t ha−1 and 28.1 t ha−1 when faba bean was used as green manure and as winter cover crop, respectively, and only 25.3 t ha−1 without previous legume cultivation in the second year of the experiment.
Total dry biomass (t ha−1) and total N uptake (kg ha−1) of fibre sorghum as affected by the three legume treatments (incorporated or harvested before sowing of energy crop or without previous legume cultivation) in the Trikala area.
N0: 0, N1: 50, N2: 100, N3: 150 kg ha−1.
†LSD: Least significant deference at p < 0.05*, or p < 0.01**.
Total dry biomass (t ha−1) and total N uptake (kg ha−1) of fibre sorghum as affected by the three legume treatments (incorporated or harvested before sowing of energy crop, or without previous legume cultivation) in the Sotirio area.
N0: 0, N1: 50, N2: 100, N3: 150 kg ha−1.
†LSD: least significant deference at p < 0.05* or p < 0.01**.
ns: not significant.
Despite smaller productivity in the third year (measured data of solar radiation and class-A pan evaporation rate (data not shown) suggest lower rates of photosynthesis for this year), a mean difference of 4.4 t ha−1 was found between rotation management practices, slightly smaller than the mean difference for the sandy soil, reflecting higher fertility status of specific soil type.
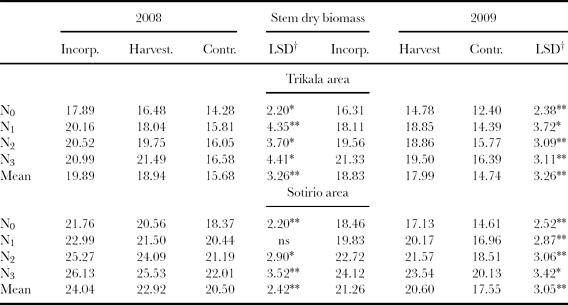
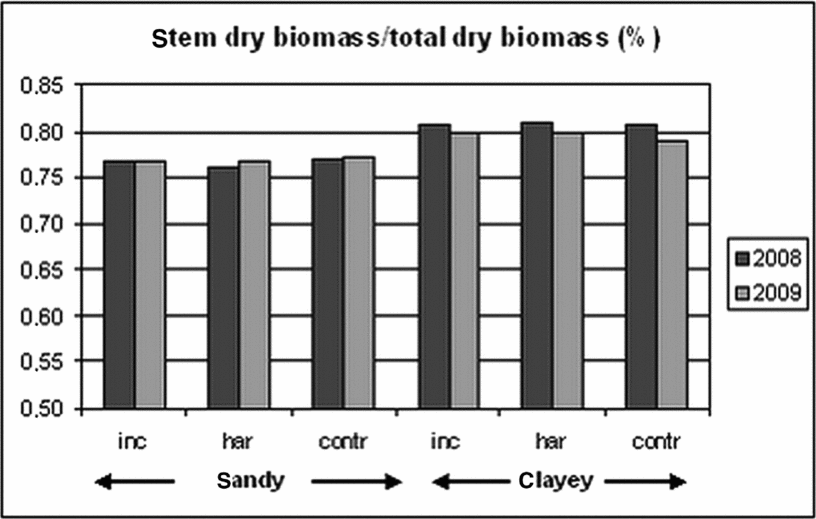
Similarly, stem dry biomass was significantly higher for legume rotation than in mono-cultivation, presenting similar mean differences (Table 4). However, the proportion of stem dry biomass to total dry biomass was not influenced by any of the treatments and reached values of 77% and 80% for the sandy and clayey soil respectively for both the years (Figure 2), suggesting that the factors year, N fertilization and legume treatment do not significantly affect biomass partitioning along crop cycle, which is in line with previous studies (Danalatos, Reference Danalatos1993; Masclaux et al., Reference Masclaux, Quillere', Gallais and Hirel2001).
Total dry stem biomass (t ha−1) of fibre sorghum as affected by the three legume treatments (incorporated or harvested before sowing of energy crop, or without previous legume cultivation) for both areas and years.
N0: 0, N1: 50, N2: 100, N3: 150 kg ha−1.
†LSD: least significant deference at p < 0.05* or p < 0.01**.
ns: not significant.
Stem dry biomass to total dry biomass proportion for both study areas and years.
Biomass yield and N availability
In fibre sorghum, growth and development of the plant have been categorized into two phases: vegetative and reproductive. In general, it is recognized that during the vegetative stage, sufficient leaf area, functional root systems and basic nutrients are necessary to support maximum biomass production. The amount of biomass accumulated by sorghum increases with greater N supply (Muchow, Reference Muchow1988), and variable responses to the application of N fertilizer have been observed in sorghum (e.g. Muchow, Reference Muchow1990; Myers, Reference Myers1978) due to differences in climatic, soil and genotypic factors across seasons and locations. Part of this yield variation is associated with differences in the capability of the soil to supply N and the efficiency of recovery of applied N fertilizer (Muchow, Reference Muchow1998).
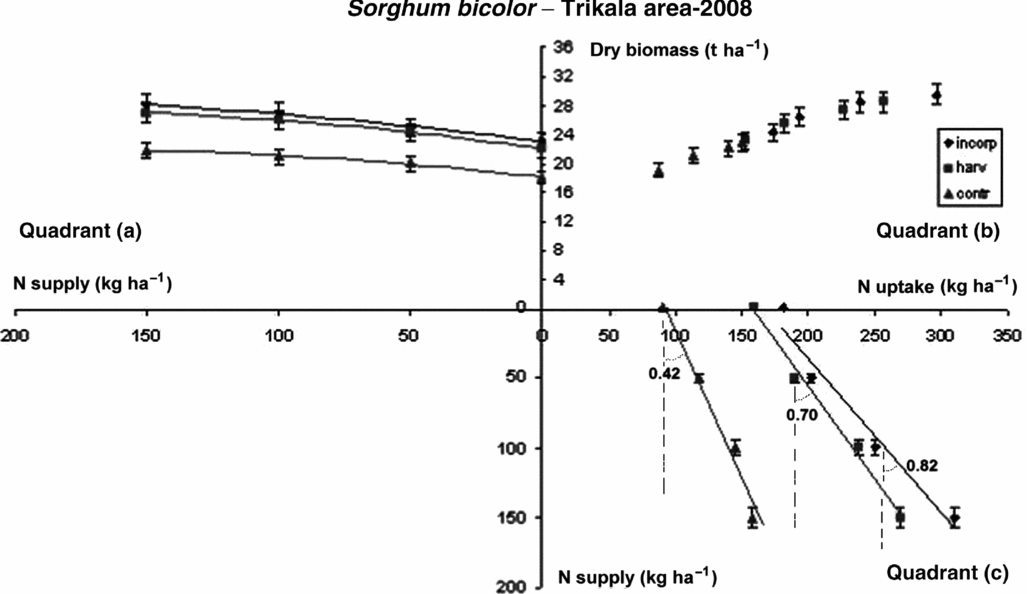
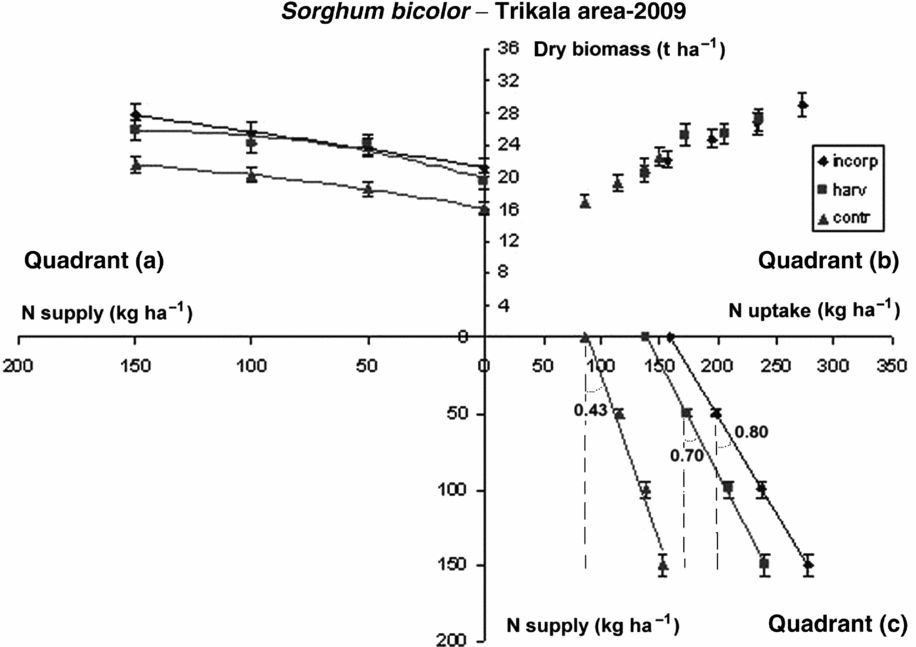
As illustrated in Figures 3 and 4, quadrant (a), the low fertility status of the sandy soil is clearly reflected by low control yields for both the years (viz. 18.1 and 16.1 t ha−1 total dry biomass in 2008 and 2009 respectively). Even when large amounts of N dressings (150 kg N ha−1) were applied, yield increase to a level equal to yield harvested from other experimental field in central Greece (Sotirio area) did not occur, as fibre sorghum total biomass reached a maximum of 21.9 t ha−1. As shown in quadrant (a) in Figures 3 and 4, yields were improved when faba bean was cover-cropped and fluctuated from 22 to 28 t ha−1 and 19.5 to 27.7 t ha−1 depending on N application for incorporating and harvesting the legume crop respectively. In the case of faba bean incorporation as a green manure, a remarkable yield increase was recorded in all the cases, and yields of 23.1 t ha−1 were possible under no fertilization (control), whereas maximum yields reached as much as 28 t ha−1 of total dry biomass.
Three-quadrant diagram of fibre sorghum biomass production response to N application and three faba bean cover cropping practices in Trikala area (central Greece) in 2008. Vertical bars indicate standard error of mean values.
Three-quadrant diagram of fibre sorghum biomass production response to N application and three faba bean cover cropping practices in Trikala area (central Greece) in 2009. Vertical bars indicate standard error of mean values.
Low control yields (viz. 23.1 and 18.8 t ha−1 for 2008 and 2009 respectively) under no N fertilization were also measured for the clayey soil. Upon modest fertilization of 50 kg ha−1 applied at sowing stage and 50 kg ha−1 at vegetative stage, yield fluctuated from 23.3 to 31.5 t ha−1 depending on legume treatment, with significantly (p < 0.05) higher yields for the cover cropping management in all the cases. A counterbalancing of yields of control plots did not occur even when 150 kg ha−1 N was applied, as total dry biomass reached a maximum of 27.0 t ha−1 for mono-cropped plots versus a maximum of 32.5 t ha−1 for plots with faba bean incorporation.
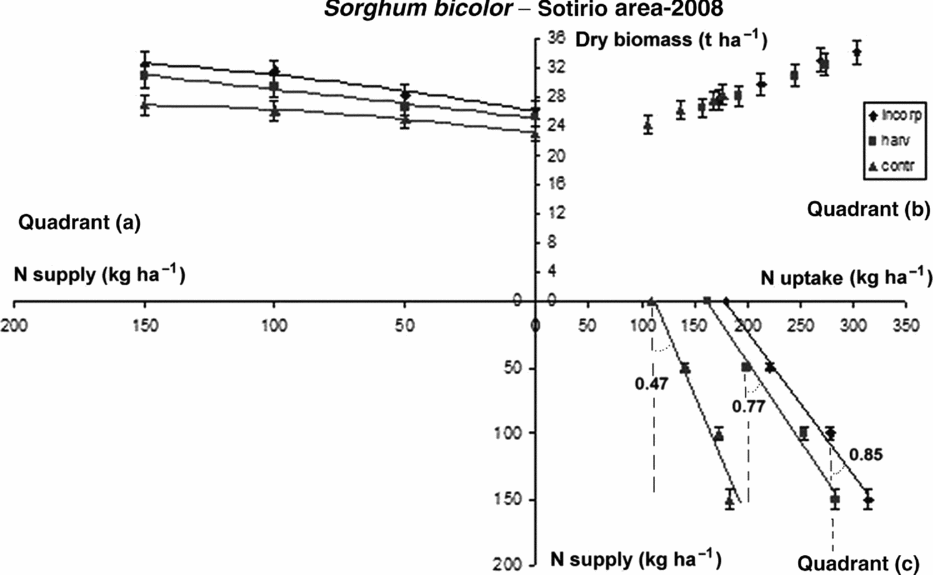
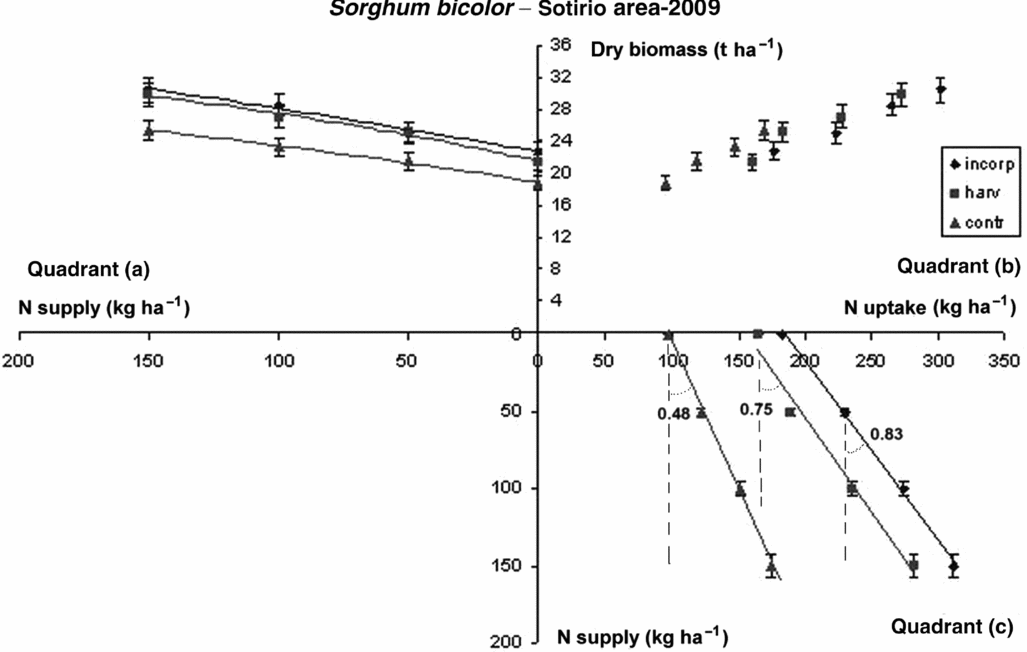
As depicted in quadrant (a) in Figures 5 and 6, especially in the case of faba bean green manuring, a remarkable yield increase was recorded in all the cases, and yields of 26.3 t ha−1 of dry sorghum biomass were possible under no fertilization (control). Maximum yields reached as much as 32.5 t ha−1, but very high yields were also reached upon modest fertilization: biomass production peaked at 31.5 t ha−1 with an N dressing of only 100 kg ha−1. Proportional results were observed when faba bean was used as a winter cover crop, with biomass production fluctuating between 25.2 and 30.1 t ha−1 depending on N dressing, considerably higher than production without previous legume cultivation, which fluctuated from 23.1 to 27.0 t ha−1 and 18.8 to 25.4 t ha−1 for the two study years respectively.
Three-quadrant diagram of fibre sorghum biomass production response to N application and three faba bean cover cropping practices in Sotirio area (central Greece) in 2008. Vertical bars indicate standard error of mean values.
Three-quadrant diagram of fibre sorghum biomass production response to N application and three faba bean cover cropping practices in Sotirio area (central Greece) in 2009. Vertical bars indicate standard error of mean values.
Biomass yield and nitrogen utilization efficiency
Nitrogen utilization efficiency is defined as the yield of grain or biomass per unit of available N in the soil (including the residual N present in the soil and the fertilizer), and also as the maximum economic yield produced per unit of N applied, absorbed or utilized by the plant to produce grain and straw (Moll et al., Reference Moll, Kamprath and Jackson1983). As already mentioned, the NUE can be divided into two processes: uptake efficiency (NupE: the ability of the plant to remove N from the soil as nitrate and ammonium ions), and the utilization efficiency (NutE: the ability of the plant to use N to produce grain or biomass yield). When dry matter or grain yield is multiplied by Ν concentration, the result are a measure of nutrient uptake and expressed in accumulation or uptake units, become useful indicators of soil fertility depletion and are related to crop yield levels. N accumulation patterns in crop plants follow dry matter accumulation, as the amount of N accumulated generally parallels dry matter accumulation and increases with plant age (Miller et al., Reference Miller, Gan, McConkey and McDonald2003).
N supply–N uptake relations
For fibre sorghum, N concentration undergoes substantial decrease during plant growth, passing from above 40 g kg−1 dry biomass in the early vegetative phase to less than 10 g kg−1 in the reproductive phase. In this process, a dilution curve of N concentration at increasing dry biomass is clearly outlined (Barbanti et al., Reference Barbanti, Grandi, Vecchi and Venturi2006; Cosentino et al., Reference Cosentino, Mantineo and Testa2012). At harvest, relation of plant N content to the N supplied by organic or inorganic fertilization reflects the efficiency of the applied N fertilization, known as the recovery fraction (Rf). This fraction can be calculated as the ratio of (N uptake at Nx – N uptake at N0) to applied N at Nx, and is geometrically presented by the slope of the curves with the vertical axis as shown in quadrant (c) in Figures 3–6. The markers on the x-axis represent the basic uptake, viz. the N uptake under no fertilization. This uptake is connected to the N annually mineralized and therefore to the inherent fertility of the particular soil (organic matter content, C/N ratio, soil structure, soil physical properties, residual N etc) and the external weather conditions.
For sandy soil (quadrant (c) in Figures 3 and 4), mineral N uptake (basic uptake) ranged from 87 kg ha−1 for the control plots to 152 and 173 kg ha−1 with legume rotation, which means that 65 and 86 kg ha−1 N may have been mineralized additionally in the case of cover crop and green manure respectively. Net mineralization during the growing season can vary from 0.25 to 1.50 kg N ha−1 per day, depending on weather, soil conditions and the nature and management of crop residues and cover crops (Bundy and Andraski, Reference Bundy and Andraski1993; Greenwood et al., Reference Greenwood, Neeteson and Draycott1985; Magdoff, Reference Magdoff1991; Schröder et al., Reference Schröder, Van Dijk and De Groot1996, Reference Schröder, Neeteson, Oenema and Struik2000). Although lower base N uptake values (in accordance with lower biomass productivity) were found on the following year (Figure 4, quadrant (c)), e.g. 85, 136 and 156 kg ha−1 for control, cover crop and incorporated cover crop, respectively, the amount of basic N uptake remained at high values, e.g. 51 and 71 kg ha−1, verifying the beneficial contribution of faba bean as cover crop and green manure on poor sandy soils.
Similar results were found for clayey soil (quadrant (c) in Figures 5 and 6), e.g. 105, 157 and 174 kg ha−1 soil mineral N uptake for control, cover crop and incorporated cover crop, respectively, meaning that 52 and 69 kg ha−1 N may have been mineralized additionally in the case of cover crop and green manure respectively in the second year, and 65 and 81 kg ha−1 N respectively in the following year, values that also reflect the contribution of faba bean on the fertility status of the specific soil type.
According to base uptake rates, the N-Rf was also affected by faba bean rotation and the results were plausible as N-Rf was practically doubled in the second year from 42% for control to 82% for intercropped plots in sandy soil, and from 47 to 86% respectively in clayey soil, since fibre sorghum is a C4 species of high photosynthetic efficiency and under appropriate conditions of light and temperature is able to convert higher nutrient availability into an enhanced nutrient uptake (Dolciotti et al., Reference Dolciotti, Marbelli, Grandi and Venturi1996). Similar positive effect was evidenced in the third year of the experiment and N-Rf was increased from 43 to 78 % for sandy soil and from 48 to 83% for clayey soil when faba bean was used as green manure, verifying the beneficial contribution of particular management. Increment of N-Rf by 30% in both soil types was also estimated when faba bean was used as a winter cover crop, reaching high values of 70% for sandy soil and 75% for clayey soil. In sandy soil, the values of N-Rf suggest a limitation to nitrate leaching to deeper soil layers, thus avoiding ground water pollution. The enhanced N-Rf has led to particularly high values of total N uptake by sorghum plants, which reached 300 kg N ha−1 in the case of maximum fertilizer application rate, combined with faba bean green manuring. Fertilizer recovery is the result of balance between crop N uptake and N immobilization by microbial processes in soils of different compositions. Therefore, the concept of NUE of a crop should also be considered as a function of soil texture, climate conditions, interactions between soil and bacterial processes (Burger and Jackson, Reference Burger and Jackson2004; Walley et al., Reference Walley, Yates, van Groeningen and van Kessel2002) and the nature of organic or inorganic N sources (Schulten and Schnitzer, Reference Schulten and Schnitzer1998).
N utilization–N yield relations
N-utilization efficiency quantifies the amount of grain/biomass produced per unit of N uptake. NUtE is calculated as the ratio of total biomass to total N uptake for sorghum, and is represented by the slopes of the curves in quadrant (b) in Figures 3–6 with mean values 60 kg of dry biomass produced per kg N taken up for Trikala area and 62 kg of dry biomass produced per kg N taken up for Sotirio area.
As can be seen, linear yield–uptake relations were found in clayey soil (quadrant (b) in Figures 5 and 6), which were connected to minimum N concentrations in the plant tissue upon stress conditions, meaning that potential productivity was not obtained. Sorghum yields larger than 32.5 t ha−1 could be obtained on such fertile soils in the study area, but considering the low fertility status of the study soil after a previous cultivation without N influxes, it was clear that incorporation of the legume contributed to the improvement of physical, chemical and biological properties of soil, which finally resulted in increased yields.
In contrast, sorghum yield of 28 t ha−1 was near potential for the Trikala area, as shown in Figures 3 and 4, quadrant (b), where with increasing N rates applied, NUtE became curved linearly, signaling increase in N concentrations in the tissues (luxurious growth) for faba bean incorporation management. For both mono-cropping and cultivating faba bean as a winter cover crop managements, linear yield–uptake relations were found without declining of linearity, indicating incorporation as the most prosperous cover cropping system.
Biomass yield, NUE and greenhouse gas emissions
The emission of greenhouse gases related to agricultural production occurs from various steps within the production chain. Hence, the assessment of different management systems requires an integrated analysis of greenhouse gas emissions covering the complete production chain and including the life cycle of agricultural inputs. Nevertheless, in an effort to visualize the beneficial contribution of the enhanced NUE of crop rotation managements in the reduction, a mean of 17.45 kg CO2 equivalents per kg N of synthetic N fertilizer (Adger et al., Reference Adger, Pettenella, Whitby, Adger, Pettnella and Whitby1997; Flessa et al., Reference Flessa, Ruser, Dörsch, Kampb, Jimenez and Munchb2002) was used in order to calculate the rate of kg CO2 equivalents per kg 103 of sorghum biomass produced for all treatments.
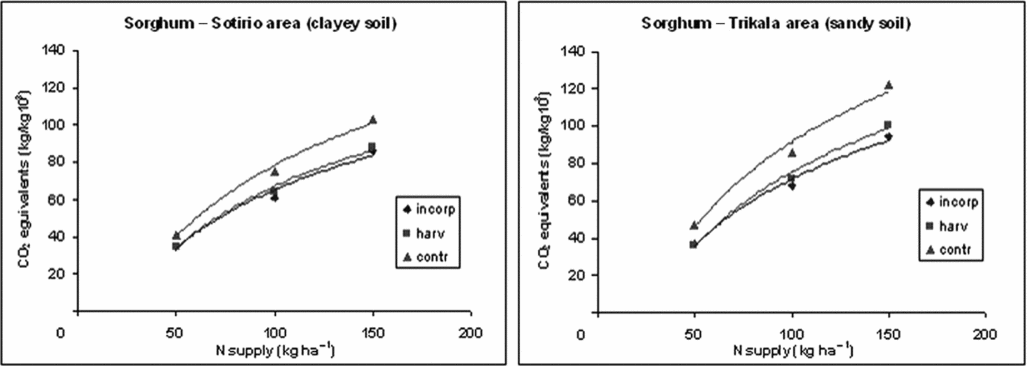
The estimated total CO2 equivalents in Figure 7 result as the ratio of kg 103 dry biomass produced per kg N supplied when kg N of synthetic fertilizer is converted to kg CO2 equivalents for the third year of the experiment. It was clear that total estimated emissions saved by avoiding N application was an additional 2.6 t CO2 equivalents ha−1 and that for the cover cropping systems, total estimated emissions were lower than for mono-cropping for both soil types, and that total emissions followed a dramatic increment when higher applications of N fertilization were applied. For modest fertilization of 50 kg ha−1 N, estimated total CO2 equivalents fluctuated from 34.9 to 47.2 kg/kg 103 for incorporated faba bean and control plots, whereas for 150 kg ha−1 N, these values aggravated to 86.1 and 121.7 kg/kg 103 respectively.
Estimated total CO2 equivalents per kg 103 of dry biomass produced for fibre sorghum in (left) clayey soil, and (right) sandy soil.
In addition, estimated total CO2 equivalents were higher in all cases for the sandy soil (viz. a mean difference of up to 18.7 kg/kg 103 for full fertilization), suggesting that adequate N rates are essential for efficient use of N fertilizer for sandy soils not only to maintain the economic sustainability of soil and water resources (increasing levels of NO3–N in the soil profile increases the potential of leaching NO3–N below the root zone and into shallow water zones, creating environmental concerns) but also to assist in the counterbalancing of increased greenhouse gas emissions of such soil types.
CONCLUSIONS
Results demonstrated that cover cropping systems, especially involving the use of faba bean as cover crop or green manure, deserve increased attention and are superior to the traditional mono-crop systems in quantitative and qualitative characteristics. Analytically, they substantially increase the base uptake and the recovery fraction of nitrogen, resulting in higher final yield productivity of dynamic energy crops such as fibre sorghum. On fertile alluvial soils (occupying large parts of the Mediterranean lowlands), high total biomass yields (26.3 t ha−1) could be obtained even under no N fertilization when faba bean is incorporated in the topsoil, while yields of 31.5 t ha−1 could be obtained with modest N dressing of 100 kg ha−1. Light textured soils, despite their low inherent fertility, may produce satisfactory biomass yields (22 to 28 t ha−1) with winter cover cropping or incorporation of V. faba in the soil before the sowing of energy crops and modest fertilization. High biomass production levels resulted for both soil types mainly due to increase in N mineralization (base uptake) and the enhanced fertilizer recovery fraction (70–85%), making the effort to reduce economical inputs as well as environmental impacts possible without high N dressings that impose nitrification hazards. Increased NUE in plants is vital to enhance yield and quality of crops, reduce nutrient input cost and improve soil, water and air quality, as better N use can lead to a reduction of up to 20% of CO2 equivalents ha−1 emitted for each kg of chemical N fertilizer applied. Appropriate legume cover cropping systems are needed for sustainable cultivation of fibre sorghum in Greece and Mediterranean agro-ecological zones.