1. INTRODUCTION
For almost 400 years, sea and overland routes connected Chile to the Atlantic slave trade. Although a rather marginal market itself, Chile was nonetheless part of the very large — and interconnected — Spanish American slave market. Merchants in Buenos Aires in particular were instrumental in introducing slaves from the River Plate into Peru and Chile, either overland or by way of the Straits of Magellan (Borucki Reference Borucki2011, pp. 83, 86; Borucki et al. Reference Borucki, Eltis and Wheat2015, p. 437). The continual demand for enslaved Africans in the kingdom of Chile forced these men and women into a permanent, if historically underappreciated, role in the imperial project for the region, from the moment of European expansion until the abolition of slavery in 1823, 5 years after the patriots defeated Spain’s army. Although the enduring presence of slaves and their descendants is confirmed by reams of archival documents, many aspects of their history continue to dwell in the realm of often-repeated truism rather than that of verified fact, including the claim that slaves were a luxury in this frontier society and that, presumably due to their elevated cost, they were well treated by their masters (Encina 1940-Reference Encina1952, pp. 3, 54).
The precise number of slaves in the various eras of Chile’s past may never be ascertained, but their presence can be traced to the very first Spanish incursion in the areaFootnote 1 . Early chroniclers reported that a small group of African and African-descended slaves accompanied the expeditionaries Diego de Almagro and Pedro de Valdivia in the 1530s, and a sampling by Mellafe (Reference Mellafe1959, pp. 194-206) of notarial records at 5-year intervals for the period 1565 and 1615 turned up a total of 220 sales documents. The Franco-Chilean historian, Zúñiga (Reference Zúñiga2000, p. 116), systematically examined Santiago’s parish registers of the mid-17th century and found that slaves made up 12.5 per cent of the 1,154 burials that took place in the city between 1660 and 1664. The census of the sprawling archdiocese of Santiago of 1777-1778 confirms the importance of the urban area’s African-descended population at that time: they constituted nearly 20 per cent of 40,000 inhabitants (Carmagnani and Klein Reference Carmagnani and Klein1965, p. 60). Unfortunately, available figures do not distinguish between those men and women of colour who were free and those who lived in bondage. Finally, historians have estimated the number of slaves in Santiago on the eve of independence to be 3,000-6,000, or 3 per cent-5 per cent of the city’s 60,000 souls, a much lower proportion of the total than that of Lima and Buenos Aires (Barros Arana Reference Barros Arana[1884-1902] 2000, pp. 7, 318, note 19)Footnote 2 .
As mentioned above, since the 19th century, historians have attributed the relatively small number of bonded men and women in Chile to the presumed elevated purchase price of a slave, although it is unclear if they consider that their cost was steep in relation to the cost of other productive assets, alternative sources of labour at the time, the price of slaves elsewhere, or the overall value of local fortunes. Furthermore, there has been no real attempt to understand why the numbers of slaves declined steeply in the decades before independence, nor has anyone pursued the question of what utility Chileans saw in buying or retaining slaves, if indeed their prices were extremely high, relative to, say, free wage labour.
The relative neglect of the study of colonial slavery has its explanation. The gradual decline in the economic relevance of slavery and the peremptory interest in forging and maintaining a national identity from the mingling of indigenous and European stock threw a mantle of indifference over African contributions to local life. Despite the recent efforts of some historians to recapture some of the experiences, struggles and life strategies of enslaved Africans and their descendants in Chile, much remains to be understood about the true dimensions of black slavery, especially with regard to its economic and social aspects and its particular functions and meanings in a frontier region of the Spanish empire marked by constant tensions with an unsubmissive Indian population (Cussen 2009; González 2014)Footnote 3 .
Unlike the case for the Spanish colonies in the Caribbean, for example, Chile’s economy was never built on plantation agriculture, and thus was not among those regions controlled by the Crown where productive enterprises relied overwhelmingly on the labour of African slaves. In the remote kingdom of Chile, slaves were initially engaged in placer mining and a variety of agricultural activities in the central region, where they supplemented the labour of a scarce indigenous population. In the mid-colonial period, slaves were also important forms of labour in the towns of the realm, and it was not uncommon to find an African slave or two in artisan workshops, where the master smith, tailor or tanner relied on their labour to meet orders for swords, dress clothes or saddles (Mellafe Reference Mellafe1959). By the last quarter of the 18th century slaves of African descent were concentrated in urban Santiago, seat of the royal courts and its outskirts, where documentation suggests that they served mostly as domestics in patrician households. Their former role in construction and small scale manufacturing may have been gradually taken over in large part by the increasing numbers of free wage labours, men of mixed European and indigenous descent, a consequence of Santiago’s growing population (see below)Footnote 4 .
Our goal in this article is to present a quantitative starting point for understanding the economic value and productive role that slaves played in the urban economy of Santiago in the late colonial and early republican period, which coincides with the «zenith of the transatlantic slave trade» (Borucki Reference Borucki2011, p. 81). We have chosen methodologies that permit us to compare trends in Santiago with those experienced in other places on the continent, a comparison that will allow us to move beyond the much-repeated declaration that slaves in Chile «were expensive», and gain a more precise understanding of how the market operated. We expect these contributions not only to pave the way for a fruitful comparison with other Latin American cities during the late colonial and early republican period, but also to shed light on the transition from slavery to wage labour as abolition movements gained momentum in the region.
Santiago’s peculiarities, as a scene of almost exclusively domestic slavery, make it an interesting case for comparison with other markets, especially as far as the determinants of slave prices are concernedFootnote 5 . Indeed, for Latin America, most studies of slave prices are concentrated (unsurprisingly) in the major slave markets, economies that were largely dominated by plantation slavery (i.e. Brazil and Cuba), and sugar in particularFootnote 6 . Furthermore, as mentioned earlier, there is only one other published study dealing with slave prices for Chile, that of Rolando Mellafe; but it covers the years 1565-1615 only (and makes use of a very small sample), so that this paper represents a valuable contribution to the dynamics of slavery under the Bourbon regime, with its characteristic demographic growth, fiscal reforms and the stimulation of intracontinental trade.
The period chosen (c. 1773-1822) is particularly relevant because it is a crucial moment in the history of slavery. It opens with the implementation of a series of economic reforms that included the creation in 1776 of the Viceroyalty of the Rio de la Plata, a step that spurred trade between Buenos Aires and Santiago, thereby connecting Chile in a new and quite direct way with the Atlantic trading system and fostering its position both as a final destination and a way station for the slave traffic that traversed the pampas and crossed the Andes on foot and by mule (Borucki et al. Reference Borucki, Eltis and Wheat2015)Footnote 7 . Indeed, these were exactly the years of the largest introduction of slaves into Buenos Aires and Montevideo, the primer region that provided slaves to Chile (Borucki Reference Borucki2011, pp. 87-88)Footnote 8 . Second, events such as the Haitian Revolution of 1791 and the repression of the Atlantic slave trade by the English in 1807 were read as signs that abolition was approaching, while the Chilean wars of independence of 1810 brought home a discussion of the meaning of citizenship and freedom and, as elsewhere, offered slaves an ostensible route to freedom in exchange for military service (Feliú Cruz Reference Feliú Cruz1942). There is no doubt, as we shall see, that these developments had a disruptive effect on Santiago’s slave market.
Thus, the main objectives of this paper are as follows: to provide a survey of slave prices for a 50-year period of major economic and political transition in Chilean history (including an analysis of the structure of slave prices); to suggest points of comparison between Santiago’s prices and those of other slave markets; and to establish the main determinants of slave prices in Santiago between 1773 and 1822. This is important because it is well known that slave prices are useful for understanding economic aspects of slavery and, in particular, for estimating the profitability of slavery itself and that the movement of slave prices can be used as an analytical tool to provide insights into the economic dynamics of any economy (as well as non-economic aspects of any country’s history) (Moreno Fraginals et al. Reference Moreno Fraginals, Klein and Engerman1983, p. 1218; Bergad Reference Bergad1987, p. 633; Bergad et al. Reference Bergad1995, p. 1)Footnote 9 . To accomplish this aim, we have gathered and analysed over 3,800 sales operations involving over 4,500 slaves, which are recorded in notarial protocol recordsFootnote 10 . We also wanted, however, to compare Santiago’s situation with other markets of the region and other times to determine features that were unique to Santiago during the period under study, as well as with those that were common to other comparable markets.
2. OUR DATABASE AND SOURCES
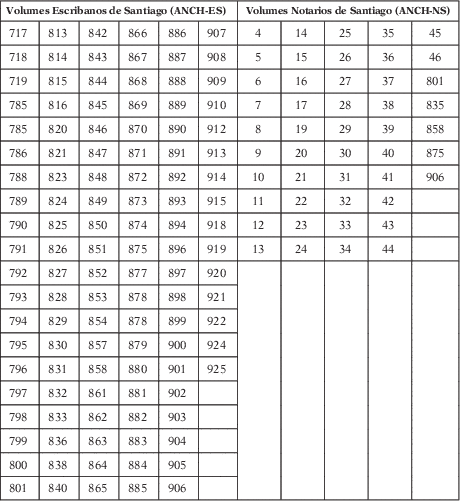
Our main sources of information are the notarial protocol records stored in Escribanos de Santiago (from 1773 to 1798, hereafter ANCH-ES) and Notarios de Santiago (from 1799 to 1823, hereafter ANCH-NS), both available at the Archivo Histórico Nacional de Chile (see Appendix 2 for a full record of volumes consulted). They are the most reliable sources for the construction of a slave price series for the period under analysisFootnote 11 . It was customary in Spanish American cities for significant legal agreements and commercial transactions to be registered by the crown-appointed notaries. Slave sales were routinely recorded in this way in part because of their value and also as a way for a buyer to gain the written right to return a slave that later displayed undeclared physical or «moral» defects, tachas. These documents are quite formulaic and contain only scant information on the transaction itself buried within the legal language protecting the respective rights of buyer and seller. During the last 3 years we scrutinised over 150 notarial volumes in total. Thus, the original data set this study analyses considers information on 3,851 sale operations involving the buying/selling of 4,556 slaves for the period 1773-1822. They reflect the effective prices paid by buyers in Santiago de Chile. There are no reasons to believe that sellers and buyers recorded false information in the notaries regarding prices. In any case, we reviewed several volumes of sales tax records (alcabalas) for part of this period and were able to corroborate some of these sales (and prices) by cross-checking the two sources, further confirming the accuracy of our main sourceFootnote 12 . All this said, the first point worth making is that most operations involved the buying and selling of one slave only (92 per cent to be more precise) or two slaves (7 per cent of all operations). Only 1 per cent of all operations involved the selling of more than two slavesFootnote 13 . That is, we are talking about market prices in a terminus of slave trading, which implied almost exclusively individual slave sales, quite different to what happened in Valparaiso, which was an entrepot of slave trading.
As we wanted to analyse the determinants of slave prices, for which it is better to have all the slaves valued individually, whenever possible we converted operations involving the sale of multiple slaves into separate entries to capture the individual price of each slave. This was made possible thanks to the specification of each slave’s price in the primary data. However, in many cases we could not get individual price information because occasionally there were multiple sales where a total price, rather than individual prices, was recorded; in particular for mothers sold with their children, or when a couple (with or without children) was sold together (in these cases a collective price for all slaves involved in the transaction was registered). These operations, where individual prices could not be identified, were removed from the database when price determinants were analysed. We also removed operations where key information, such as price, was missing. Eventually, for the analysis produced in section 3, and to produce most figures for this study, we ended up with 3,511 operations and therefore 3,511 slaves (around eighty operations per annum). In Appendix 1, we provide a table of descriptive statisticsFootnote 14 .
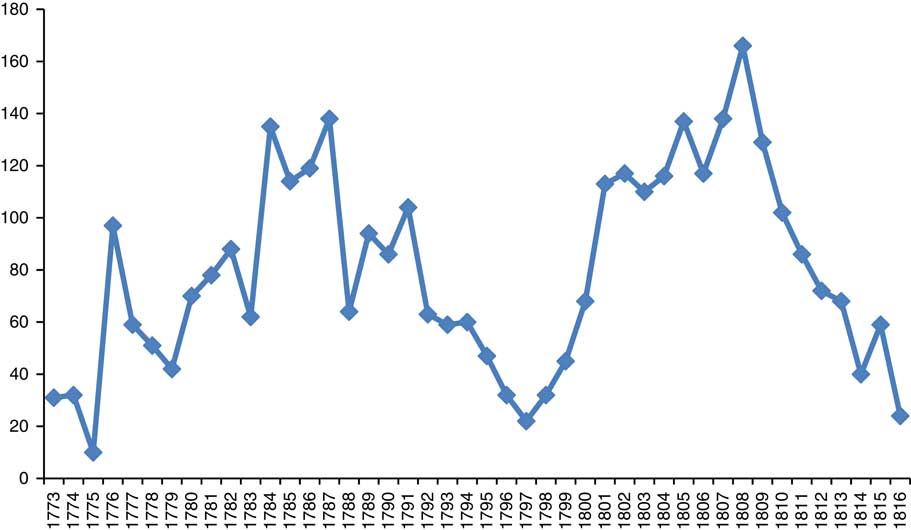
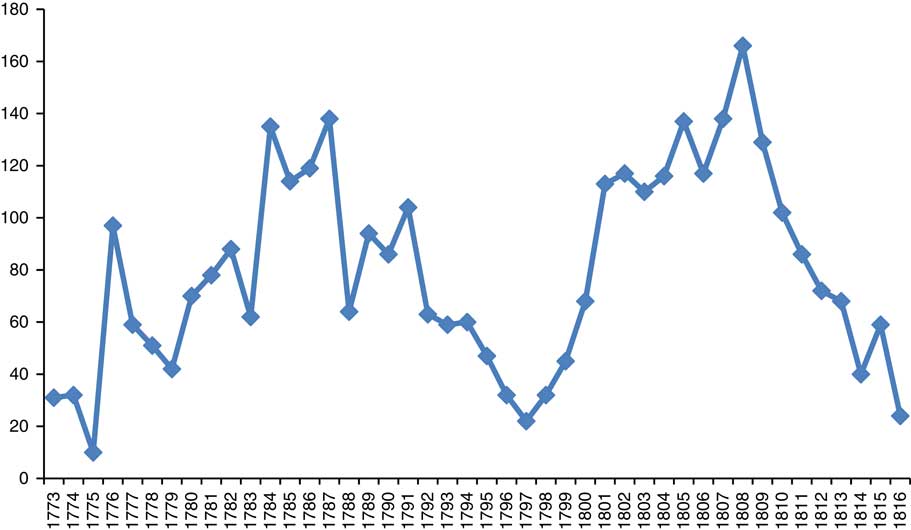
The Figure 1 shows the total of all slaves sold each year as contained in our main database, and for which individual prices could be established accurately. It is clear that we have an irregular yearly number of transactions (most surely connected to the slave trade from the River Plate), but nonetheless we have enough transactions per year (i.e. a good sample) to consider the annual averages as representative of the period under analysis (and indeed the prices shown in Figures 2, 3 and 4 do not present any «abnormality» or strange behaviour). Finally, we are aware that sales of slaves registered in notaries do not capture all slaves sold in Santiago — many slaves were passed on among family members in dowry letters and wills — and that those we registered may not have been representative of the entire slave population. For these reasons, it would be difficult to assure to what extent our sample is representative of the market as a whole. For instance, between 1792 and 1800 the market seems to have been less dynamic than in other years, but perhaps this was a market situation rather than an indication that records are missing from the sources we consulted. In fact, 1792-1800 were years of huge discontinuities in the Atlantic slave trade, which could well explain a lower volume in the selling of slaves in SantiagoFootnote 15 . For instance, data provided by Borucki (Reference Borucki2011, pp. 87-88) are consistent with our sample: our two peaks of slave sales in Santiago (1784-1787 and 1801-1808) followed or are immersed within two peaks of slave arrivals to the River Plate (1782-1783 and 1803-1805). In any case, the sample is big enough to draw strong conclusions.
NUMBER OF SLAVES SOLD PER ANNUM INCLUDED IN OUR DATABASE, 1773-1816 Notes: Originally the database included operations until 1822, but because between 1817 and 1822 only sixteen operations were registered (fewer than three per annum), we decided not to include these later years. Source: ANCH-ES and ANCH-NS.
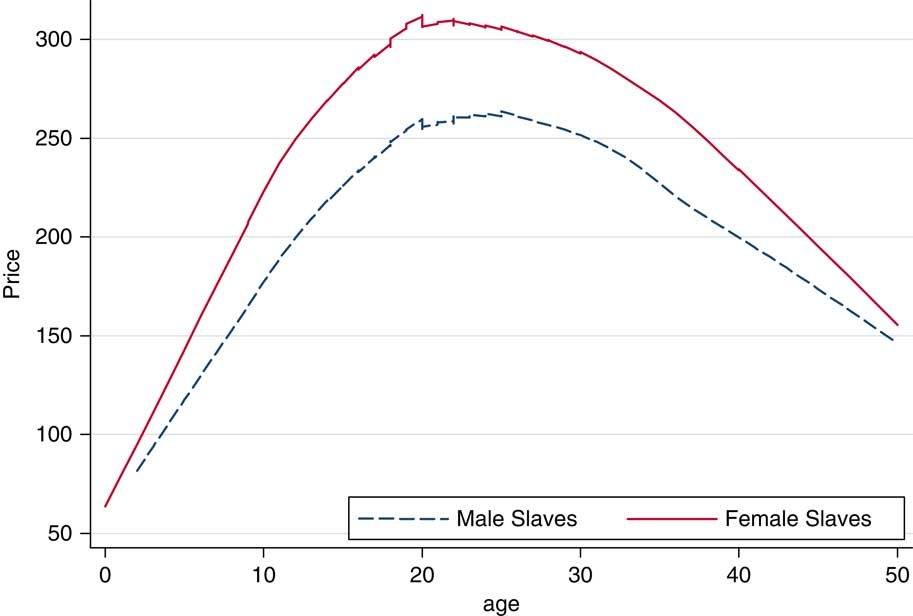
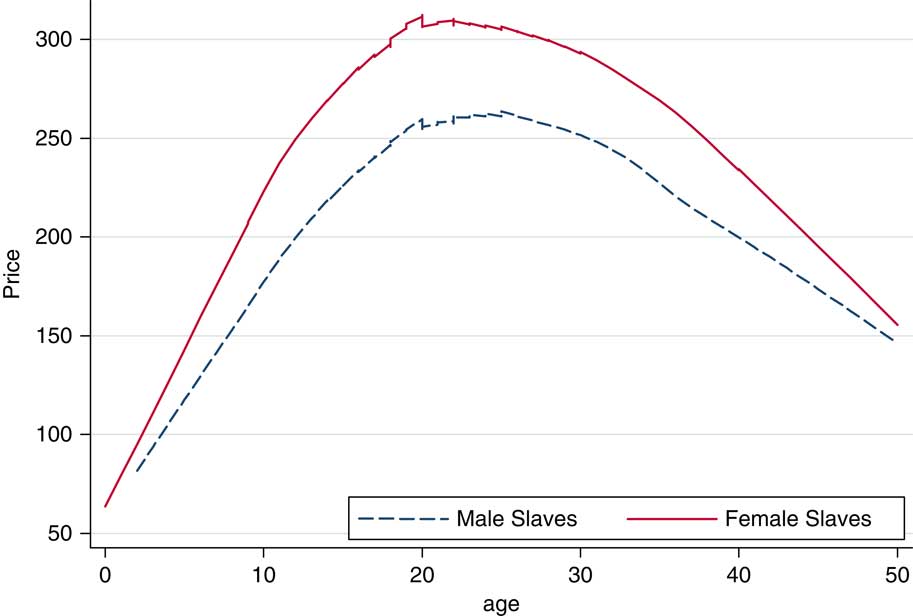
SLAVE PRICES BY AGE AND GENDER, 1773-1822 Source: ANCH-ES and ANCH-NS.
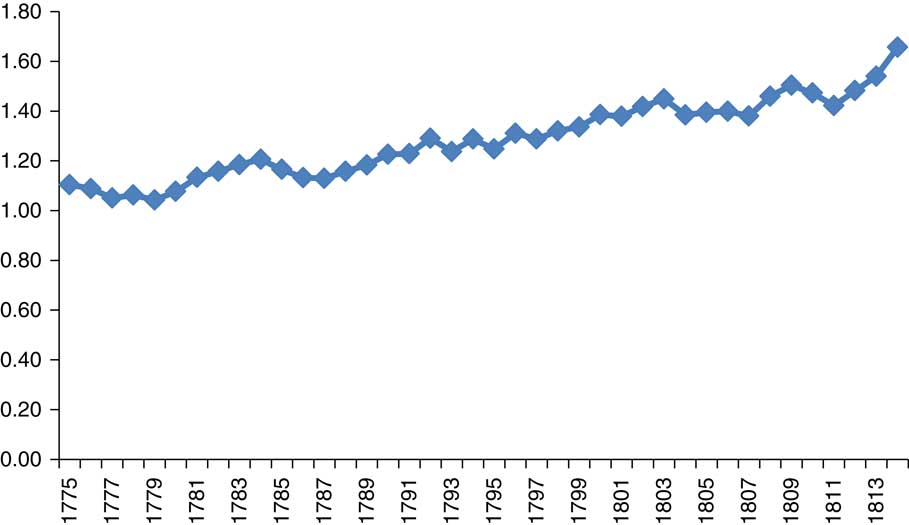
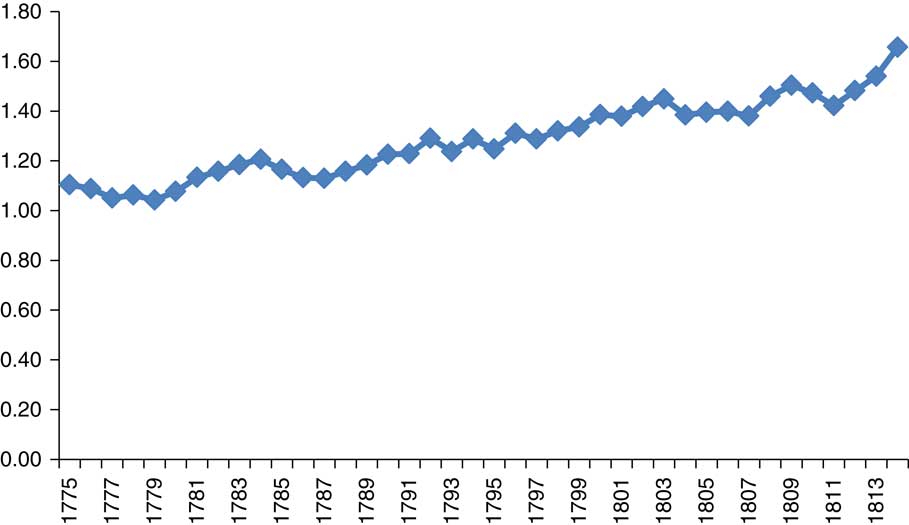
RATIO OF FEMALE SLAVE PRICES TO MALE SLAVE PRICES, 3-YEAR MOVING AVERAGES, 1775-1814 FOR PRIME AGE SLAVES (16-34) Source: ANCH-ES and ANCH-NS.
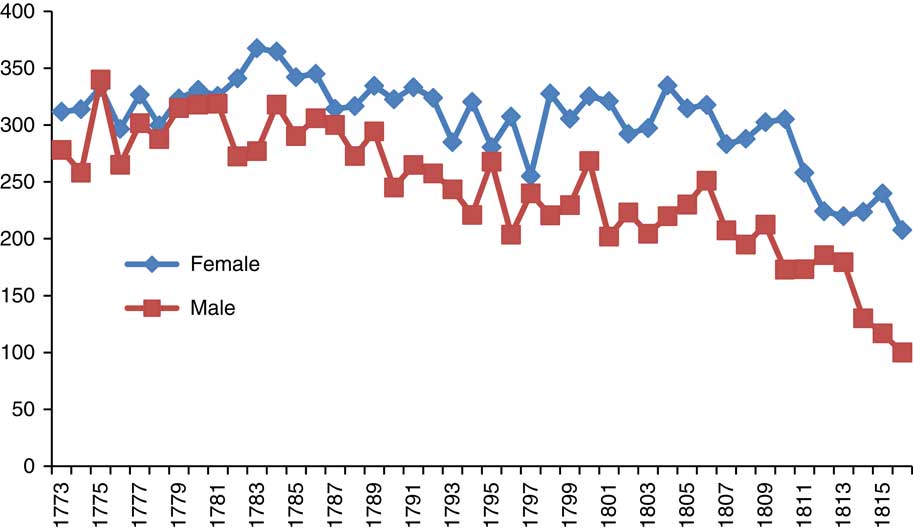
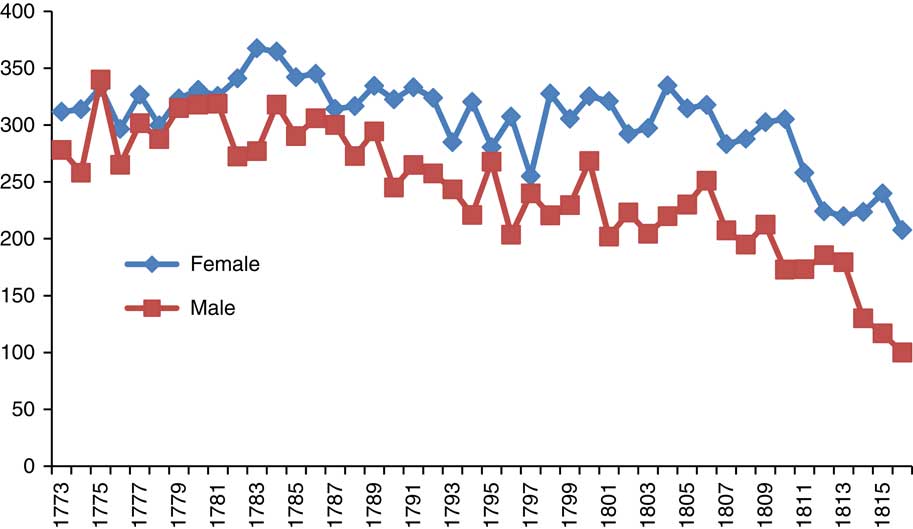
AVERAGE PRICE IN PESOS OF PRIME FEMALE AND MALE SLAVES, 1773-1816 Source: ANCH-ES and ANCH-NS.
In our adjusted database, we consistently have information regarding each slave’s sale price (all values listed in pesos of eight reales) and the year of sale (100 per cent of all cases). For most cases (99.8 per cent), we also have sex of the slave being sold, while age is registered in slightly over two-thirds of all observationsFootnote 16 . Far less frequently we have ascribed ethnic origin, occupation, health (including physical impairments) and supposed behavioural deficiencies, information not usually recorded by notaries. This is regrettable, because these variables certainly affected market prices (on this, see Fogel Reference Fogel and Engerman1994, pp. 69-71)Footnote 17 . Therefore, it is more difficult to establish the influence of human capital (e.g. training) on prices.
Regarding the main variables available to us, slaves prices oscillated in our sample between $25 (young children) and $600, although most prices of adult slaves ranged between $200 and $350, which is analysed in further details belowFootnote 18 . Female slaves were more valuable in urban Santiago than male slaves, most likely a result of female slaves being used as domestic servants, a subject that will be analysed in depth later. On average, female slaves were sold for 281 pesos, in comparison with 231 pesos paid for male slavesFootnote 19 . This price gap is also present when we look only at slaves that, according to the price curve, could be considered to be of prime age (16-34), or considered by buyers to be of particularly high quality (we discuss this concept below). Table 1 shows that female prime age slaves were sold on average at 311 pesos, while their male counterparts were sold at 261 pesos.
SUMMARY OF SLAVE PRICES PER GENDER IN PESOS, 1773-1822

Source: ANCH-ES and ANCH-NS (volumes listed in Appendix 2).
For the reader to have an idea of what could be bought with, say, $250 in Santiago at that time, it is worth mentioning that for c. 1772-1808 (the closest interval to our period of study we managed to find price series), one could acquire over 500 yards of simple cloth or over 200 pairs of cheap shoesFootnote 20 . For productive assets, around twelve fine horses (Johnston Reference Johnston1962, p. 284) or thirty healthy cows (Haenke Reference Haenke1942, pp. 259-260) could be obtained with $250. If one were in the market for luxuries, the same amount would buy at auction a pair of gold shoe buckles and a string of 350 pearlsFootnote 21 .
The age of nearly half of all slaves sold (and for which we have age information) was between 17 and 25 years. Close to this age range, those aged between 13 and 16 accounted for 16 per cent of all operations, while those between 26 and 30 were 11 per cent of the total. That is, slaves aged between 13 and 30 accounted for an accumulated share of 76 per cent. The proportion of children under 13 was 15 per cent and 9 per cent for those over 30 years. It seems clear from these data that Chilean slave buyers focussed their attention on purchasing (and certainly exploiting) young adult slaves in the short term; investments which were quickly recovered (see below).
Regarding gender, 48 per cent of the sales sample consisted of female slaves, and 52 per cent of malesFootnote 22 . Unfortunately, we could gather explicit slave occupation data for only 4 per cent of the database; although we can assume from qualitative data that most were used in domestic service (we deal with this issue in the next section). And indeed, the most frequent explicit occupation was «servant» (criada-o), followed by «household service» (servicio domestico) that could be considered roughly the sameFootnote 23 . For «casta» the information was far better: we were able to gather the ascribed socio-racial category for 87 per cent of the slaves included in the data set. Of these, 72 per cent were defined as «mulato-a», (someone thought to be of European-African or perhaps indigenous-African ancestry) 27 per cent as «negro» and 1 per cent as «sambos» (persons of indigenous and African ancestry)Footnote 24 , Footnote 25 . Of those classified as «negro» (of purely African origins), we could establish with accuracy that at least 20 per cent were «bozales», a term generally used to denote a native of Africa who did not speak Spanish or Portuguese (Borucki et al. Reference Borucki, Eltis and Wheat2015, p. 446). In any case, what is clear from the data is that African slaves were not as common in Chile as in other marketsFootnote 26 . As for slaves’ names, in most cases slaves are referred to only by a first name, with surnames rarely given. Regarding buyers and sellers, most (if not all) of them are recorded with the titles of don or doña, a hint at elite status of both buyers and sellers. Finally, as far as tachas are concerned, information was available for only 1 per cent of the cases. One might interpret this silence to mean that buyers were generally so eager to obtain a slave that sellers did not insist on specific language to protect them from the return of «deficient» merchandise.
3. SLAVES’ PRODUCTIVE ACTIVITIES
We gathered slaves’ occupations whenever possible because they are a good indicator of the skills of the population being analysed. Unfortunately, not much occupational information was registered in these sales contracts, but court records of disputes between masters and slaves of the time would suggest that most of Santiago’s female slaves were employed as domestic servants where they fulfilled a variety of tasks: the negra Isabel Gajarda, for example, served her mistress by washing, cooking and preparing sweets, which she then peddled in the city streetsFootnote 27 . Some of these skills could be quite specialised: Pastorisa Aliaga supported her impoverished masters by offering her ability to embroider in gold and silver thread to paying customersFootnote 28 . Some slaves even managed their master’s shop or tavern (pulpería). Men in bondage, likewise, were presumably attached to patrician households as drivers and servants, although some of these domestics may have been sent to join other workers at harvest time in outlying orchards and wheat farms. Others lived somewhat independent lives earning wages for their owners as muleteers, ditch diggers or even as shoemakers, barbers and tailors. Child slaves accompanied the younger generations in the household: 7-year-old Juan was whipped by the local marshal on behalf of an irate neighbour when he climbed across the fragile tile rooftops to recover a fallen kite for his master’s offspringFootnote 29 .
4. SURVEY OF PRICES
Turning now to the values reflected in the sales contracts, Figure 2 shows the prediction of prices of slaves per age, for both females and males for the totality of the period included in our database. The non-linear fit further confirms the inverted U-shape relationship, while it also shows that there is an age premium for slave ages 16-34. In sum, the usual inverted U-shape is present, and confirms the usual concavity of the age-price profile. So far, then, nothing new has been discoveredFootnote 30 .
However, the first striking aspect of our sample is that the prices of female slaves systematically exceed those of males, a fact already anticipated in Table 1 Footnote 31 , but more clearly seen in Figure 2 Footnote 32 . This is at odds with the evidence found for other markets (either rural or urban) such as the United States, the Caribbean, Brazil, Peru and the River Plate. In Bahia (1819-1888), for instance (an urban area), the price of a female adult was about 78 per cent that of males, while in Pernambuco (a plantation economy), Peru (where slaves were mainly used in cane plantations, vineyards and also in a variety of urban tasks) and the River Plate (a ranching area), the price of the men was on average 10 per cent above that of the women during the 19th century and late 18th century, respectivelyFootnote 33 . Likewise, in the U.S. South, in plantation economies prices of healthy female field hands were 80 per cent of that of males (Fogel and Engerman Reference Fogel1974)Footnote 34 , while in the Colombian Chocó (a mining area) males were also valued higher than females for 1768-1779 (Sharp Reference Sharp1975, p. 481). In Cuba too, for most of the period 1840-1875, prices of males were well above those of females (Bergad Reference Bergad1987, p. 638)Footnote 35 , for both creoles and Africans (Moreno Fraginals et al. Reference Moreno Fraginals, Klein and Engerman1983, pp. 1209-1210).
Finally, it is worth noting that the premium paid for females in Santiago increased through time, as can be seen in Figure 3. From the extant evidence available to us, it is not clear why this happened, but we believe that it was a result of an increasing demand for females in Santiago (relative to males) on account of a growing local elite (a result of the demographic growth of Santiago mentioned above) that demanded more females than males for domestic serviceFootnote 36 . This was coupled with a fall in the real wages of unskilled free workers in Santiago (see below).
A second striking difference between Santiago and other markets in the Americas is that the maximum price was obtained at an earlier age in Santiago, at least for males. Indeed, in Santiago’s case, prices for male slaves reached a peak at age 26, while for other markets in the region the peak was reached at 27-30 years. Such is the case, for instance, for Peru and the River Plate (30 years) (Newland and San Segundo 1996, p. 697), Cuba (28-30 years) (Moreno Fraginals et al. Reference Moreno Fraginals, Klein and Engerman1983, p. 1213) and the United States (Fogel and Engerman Reference Fogel1974, pp. 67-86)Footnote 37 . In the case of females, as in other markets, the price of women still approached a peak more rapidly than prices for men, given the earlier physical maturation of females.
All this said, it is well known that prices of slaves (as salaries of free workers) are best analysed when we use ranges of age, and in particular when we focus on what has been called within the specialised literature a «prime age»Footnote 38 , in our case 16 through 34 years of age, a range quite similar to that chosen by Pritchett and Chamberlain (Reference Pritchett and Chamberlain1993) (15-35 years). It must be said, however, that there is no consensus about prime age ranges within the historiography. For instance, Moreno Fraginals et al. (Reference Moreno Fraginals, Klein and Engerman1983, p. 1203) talk about «prime age» for all slaves aged between 18 and 39, while Kotlikoff (Reference Kotlikoff1979, 1992) preferred the range 21-38. In contrast, Bergad (Reference Bergad1987) and Bergad et al. (Reference Bergad1995) took the range 15-40 years as prime ageFootnote 39 . Authors’ selection of age ranges is not made idiosyncratically: they respond to an initial perusal of price frequency distributions by age for the sample being analysed (on this, see Bergad Reference Bergad1987, p. 635). After so doing, we preferred to use the range 16-34 years given the fact that prices within these limits were rather stable, and that there is a notable increase in slave prices after 16 and a sharp decline after 34. Moreover, we already mentioned that there is an age premium for slaves aged 16-34.
Having a prime age group, which incidentally gathers two-thirds of the whole sample, allows us to refine our analysis, in particular through time. Thus, as can be seen from Figure 4, female slave prices remained rather constant between 1773 and 1810, indicating stability and strength in demand, and that slave supplies kept pace with demand (i.e. there were no slave labour shortages at any time, which is not surprising given the small size of the market)Footnote 40 . The case of males is less clear: there is stability up to the late 1780s, but during the 1790s there was a declining trend in their pricesFootnote 41 . This declining trend could be linked to similar price movements in Lima (an alternative to the Chilean market) and the River Plate (from where slaves were taken to Chile). Unfortunately, we have no data of slave prices per year for these two related markets for the period under analysisFootnote 42 . In any case, the growth of the price gap between female and male slaves over these years requires further explanation.
More remarkable is the fact that, although women were no longer conceiving slaves after 1811 (the year the free womb law was passed, see below), their prices remained much higher than those of males. This suggests to us that their higher values throughout the period we have examined cannot be explained by their ability to provide their masters with new slaves. At the same time, the war of independence also explains part of the change in the price of slaves over this period. In particular, given that male slaves could be called to serve in the army. The sharper drop in prices for male slaves after 1811 suggests that individuals were incorporating the risk of losing a male slave to military service in the price of slaves.
Yet, this declining trend in slave prices for males is consistent with recent findings that real wages of unskilled workers in Santiago declined exactly during this same period (Llorca-Jaña and Navarrete-Montalvo Reference Llorca-Jaña and Navarrete-Montalvo2015, figure 4), a time of rapid gains in population. Interestingly, the fact that prices of female slaves did not decline would seem to suggest that a free wage-earning woman was not considered a good substitute for a female domestic slave. Although only further study of qualitative sources, such as personal correspondence, might shed light on this very interesting difference, a few possible explanations come to mind.
On the one hand, a master or mistress controlled the non-work aspects of a slave’s life, including her sexual activity, more easily than in the case of a free labourer, who might simply walk off the job in situations of perceived abuse. As part of his patrimony, unless a female slave could prove she had been subjected to excessive punishment, a master could force her to remain in his household until he decided to sell her. Thus, the training that a master or mistress invested in a bonded serving woman could not be lost to a better offer in the marketplace. In addition, the offspring of a domestic slave who survived childbirth, although an unproductive and costly member of the household for perhaps half a dozen years, would then become useful in the kitchen and/or as a hand servant to the children and young women of the family. Her owner would not have been indifferent to his slave woman as a potential source of new slaves, «a conduit of stability and wealth», a fact presumably reflected in her price (Morgan Reference Morgan2004, p. 83). Finally, a slave woman was undeniably susceptible to the sexual coercion of her master who held in his hands «the power of rape» (Baptist Reference Baptist2001, p. 1621).
Another explanation of the inclination to own slaves is attributable to cultural factors that related a servant’s ancestry to his or her master’s sense of security and social pretensions. There is evidence to suggest that, from the early periods of the ongoing war with the indigenous population, Chileans felt safer with blacks sleeping under their roofs than Indians. In addition, black bodies were identified with household service, and perhaps offered measures of prestige as well. According to one British traveller to the region in the early 19th century, white and mestizo women were highly reluctant to work as servants, a job highly associated with African origins, and no decent family was to be found without a slave to care for them (Miers 1826, pp. 1, 191, 229).
According to Carmagnani, the population of the Bishopric of Santiago (to which Santiago belongs, but which encompasses a wider area) increased significantly during the last decades of the 18th century, in particular after the 1760s-1770s, a phenomenon that also applies to the whole of Chile. In 1777-1778, the population of the Bishopric of Santiago was reportedly 183,000 people, and it increased quickly to 383,000 by 1813 (Carmagnani Reference Carmagnani1967, pp. 183-185, Reference Carmagnani2001, p. 308). Unfortunately, we do not have precise numbers for Santiago in isolation to the rest of the country, but qualitative evidence suggests that Santiago’s population was also increasing rapidly during this period. Indeed, according to De Ramón (Reference De Ramón2000, pp. 91, 106-107), between 1779 and the late 1810s Santiago’s population doubled. This being the case, we are in the presence of a remarkable increase in unskilled labour supply in the short run, which surely pushed down real wages in Santiago, as was suggested more generally by Carmagnani (Reference Carmagnani1967, p. 191) for the whole of Chile. This, in turn, would put downward pressure on slave prices, given the high level of substitution between free unskilled workers and slaves, in particular for males.
Finally, it is clear that for both genders slave prices declined dramatically in 1811. This is not surprising: that year the free womb law was passed in Chile (i.e. thus freeing children born to slave mothers), while a year later (1812), in the neighbouring United Provinces of the River Plate (the main source of slaves for Chile), slave traffic was prohibited (Carmagnani Reference Carmagnani1967, p. 191). Understandably, this triggered great uncertainty regarding the future of slavery itself, causing prices to plummet. Exactly the same thing happened in Cuba and Brazil when similar laws were promulgated, although 60 years later. Slaveholders’ reaction to eminent abolition was to estimate the number of years for which slavery was believed to last, and then to adjust prices accordingly (i.e. downward), as the number of years over which the flow of income from slaves’ services was reduced (Bergad et al. Reference Bergad1995, p. 151; Reis Reference Reis1977, pp. 108-110; Slenes Reference Slenes2004, pp. 359-360).
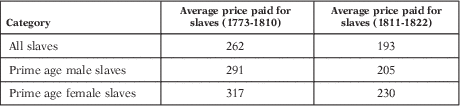
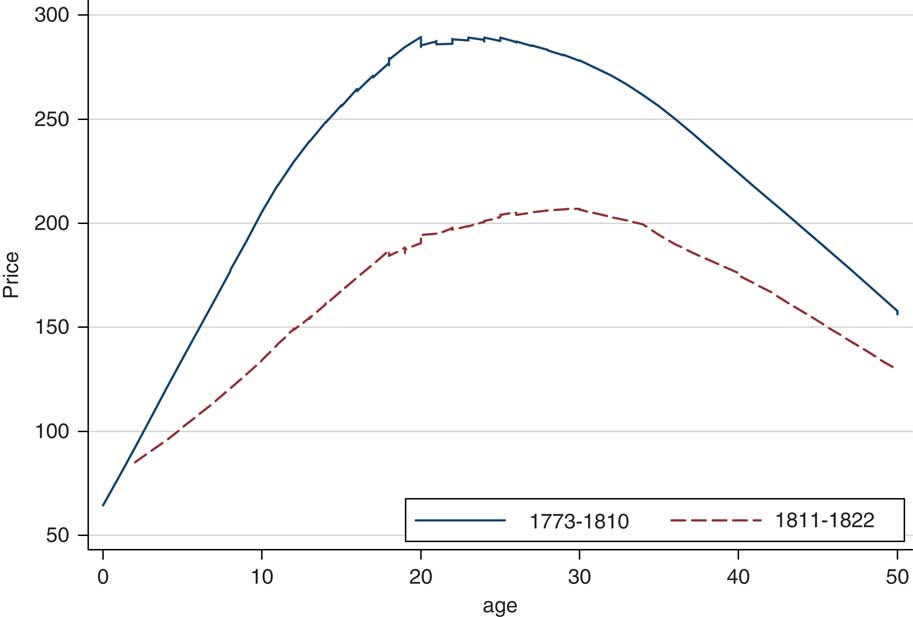
Given the fact that slavery was officially abolished in Chile in 1823, we can conclude that potential buyers from 1811 were right to anticipate the end of slavery and were, therefore, willing to continue buying slaves only at reduced prices. Table 2 provides more information backing this point. It shows that the average price declined from $262 before 1811 to an average of $193 post 1811, a 27 per cent reduction. In the case of prime age females and males, the reduction was of 27 per cent and 30 per cent, respectively. There is little doubt that abolition was on people’s minds.
SLAVE PRICES (PESOS) BEFORE AND AFTER FREE WOMB LAWS

Source: ANCH-ES and ANCH-NS.
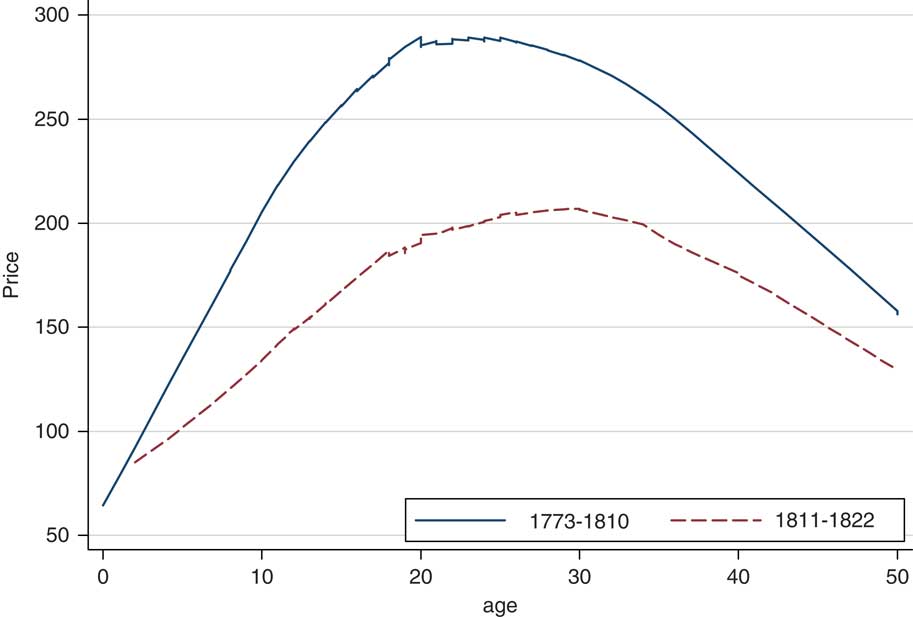
Figure 5 also shows that after 1811 the prices of slaves are less sensitive to a slave’s age, which was to be expected. It appears that owners valued slaves for a shorter number of years of work (if not a fixed term period) before the estimated time of abolition (e.g. buyers in 1812 expected slavery to be abolished in Chile in, say 1814, so that they thought that they were buying the slave for 2 years only). Prices certainly do not reflect all the remaining years of the slave’s productive working life, as they probably did before 1811.
AVERAGE SLAVE PRICES (PESOS) BEFORE AND AFTER THE FREE WOMB LAW Source: ANCH-ES and ANCH-NS.
At this stage an interesting question arises: how do slave prices compare with wages of unskilled workers? A recent paper provides data on wages for unskilled male workers in Santiago for 1788-1808 (Llorca-Jaña and Navarrete-Montalvo Reference Llorca-Jaña and Navarrete-Montalvo2015, table 2). Should we calculate the ratio of male slaves’ prices (of prime age) to cash annual wages of unskilled male workers in Santiago (i.e. excluding food)Footnote 43 , the annual average for 1788-1808 is 3.6. That is, ceteris paribus, it took slave owners about three and a half years to recover the investment made in a slave of prime age. Therefore, it seems plausible to us that it was quite profitable to buy a male slave in Santiago during the period under study.
5. DETERMINANTS OF SLAVE PRICES IN SANTIAGO
To analyse the price determinants of slaves in Santiago for c. 1773-1822, regression analysis was used to investigate the structure of slave prices and to answer key questionsFootnote 44 . In particular, regressions were estimated to establish the statistical relationship between the prices (dependent variable) and the observable characteristics of the slaves included in our sample. The independent variables included biological variables such as age and gender; age being one of the main slave characteristic affecting the quality of slaves. The following hedonic model was estimated:
 $$\log (Slave\,Price_{i} ){\,=\,}\beta _{0} {\plus}\beta _{1} \!\cdot age_{i} {\plus}\beta _{2} \!\cdot age_{i}^{2} {\:\plus\:}\!\,\,female \cdot \beta _{3} {\plus}\:\:\:\:\:\:X'_{i} \beta _{4} {\plus}{\varepsilon}_{i} ,$$
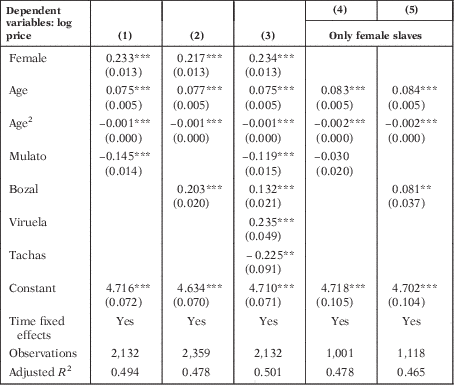
where age i is the age of slave i, age 2 i the square of age, female i a dummy variable that is equal to 1 if the slave is female and X i other slave characteristicsFootnote 45 . Other slave characteristics that enter the regression analyses are a dummy variable identifying whether the slave is mulato/a, a dummy variable identifying whether the slave had survived viruela, a dummy variable identifying whether the slave had any tachas and another dummy variable identifying whether the slave was bozal. Time fixed effects or a dummy identifying post 1811 are also included in some specifications.
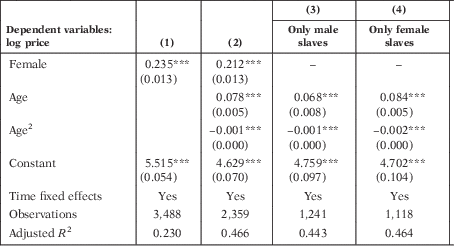
Table 3 shows regressions for four different specifications. In column 1, log prices are regressed against a dummy variable identifying female slaves, including time fixed effects. The coefficient 0.23 is statistically significant and implies that the price for female slaves is 0.23 log points higher than a male slave, that is, female slaves cost on average 26 per cent more than malesFootnote 46 . The price difference between male and female slaves (see Table 1) can also be checked with a t-test. The null hypothesis for the equality of means has a t-statistic of 17.54, and can be rejected with a P-value of 0.0000, that is, mean prices for male and female slaves are statistically not equal. In column 2, two more variables are included: age and age square. Both variables aim to capture the relationship between price and age and, in particular, the age at which slaves fetch the highest premium. All coefficients on the age variable are positive and statistically significant. The coefficient 0.078 on age and −0.001 on age square imply that the highest premium is paid for 26-year-old slaves (for male and females grouped together)Footnote 47 . Note that the sample size drops from 3,488 observations to 2,359 observations in column 2. This is due to age not being reported in many slave transactions. In columns 3 and 4, the sample is split by gender, column 3 estimates the peak in prices for males, while column 4 does so for females. In particular, males’ peak is estimated at an age of 26.5 years (see column 3). On the other hand, female slaves achieve the highest price at age 26Footnote 48 .
DETERMINANTS OF SLAVE PRICES: THE EFFECT OF AGE AND GENDER, 1773-1822

Notes: Robust standard errors in parentheses.
***P<0.01, **P<0.05, *P<0.1.
Source: ANCH-ES and ANCH-NS.
Table 4 includes other slave characteristics in the regression analysis. Column 1 includes a dummy variable identifying whether the slave is mulato or mulata, in column 2 a dummy variable identifying whether the slave is bozal is included (but not the mulato variable), while in column 3, besides the mulato and bozal dummies, two additional dummy variables are included, one identifying whether the slave had survived smallpox and a second dummy identifying whether the slave had any tachas. It is worth noting that the coefficients on female, age and age square remain similar across specifications, even though the sample size drops to 2,132 observations due to some missing values in the mulato variable. Note that coefficients are robust to changes in the regression specification, as coefficients on all variables remain significant through specifications in Tables 3 and 4, with values close to constant. Therefore, results in Table 4 confirm those obtained in Table 3.
DETERMINANTS OF SLAVE PRICES: THE EFFECT OF AGE, GENDER AND OTHER SLAVE CHARACTERISTICS, 1773-1822

Notes: Robust standard errors in parentheses.
***P<0.01, **P<0.05, *P<0.1.
Source: ANCH-ES and ANCH-NS.
Another finding worth noting is that the coefficient on mulato in column 1 is −0.14, which implies that mulato slaves cost less than non-mulato slaves. Non-mulato slaves are all slaves not reported as mulatos, which in our sample are mainly «negros» (there is only one slave registered as white and samba slaves are only 1 per cent of the sample). In turn, it is worth noting that black slaves who are in turn bozal are paid a premium of 20 per cent over non-bozales (see coefficient on bozal variable in column 2), but it is unclear if this was due to a «higher quality» of bozales. Columns 4 and 5 restrict the sample to female slaves only. Column 4 shows that female mulato slaves cost on average the same as non-mulato female slaves (the coefficient is not statistically significant). While, overall, mulato slaves fetch less on average (see column 1), column 4 shows that this result is mainly driven by male slaves. Column 5 shows that female bozal slaves cost 8 per cent more than non-bozal female slavesFootnote 49 .
Thus, rather surprisingly, in Santiago, prices of Africans (bozales) were higher than creolesFootnote 50 . In contrast, for Cuba, Bergad et al. (Reference Bergad1995, p. 67) found that up until the mid-19th century, «Cuban-born slaves of either sex consistently sold for greater average prices than Africans». Also for Cuba, but for later periods, Moreno Fraginals et al. (Reference Moreno Fraginals, Klein and Engerman1983, p. 1207) found that slave prices of creoles slaves were higher than for Africans for both male and female between 1856 and 1863, while Bergad (Reference Bergad1987, p. 646) found very little difference in average prices between creoles and Africans, at least between 1857 and 1860. In all, regardless of whether the slaves were used in plantations or in urban centres, according to Bergad et al. (Reference Bergad1995, pp. 67-68), creoles commanded higher prices because of acculturation: creoles (or those living for a long time in the region) could speak Spanish, usually assimilated Catholicism, had never experienced freedom (or not recently), were used to the labour routines demanded by owners, and were considered less prone to rebellions. The argument is compelling, so why was the opposite observed in Chile?
It is not clear why Chileans would have paid higher prices for bozales, 70 per cent of which were men, but one might conjecture that they were perceived to be more dependent on their masters and thus more easily controlled and trustworthy, and that they conferred important levels of prestige on their owners. Another explanation could be related to interconnections between Chile and Peru. We know that Lima was a bigger market than Santiago, so much so that perhaps Lima’s demand pushed Santiago’s prices of bozales up, relative to non-bozales, who were less preferred, perhaps, in Lima. Unfortunately, we do not know as yet what jobs these bozales performed in this period, but there is some indication from an earlier period that they were thought to be more reliable at certain specialised functions involving highly valued products, such as the process of minting coins (Cussen Reference Cussen2015, p. 153)Footnote 51 . In any case, given the small number of bozales within our sample (males and females), it would not be prudent to push conclusions too far.
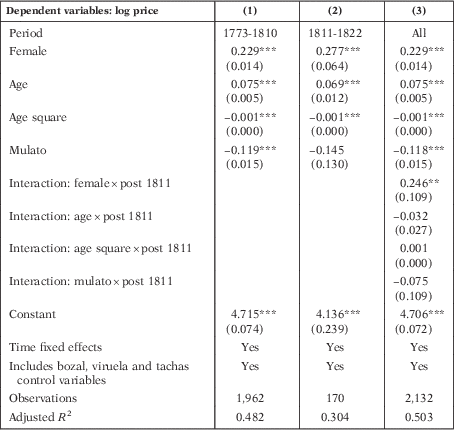
Table 5 is an exercise to determine whether the structure of prices remained constant over the whole period under analysis. Given the 1811 free womb law and the wars of independence, in column 1 we estimate the determinants of slave prices before 1811, while in column 2 we repeat the exercise for the period after 1811. A close inspection of the coefficients on female, age, age square and mulato variables shows that only the female variable changed between 1773-1810 and 1811-1822. In column 3 we check which variables are changing over time by interaction of each variable with the post 1811 dummy. The only interaction that is statistically significant is the female post 1811, which implies that females are being sold at a higher premium than male slaves after 1811, in comparison with their prices before 1811. In our sample, female slaves were always more expensive than their male counterparts, but after 1811 female relative prices appear to be even higher than before. This result suggests that once the wars of independence began, buyers of slaves adjusted their prices taking into account the risk of losing male slaves to the army. This explanation is consistent with female slave prices falling by less than male slave prices after 1811, which was reinforced by the ending of the slave trade in the River Plate mentioned above.
DETERMINANTS OF SLAVE PRICES OVER TIME

Notes: Robust standard errors in parentheses.
***P<0.01, **P<0.05, *P<0.1.
Source: ANCH-ES and ANCH-NS.
Finally, regarding the impact of skills on prices, we do not have enough data to run regressions, but patchy evidence available to us suggests that urban skilled slaves commanded higher prices than those employed in domestic service. In 1777 and 1782, for instance, male shoemakers were sold for $380 and $330, respectively, and in turn these years the average prices of male slaves used in domestic service were $302 and $272, respectively. That is, shoemakers achieved premiums of 26 per cent and 21 per cent, respectively. This is in line with the results shown by other colleagues for other markets. For instance, in New Orleans (c. 1804-1862), slave artisans were sold at times as much as 24 per cent-49 per cent premium over field hands (Kotlikoff Reference Kotlikoff1992, pp. 32, 40).
6. CONCLUSIONS
In all, although our database has some limitations due to the lack of more precise data for gender and age, and the failure to register more systematically occupations, purported health and behavioural failings, it is nevertheless reliable and useful to show the first series of market prices over time for a broad category of urban slaves in Santiago during the late colonial and early republican period. We are certain that the prices and results presented here can be used with confidence by scholars examining the history of Chilean slavery or for comparative studies with other slave markets. Indeed, our series confirms the usual inverted U-shape when prices are plotted against age, and that age was a very important determinant of slave prices, regardless of the regression analysis used.
Our series is also useful for analysing the ratios of prices between males and females and across broad categories of ages. One of the most striking findings of our study is that in Santiago de Chile female slaves were systematically priced over male slaves, quite contrary to what happened in most other markets, and that the premium paid for women increased through time. Female slaves cost on average 26 per cent more than males.
We also found that the prime age of Santiago’s slaves is 16-34, a younger range than for most other places: slaves prices peaked earlier in Santiago, reaching the highest age premium at 26 years old. The data have also shown many other interesting facts, for instance, the real impact of the free womb law and the wars of independence on market prices after 1811 (i.e. prices plummeted, falling between 31 per cent and 38 per cent, and became less responsive to slaves’ ages), suggesting that slave owners rightly anticipated an imminent ending of slavery in Chile. It has also confirmed that male slave prices moved in the same direction as real wages of unskilled workers in Santiago during the 1790s, but that female slave prices did not respond with the same intensity to this change in free labour male wages. Last but not least, we found that, on average, it took only about three and a half years for a slave owner to recover the investment made in a male slave in his prime age. In all, our results strongly suggest that the pricing of slaves in Santiago was guided by economic sophistication and rationality on behalf of buyers and sellers. Transactors seem to have been careful and calculating when buying or selling human beings.
Finally, we are aware of the fact that this paper has raised a number of questions that remain to be explored. Yet, in this, the very first paper to study the Chilean slave market in a systematic way, far from presenting the final word on this fascinating topic, we hoped to signal routes of further inquiry.
APPENDIX 1
TABLE OF DESCRIPTIVE STATISTICS

APPENDIX 2
VOLUMES CONSULTED AT ARCHIVO HISTÓRICO NACIONAL DE CHILE