Introduction
Visible emission from Er-ion-implanted nitrides [Reference Steckl and Birkhahn1,Reference Lozykowski, Jadwisienczak and Brown2] has been reported, with application in electro-optical devices, and from sputtered amorphous AlN:Er thin films [Reference Gurumurugan, Chen, Harp, Jadwisienczak and Lozykowski3]. In the AlN:Er films, photoluminescence (PL) data could not be obtained; it is, however, possible to use above-bandgap excitation in sputtered GaN films. Sputtered GaN films have been deposited on sapphire and silicon substrates by reactive sputtering of Ga and Er metal targets in nitrogen. The Er is incorporated into the GaN film as an optically active inclusion (not strictly a dopant). The incorporation of a rare-earth luminescent center, such as Er, by sputtering may be an alternative to ion-implantation for large-scale device applications. The analysis of such films is detailed below.
Experimental
The GaN films were grown in a system described in reference [Reference Gurumurugan, Chen, Harp, Jadwisienczak and Lozykowski3]. Typical growth parameters for these films were: deposition temperature, 800 K, nitrogen-argon ratio, 4:1, total gas pressure, 5 mTorr, power, 120 Watts for Ga and 5Watts for the Er target. Film thickness was typically 0.2-0.3 µm. The Rutherford backscattering, x-ray diffraction and optical bandgap measurements were made with the facilities as described in [Reference Gurumurugan, Chen, Harp, Jadwisienczak and Lozykowski3].
Samples were given isochronal thermal annealing treatments (duration 30 min) at different temperatures 800 K, 1100 K, 1250 K and 1350 K in N2 to optically activate the incorporated Er ions. The emission spectra presented are obtained from samples annealed 0.5 h at 1250 K in N2, which seems to be the optimal annealing temperature.
For the cathodoluminescence (CL) and PL measurements, the samples were mounted on a cold finger cooled by a closed-cycle helium cryostat operating in temperature ranges from 10 K to 335 K. PL was performed using a He-Cd (325 nm, operating in cw mode 8 mW) and N2 (337 nm, operating in pulse mode 1.3 mJ for PL kinetics measurement) lasers. The CL was excited by a 5 keV electron beam incident upon the sample at a 450 with an electron gun (Electroscan EG5 VSW) which was in a common vacuum (1×10⁻⁷ Torr) with the cryostat. The PL and CL emitted light was detected by a monochrometer (ISA Hr-320) and detected with a CCD camera (Princeton Instruments TEA-CCD-512TK).
Results
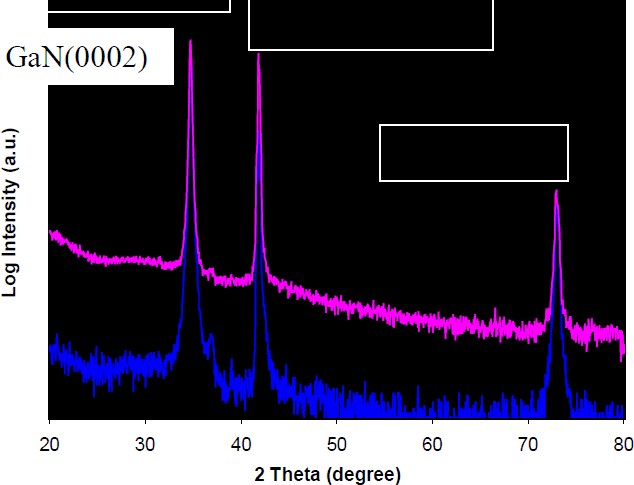
X-ray diffraction results for GaN:Er films grown on sapphire and silicon are shown in figures 1 and 2. In each case, the XRD spectrum typical for GaN c-axis normal to the substrate surface is observed, and no new or additional peaks are observed before or after annealing.
X-ray Diffraction spectra of Er-doped GaN films on Sapphire(0001). Top: annealed to 1250 K, Bottom: as grown, 800K.

X-ray Diffraction spectra of an Er-doped GaN film on Si(001).Top: annealed to 1250 K, Bottom: as grown, 800K.

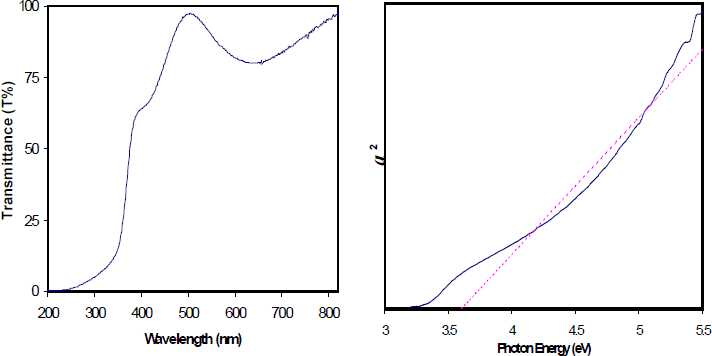
Figure 3 shows the optical bandgap measured for the GaN:Er films. The bandgap is measured by plotting the square of the absorption coefficient (α) versus the photon energy and extrapolating the linear portion of the curve to zero of the α2 axis.
GaN:Er film on sapphire. Right: solid curve, α2, dotted curve, linearization of the α2 plot. The bandgap is approximately 3.6 eV.

The films are transparent, and the optical bandgap determination shows the films to have a bandgap of about 3.6eV, so that the Er incorporation has little effect on the GaN bandgap. The results are shown in Figure 3.
The Erbium concentrations were determined by Rutherford backscattering spectroscopy, Figure 4, the ratio of Ga to N to Er in these films shows that the GaN films are stoichiometric, and that the Er concentration is about 1%.
RBS spectra of GaN and Er-doped GaN films. In the doped film, the Ga:N:Er ratio is measured to be 1:1: 0.011; i.e. about 1% Er

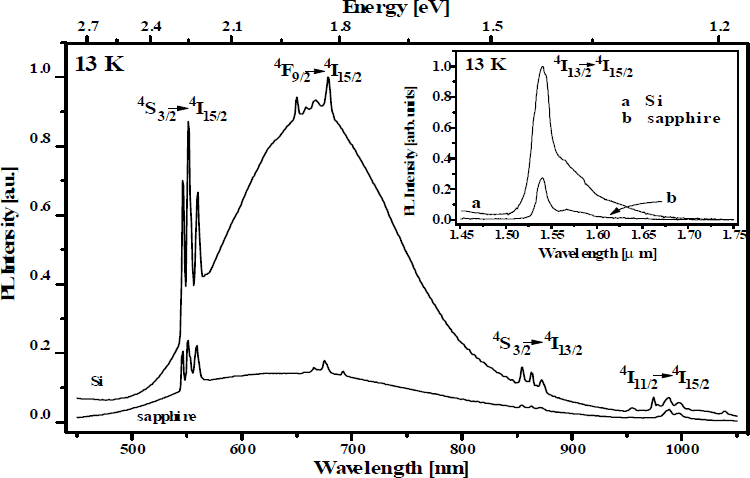
The PL spectrum in Figure 5 shows the "yellow band" on the silicon substrate to be more prominent. The green emission at about 550nm is split into several bands, indicating that the Er ions in these films are in several different locations in the crystal lattice. The IR band at 1543nm is more intense on the silicon substrate.
PL spectra of GaN:Er films on silicon and sapphire. Inset: Infrared emission in PL of GaN:Er films on silicon and sapphire. Spectra measured at 13 K

Figure 6 shows the dependence of the PL intensity on annealing temperature. The tendency for both substrates is similar, and the chioce of the optimal annealing temperature of 1250 K (950 °C) is clear from the data in the figure.
PL intensity for GaN:Er on silicon and sapphire as a function of temperature.

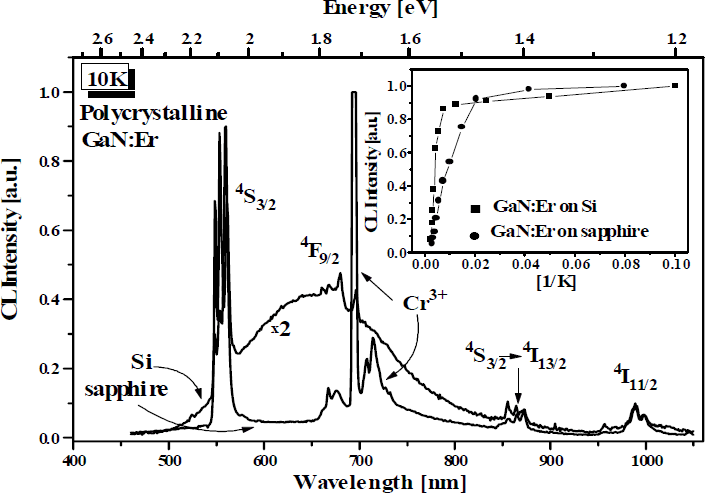
Figure 7 shows the CL spectra for the sputtered GaN:Er films on both silicon and sapphire substrates. The quenching of the green emission is very sharp, and is probably not due to quenching by other Er ions due to the low concentration of Er in these films.
CL spectra for GaN:Er on silicon and sapphire. Inset: thermal quenching of the green emission line, the Er 4S3/2 transition.

Conclusions
The PL and CL data show that reactively sputtered GaN thin films on silicon and sapphire with Er incorporated into the films during growth by co-sputtering of Er can result in films that show visible and IR emission after annealing in nitrogen. The sputtering process is a viable alternative to ion implantation.
Acknowledgements
We thank D.C. Ingram and G.R. Harp for their technical contributions. This work was supported by the Ballistic Missile Defense Organization through grant N00014-96-1-0782 monitored by the Office of Naval Research.