Introduction
Adjuvant whole breast irradiation (WBI) has been shown to improve local control and breast cancer mortality in patients treated with breast-conserving surgery (BCS) for invasive breast cancer.Reference Clarke, Collins and Darby 1 – Reference Veronesi, Cascinelli and Mariani 3 In the setting of breast conservation, The EORTC boost versus no boost trial has shown that escalating the radiotherapy dose to this high-risk area, in the form of tumour bed (TB) boost after WBI, further reduces the risk of local recurrence.Reference Vrieling, van Werkhoven and Maingon 4 As a result, TB boost has been routinely employed after BCS necessitating accurate TB localisation.
In earlier trials, pre-operative imaging, clinical findings and surgical reports were used for TB localisation.Reference Bartelink, Horiot and Poortmans 5 However, with the evolution of surgical techniques to optimise cosmesis in BCS, the geographic relationship between the TB and the scar has become less reliable.Reference Ozmen, Polat, Polat, Bonaventura, Johnson and Soran 6 This requires that the technique ofTB localisation for boost radiotherapy also evolves to optimise treatment of the TB and to minimise the impact on normal tissues. As a result, different modalities including breast ultrasound (US), computed tomography (CT) scan (seroma-guided) and more recently surgical clips inserted in the TB have been studied to enhance TB localisation for radiotherapy planning.Reference Hansen, de Winton, Guglani, Vamvakas, Willis and Chua 7
With further advances in breast surgery, oncoplastic breast surgery; surgery aims to improve the cosmetic outcome in breast cancer patients, who would otherwise have suffered from poor aesthetic outcome with standard BCS techniques, is now widely used. This improvement of aesthetic outcomes is achieved mainly through the elimination of distorting surgical cavities.Reference Macmillan and McCulley 8 The parenchymal rearrangement inherent to many of these techniques results in the TB being located at some distance from the skin incision and sometimes even relocated out of the original tumour quadrant into more than one quadrant of the breast. This poses a challenge to accurate TB localisation for radiotherapy planning in those patients.
The aim of this study was to investigate the modalities used for TB localisation after oncoplastic surgery in the target volume delineation process comparing the most commonly used techniques either based on clinical and radiological findings, that is clinically (by clinical identification of the TB guided by pre-operative imaging), breast US, CT guided by seroma or guided by surgical clips inserted into the TB at the time of surgery. The differences in the delineated volumes for each modality and how this impacted on target coverage and dose to normal tissue were also reported.
Material and Methods
This study was carried out at Kasr Al-Aini Center of Clinical Oncology & Nuclear Medicine (NEMROCK) by the the multidisciplinary team for breast cancer management at Kasr Al-Aini during the period between July and December 2014. In total, 27 patients were recruited according to inclusion and exclusion criteria after ethical approval gained by ethics committee of the department. Those were female patients below the age of 70 diagnosed with pathologically proven breast carcinoma, who were considered eligible if they had pathological stage T1–2, N0–N3 disease without distant metastases according to AJCC-TNM 7th edition 9 and were scheduled for unilateral breast conserving oncoplastic surgery with the placement of surgical clips (three clips as a minimum). Patients were excluded if they had multiple ipsilateral (in more than one quadrant, i.e., multicentric) or bilateral breast lesions.
Surgical technique
Eligible patients were operated under general anaesthesia for breast tumour excision aiming at a safety margin of 1–2 cm; the excised mass was assessed by frozen section after marking of the edges by sutures. TB or cavity was biopsied for assessment of its involvement with tumour cells to ascertain the achievement of negative margins. If both tumour mass edges and TB biopsies proved to be free of tumour, then the safety margin was confirmed. Tumour cavity was then marked by titanium clips insertion. Positioning of the clips was categorised as being placed within six different regions of the excision cavity: (1) superior; (2) inferior; (3) posterior; (4) anterior; (5) medial; and (6) lateral, one clip and if possible two were sutured to each cavity wall. The planned oncoplastic technique was then conducted after the clip insertion. Regarding surgical management of the axilla in this group of patients, clinically and US-positive axilla were treated by level 1 and 2 evacuations through a separate incision. For clinically and US negative axilla, sentinel lymph node (LN) excision was done using methylene blue dye. The LN was sent for frozen assessment and only if the sentinel LN proved to be positive, axillary LN evacuation was done.
Planning CT scan and contouring
Computed tomogrpahy acquisition was carried out for each patient 3–4 weeks post-operative in the treatment position, that is with the patient lying supine, on a chest board elevated at 10° with both hands grasping the middle column of the chest board allowing easy passage through the planning CT scanner. Multiple fine cuts of ≤5 mm thickness were then obtained from the chin to the upper abdomen, then transferred to the treatment planning system where target volume delineation, isocentre placement, beam placement, and treatment planning were performed. Breast wiring was added extending from 9 to 3 o’clock around the infra-mammary fold (to guide whole breast delineation) and another wire was placed around the clinically estimated TB—guided by history and pre-operative imaging.
Patients underwent breast US imaging 3–4 weeks post-operatively (on the same day of the planning CT scan) for detection of TB guided by operative changes seen on US. The site of the TB was marked on the skin (and referenced to the nipple) and the depth from skin was measured. A marker was put onto skin to define the site of depth measurement. Radiopaque marker was visualised at CT scan images as guidance for breast US-based TB localisation. Contouring was performed on all CT cuts using our institution guidelines to include outer body contour critical organs, (heart, lungs and spinal cord), whole breast clinical target volume (CTV) as well as lymph nodal CTV when required. Contouring process was done on CT planning scan using Varian Medical Eclipse Systems, Palo Alto, CA, USA, version 11.
Tumour bed contouring
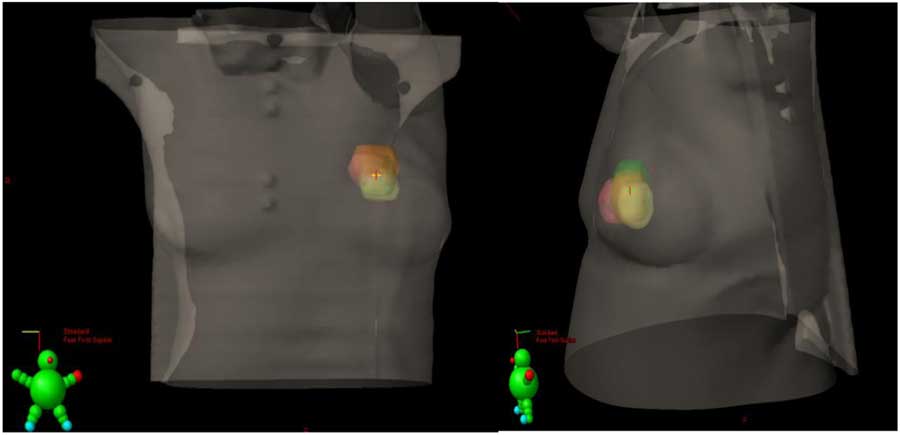
Tumour bed CTV was localised for contouring four times (Figure 1), that is once guided by each of the following modalities.
Anterior–posterior and lateral view of three-dimensional configuration of the four tumour bed volumes overlap; case no.6.

Clinically based
Delineation was done guided by the wire placed over the lumpectomy scar at the time of CT scanning.
CT based
Delineation was done guided by the seroma and/or operative changes detected on CT scan after tumour resection.
Ultrasound based
Delineation was done guided by the lead marker that was put on the skin during post-operative US and detected on the planning CT scan. For TB identification, geographic parameters given by the ultrasound operator, that is depth from lead marker on the skin to TB and distance from the nipple as well as detected TB size, were used to guide delineation of US-detected TB on planning CT scan.
Surgical clips
Delineation was done based on surgical clips that were individually identified and contoured to guide TB delineation.
Tumour bed planning target volume (PTV) was generated for each of the four contoured TBs by adding an automatic 3D margin of 0.5 cm. TB volumes were compared for each of the four TB contouring methods by (using the surgical clips-based TB contour as reference) regarding the:
1. volumetric differences between each TB volume (cm3),
2. ratio of TB PTV/breast volume,
3. maximum distance from the centre of the TB PTV to both the chest wall (MD-CW) and the skin,
4. shifts of TB location in comparison to boost delineated guided with clips in the three cardinal directions (X, Y and Z), and
5. indices for target coverage and percentage of normal tissue involved including:
∙ Overlap index: calculated for each boost PTV individually in comparison with PTV of TB boost delineated guided by surgical clips (control boost) using the following equation: overlap index=overlap volume÷[(control boost + experimental boost)/2]
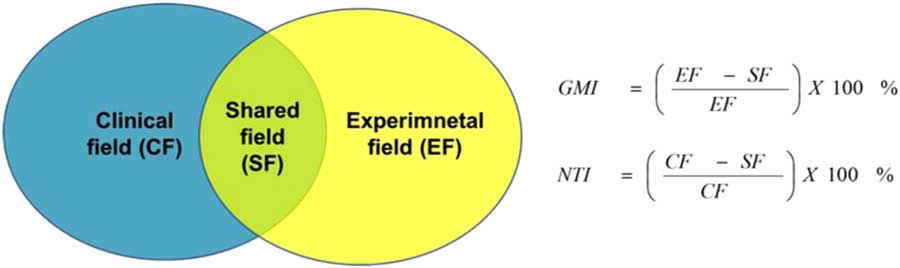
∙ The normal tissue index (NTI) (Figure 2): used to measure the percentage of each TB PTV which was not part of clips-guided PTV that received high-dose treatment.Reference Harrington, Harrison and Bayle 10 Therefore, it gives an estimate of the area of normal tissue, which would have been included unnecessarily in a boost field while not risk of local recurrence as defined by the position of the TB guided by surgical clips.
∙ The geographical miss index (GMI) (Figure 2): used to define the percentage of clips-guided TB PTV which was not predicted using each of the other modalities.Reference Harrington, Harrison and Bayle 10 This area represents tissue within the TB, at high risk of local recurrence, which would not have been treated in a boost field when TB localisation modalities other than clips are used. Such a geographical miss might be expected to contribute to an increased incidence of local recurrence.
Illustration of geogrpahical miss index (GMI) and normal tissue index (NTI) calculation.Reference Harrington, Harrison and Bayle 10

Statistical Methods
Data management and analysis were performed using Statistical Package for Social Sciences (SPSS) version 21. Comparisons between the different methods were done using the Friedman test. For each significant Friedman test, the Bonferonni correction was performed to adjust for the p-values. To measure the strength of association between the measurements, Spearman’s correlation coefficients were calculated.
Results
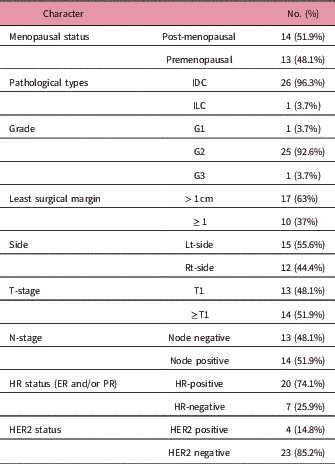
This study included 27 breast cancer patients who underwent oncoplastic breast-saving surgery with surgical clip insertion. Out of 27 patients, 15 patients (55.6%) had three to six clips inserted whereas 12 patients only (44.4%) had more than six clips inserted. The baseline patient and tumour characteristics are shown in Table 1.
Demographic and pathological characteristic of the patients

Abbreviations: ER, estrogen receptor; HR, hormonal receptors; IDC, invasive ductal carcinoma; ILC, invasive lobular carcinoma; PR, progesterone receptor; HER2, her 2 neu overexpression.
For the baseline dimensions, breast size was measured in terms of breast separation (ranged from 16.7 to 30.1 cm) and breast width (ranged from 3.6 to 11.7 cm), as most patients could not report their brassiere cup size.
As TB seroma was used for CT-guided TB contouring, seroma clarity grade of 0–5Reference Sharma, Spierer and Mutyala 11 was recorded for each patient. For 74.1% of the patients seroma was less than grade 3, whereas for 25.9% of the patients it was equal to or more than grade 3.
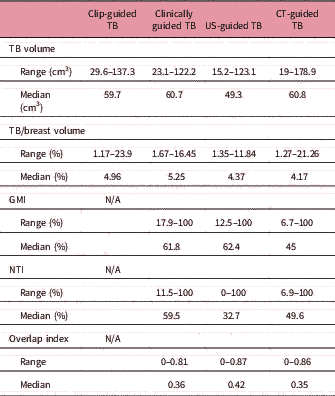
Tumor bed volumes were recorded for each modality and compared (Table 2). For surgical clips-guided median, TB volume was 59.7 cm3 (29.6–137.3 cm3). Median TB volume for clinical modality was 60.7 cm3 (23.1–122.2 cm3). Median value for CT TB volume was 60.8 cm3 (19–178.9 cm3), whereas for US-guided TB volume it was 49.3 cm3 (15.2–123.1 cm3). Median volumes of clinically, CT and US-guided TBs showed significant difference in comparison with clips-guided TB volume (p-value=0.026).
Comparisons of volumes and indices

Abbreviations: TB, tumour bed; US, ultrasound; CT, computed tomography.
The volume of each TB volume in relation to the whole breast volume was reported. Clips TB vol./breast vol. ranged from 1.17 to 23.9% with a median value of 4.96%, clinical TB vol./breast vol. ranged from 1.67 to 16.45% with a median value of 5.25%, CT TB vol./breast vol. ranged from 1.27 to 21.26% with a median value of 4.17% and US TB vol./breast vol. ranged from 1.35 to 11.84% with a median value of 4.37%. Comparison of the median value of clips TB vol./breast vol. with median values of clinical, CT and US TB vol./breast vol. showed a statistically significant difference (p-value=0.024).
The NTI-using clip-guided TB as reference for clinical TB ranged from 11.5 to 100% with a median value of 59.5% and a mean value of 60.7% (SD+/−29.7). NTI for CT TB ranged from 6.9 to 100% with a median value of 49.6% and a mean value of 50.8% (SD+/−31.7). NTI for US TB ranged from 0 to 100% with a median value of 32.7% and a mean value of 57.1% (SD+/−31.9). Comparative analysis of their NTI median values showed numerical difference, however it did not reach statistical significance (p-value=0.179).
The geographical miss index (GMI)-using clip-guided TB as reference for the clinical TB ranged from 17.9 to 100% with a median value of 61.8% and a mean value of 61.7(SD+/−27.8). GMI for CT TB ranged from 6.7 to 100% with a median value of 45 and a mean value of 51.1(SD+/−28.6). GMI for US TB ranged from 12.5 to 100 with a median value of 62.4% and a mean value of 63.1(SD+/−26.1). Comparative analysis of GMI median values for the three modalities showed significant difference (p-value =0.029).
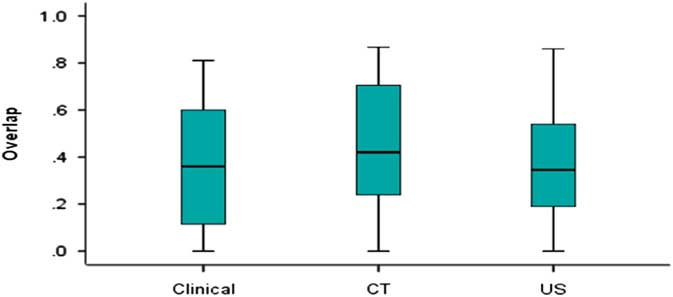
The overlap index to detect the overlap ratio between clips TB (control) and TB delineated guided with each other modality, was calculated. It ranged between 0 that indicated no overlap and 1 that indicated complete overlap. Clinical TB overlap index ranged from 0 to 0.81 with a median value of 0.36, CT TB overlap index ranged from 0 to 0.87 with a median value of 0.42 and US TB overlap index ranged from 0 to 0.86 with a median value of 0.35. The difference between overlap median values of the three experimental arms showed statistical significance (P value =0.04) ( Figure 3).
Box plot chart for the differences between the three methods of delineation [clinical, computed tomography (CT) and ultrasound (US)] regarding the overlap index.

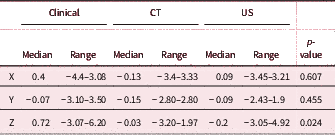
Additional measurements were made to assess the direction of the shift of each of the modalities used in comparison to clip-guided TB (Table 3), each TB centre shifts from clips TB centre was calculated in the three cardinal directions that is medio-lateral (X), vertical (Y) and longitudinal (Z). Clinical TB shift in the medio-lateral direction ranged from −4.4 cm to 3.08 cm with a median value of 0.4 and a mean value of 0.31 (SD+/−1.67). CT TB shift in the vertical direction ranged from −2.8 cm to 2.8 cm with a median value of −0.15 and a mean value of −0.29 (SD+/−1.14). US TB shift in the longitudinal shift ranged from −3.05 cm to 4.92 cm with a median value of −0.2 and a mean value of 0.2 (SD+/−1.77).
Dosimetric data for detecting the difference between the three methods of delineation (Clinical, CT and US) regarding their shifts from the clips centre

There is numerical difference between the three modalities regarding lateral and vertical shift median values, however these did not reach statistical significance. The most significant difference between the modalities was shown in the longitudinal direction with a p-value=0.024 (Table 3).
The most significant outcomes of the study were the GMI and overlap index. Statistical analysis for their correlation with relevant factors was done for each experimental arm separately. The correlation was done regarding: maximum tumour diameter done separately for BMI, breast separation, Ggade of seroma, clips TB volume, ratio of clips TB volume/breast volume, least distance from clips TB centre to the skin and least distance from clips TB centre to the chest wall.
Clinical TB least distance from the centre of clips TB to skin showed good correlation with GMI of the clinical TB by 0.649 with a significant p-value <0.001. Post-operative volume showed weak correlation with GMI by 0.412 of significant p- value=0.033. CT TB arm GMI outcome did not show any correlation with any of these factors that reached statistical significance. US-TB arm GMI outcome did not show any correlations with these factors that reached statistical significance.
Discussion
Oncoplastic BCS is a rapidly growing and developing field that leads to improved breast aesthetics in breast cancer patients undergoing breast-saving surgery. However, these surgical procedures further complicate the accuracy of TB localisation for radiation therapy planning. Thus, this study was conducted in an attempt to evaluate the accuracy of each of the most widely used TB localisation modalities, and surgical clips guided localisation was used as a comparator as many radiation oncologists consider it the gold standard method for TB localisation.Reference Schaverien, Stallard, Dodwell and Doughty 12 Nevertheless, many institutes do not routinely use surgical clips and will use other modalities for TB localisation, a situation which may be suboptimal, especially with the expected tissue displacement in most oncoplastic procedures, making standard TB cavity identification a real challenge.
Volumetric comparisons between median values of TB volume contoured by each modality was done and found to be significant (p-value=0.026), with the least difference detected between CT-based and clinical-based TB volumes, in comparison with clip-based TB volume. Another parameter used to detect the volumetric differences was the ratio of the TB volumes generated by each modality to whole breast volume and was found to be significantly different among modalities; 4.96% for clip-TB versus 5.25% for clinical-TB, 4.17% for CT-TB and 4.37% for US-TB. These differences are of great importance as they directly impact on the aesthetic outcome of patients after radiotherapy. These results mimic those reported by Kovner et al.Reference Kovner, Agay, Merimsky, Stadler, Klausner and Inbar 13 comparing surgical scar for TB localisation versus surgical clips, where average volume of scar-based boost was 1.38 times larger than the corresponding volumes defined by clips (p-value=0.001). Goldberg et al.Reference Goldberg, Prosnitz, Olson and Marks 14 also reported in their study comparing CT-defined TB to be 10.9 mm2 larger than that defined by surgical clips.
In this study, the greatest difference in TB volumes was found between the median values of US modality (49.3 cm3) and the clips-guided modality (59.7 cm3). The pair-wise comparisons showed that the numerical difference of US TB volume (49.3 cm3) versus clinical TB volume (50.7 cm3) reached statistical significance with a p-value=0.05. This sounds the findings reported by Ringash et al.Reference Ringash, Whelan and Elliott 15 in which 52 patients were planned post lumpectomy to compare diagnostic ultrasound to the ‘gold standard’ of surgical clips for localisation of the lumpectomy site for electron boost irradiation. In their study, the mean ultrasound volume was 24 cm3 and the mean clip volume was 38 cm3 (r=0.44; p=0.001).
Different indices were used on this study to compare the four modalities with the clips used as the comparator that is GMI, NTI and overlap index. The GMI represented the tissue within the TB, at high risk of local recurrence, which would not have been treated in the boost field if the test localisation modality was used in place of clips to guide TB delineation. The numerical differences between the median GMI of clinical modality (61.8%) versus CT modality (45%) versus US modality (62.4%) reached statistical significance of p-value=0.029 that showed CT modality with the least GMI (45%), however this is still significant percentage. Although the pair comparison done between each of them was not significant, the one done between US modality and CT modality was statistically significant (p-value=0.038).
In the study conducted by Harrington et al.Reference Harrington, Harrison and Bayle 10 on 50 patients in whom the excision cavity boundaries were marked by clips at surgery and the boost was planned to use clinical information to evaluate the difference between clinical and clips-guided TB localisation, authors showed that GMI is of a great significance; where in 8–24% of the patients more than half of the tissue at risk of local recurrence would not have been treated if a clinically directed boost field had not been applied. It was clear that reliance on the surgical scar, area of surgical induration, data on the pre-operative tumour location from the clinical case notes and mammography films, and the patients’ recollection of the position of the tumour did not supply information accurate enough to allow optimal localisation of the TB. The concluded impact of such geographical misses on the potential for local recurrence would probably depend largely on the extent of the miss. The median value for the GMI in their study reached up to 32.9%. In our study, the GMI for clinical TB volume was of a median value of 61.8%, a large difference compared to that in Harrington et al. This may be explained by the fact that our study was conducted on patients who had oncoplastic surgery where GMI using clinical data is expected to be greater compared with standard BCS without oncoplastic techniques.
Another index used in this study is the NTI which was used to give an estimate of the area of normal tissue, which would have been included unnecessarily and is not at risk of local recurrence but would however hinder aesthetic outcome. In this study, there was a numerical difference between NTI median values of the clinical modality (59.5%) versus the CT modality (49.6%) versus the US modality (62.3%); however, this difference did not reach statistical significance (p-value=0.179). Nevertheless, these differences give the impression that CT-guided TB delineation provided less unnecessary normal tissue receiving high dose of radiation compared with the other methods; however, the median value of NTI of CT modality was 49.6%, which is still quite high. Harrington et al.Reference Harrington, Harrison and Bayle 10 in their study showed that the median values of NTI were 14.6%, 13% and 9.7% for margins of 1, 2 and 3 cm, respectively, and that testifies to the fact that in most of cases a small amount of normal breast tissue is unnecessarily boosted to a high radiation dose. NTI for clinical TB volume in our study was of a median value of 59.5%, that is a large difference.
The shifts between the centre of clips TB and each of the experimental arms in the medio-lateral (X), vertical(Y) and longitudinal (Z) directions were also documented. Medio-lateral shift median value for the clinical modality was 0.4 cm versus −0.13 cm for the CT modality and 0.09 cm for the US modality. This numerical difference in shifts in the medio-lateral direction between the modalities did not reach the statistical significance (p-value=0.607); however, the median shift in that direction was in the favour of the US modality compared with the clinical and CT modalities. The vertical shift (anterior–posterior) median value for the clinical modality was −0.07 cm versus −0.15 cm for the CT modality and −0.09 cm for the US modality. This numerical difference in the vertical direction between the modalities did not reach the statistical significance (p-value= 0.455); however, the median shift in that direction was in favour of the clinical modality compared with the CT and US modalities. The longitudinal (superior–inferior) median value for the clinical modality was −0.72 cm versus −0.03 cm for the CT modality and −0.2 cm for the US modality. This numerical difference in the horizontal direction between the modalities reached statistical significance with a P-value=0.024. The median shift in that direction was in favour of the CT modality (−0.03) compared with clinical (0.72) and the US (−0.2) modalities.
These results show a large difference compared with those of the study published by Wong et al.Reference Wong, Muanza, Reynard, Robert, Barker and Sultanem 16 which was done to evaluate the feasibility and usefulness of a three-dimensional ultrasound (3D-US) image-guided system in identifying and tracking the TB for planning and daily localisation before radiation delivery for breast cancer. The study was done on 20 patients who had undergone breast-conservative treatment. It was shown that the mean centroid position of the TB on CT versus US differed by 0.1, 0.2 and 0.4 mm in the anterior–posterior, left–right and superior–inferior directions.
For the CT modality, factors affecting boost delineation were considered including the grade of seroma (according to British Columbia (BC) Cancer Agency) Reference Sharma, Spierer and Mutyala 11 and time from surgery to CT imaging (median time of 60 days in our study). However, grade of seroma and time from surgery to CT did not show any correlations of statistical significance; however, this may be due to the small size.
The study showed correlations of each modality with the least distance from clips TB centre to the skin that was of statistical significance; however, it did not show correlations with the least distance from clips TB centre to chest wall. GMI of the clinical modality showed good correlation with the distance from clips TB centre to the skin that was of statistical significance (r=0.649, p-value=0.001); however, CT and US modalities did not show correlation with it of statistical significance. Overlap index of the clinical modality showed also good correlation with least distance of clips TB centre to the skin that was of statistical significant (r=−0.628, p-value=<0.001). On the other hand, overlap index of the CT modality showed moderate correlation with the distance from clips TB centre to the skin that was of statistical significance (r=−0.435, p-value=0.023), and US TB arm overlap index also showed moderate correlation with the distance from clips TB centre to the skin that was of statistical significance (r=0.533, p-value=0.005).
Ippolito et al.Reference Ippolito, Trodella and Silipigni 17 in their study, found that the mid-distance to chest wall was <0.7 cm (MD-CW) and that was a predictor of an intersection volume >50% (CI=0.649–0.952; p<0.0001). It did not show correlations with distance to skin (Ippolito et al. 2014). That contrasted with our study in which there were no correlations of statistical significance with the distance from clips TB centre to the chest wall. That may due to the presence of at least one clip usually fixed posteriorly on the pectoralis fascia according to the protocol adopted by our breast surgery team, which leads to the inclusion of a portion of this area in the CTV and also the area of the breast tissue near the chest wall is less likely to experience a process of deformation over time post-operatively due to tissue remodelling.
Conclusion
At the end of this study, we conclude that with extensive remodelling of the breast tissue which is an inherent part of oncoplastic breast surgery techniques, clips-guided delineation of the TB should be the standard of care for TB localisation due to the significant GMI and shift of TB when other modalities of TB localisation are used. However, further studies should be conducted with a larger sample size to confirm these results. We also suggest that with the expanding use of oncoplastic techniques, studies addressing the role of the boost in this setting should also be re-evaluated.
The collaboration between the radiation oncologist and breast surgeons in this study encouraged surgeons to adopt surgical clips insertion in the TB after oncoplastic procedures as part of the routine practice to facilitate TB localisation post-operatively. This reflects the important role of the multidisciplinary team in improving the quality of care provided for breast cancer patients and in upgrading the technical skills of the involved physicians.
Acknowledgements
None.
Conflict of Interest
The authors declare that there are no conflicts of interest to disclose.