


Introduction
The link between the change in a glacier’s mass (the annual balance) and the local climate is relevant to reconstructing recent climatic history. The enduring chronology left by glaciers in the form of moraines, till, buried vegetation, and other ice-formed evidence is much longer and more reliable in many ways than man’s weather records; thus a climate–glacier model which will explain the behavior of glaciers in terms of meteorological variables conceivably could extend the climatic record back thousands of years. Consequently it may be possible, on the basis of a reconstructed climate record, to determine whether periodicities in climate exist. If patterns in past climates emerge, it may be possible to predict the climate on which the future well being of mankind is so delicately balanced. Because a glacier has unusual sensitivity to minute climatic perturbations it may strongly amplify these subtle changes, leaving a lasting geomorphic trace.
The existence and importance of past widespread glaciation were first recognized by Reference Agassiz and CarozziAgassiz (1840) and the direct connection of glaciers and climate was refined by Reference Matthes and MeinzerMatthes (1942) and Ahlmann (Reference Ahlmann1948, Reference Ahlmann1953). Later work by Nye (Reference Nye1960, Reference Nye1963), Reference Meier, Wright and FreyMeier (1965), and Reference HoinkesHoinkes (1968) demonstrates that a definite relationship exists between climate, energy exchange, mass balance, and the dynamic response of a glacier, and that the connecting links between these factors may explain the current behavior of glaciers in response to the climate of the present and recent past. The main problems in identifying these relationships are in determining how a glacier changes its mass due to measurable meteorological parameters, namely those producing winter snow accumulation and summer ablation of snow and ice, and in determining the mechanisms that relate a glacier’s change in mass to fluctuations of its extent–most prominently at its terminus.
Documenting these fluctuations and relating them to climate changes requires a long record of annual balance for many glaciers of various sizes, area–altitude distributions, and orientations, all within a single climatic region. In order to encompass many climate conditions and to have a sufficient statistical sample, at least 50 years of mass-balance measurements would seem to be necessary. Unfortunately, such a collection of data is not available. However, the North Cascades area of Washington offers an opportunity for supplying the information necessary to reconstruct long-term mass-balance records for the following reasons:
-
1. The North Cascades area is highly glacierized, with some drainages containing scores of glaciers of various sizes and orientations (Reference MeierPost and others, 1971).
-
2. Accurate records of stream flow have been collected from both glacier and non-glacier basins for over 50 years.
-
3. Records of precipitation and temperature are available from weather stations within this region for nearly 100 years.
-
4. Well-documented records of glacier distributions and fluctuations are available (Reference HubleyHubley, 1956; Reference JohnsonLaChapelle, 1960; Reference Meier and PostMeier and Post, 1962; Reference MeierMeier, 1964; Reference MillerMiller, 1967; Reference PostPost and others, 1971).
-
5. Detailed measurements of mass balance, run-off, accumulation, ablation, precipitation, temperature, and other glaciologic and meteorologic variables have been made continuously at one glacier (South Cascade) since 1958.
Two independent methods which relate long-term glacier balance with measured climatic variables are presented in this study. One is based on a run-off-precipitation (RP) model that determines annual balances in a large glacierized area in a North Cascades drainage basin (Thunder Creek), mainly by differences in run-off between this glacierized basin and a nearby, non-glacierized basin (South Fork Skykomish River). A linear relationship is then formed between the annual balance determined by the RP model and observed winter precipitation and summer temperatures at a low-altitude, long-established weather station by a precipitation–temperature (PT) model. These two models are not entirely independent because winter precipitation in the PT is related to annual precipitation in the RP model. This does not seriously affect the conclusions, chiefly because precipitation in the RP model is a minor component.
The second method is based on relating actual mass-balance measurements at South Cascade Glacier directly with precipitation and temperature observed at the same low-altitude weather station (the PT model).
A slight inaccuracy is introduced with these methods because glaciers change in size with time. Even when climatic conditions are identical, the mass balance of a glacier which is overextended tends to be more negative than the balance of a smaller, receded glacier. Also, the change in elevation of a glacier with time tends to produce a different mass balance with the same climate, so that the balance of an expanding glacier tends to be more positive and that of a shrinking glacier more negative, each year. This effect is termed the Bodvarsson instability (Reference BodvarssonBodvarsson, 1955). These relatively small changes in both extent and altitude are neglected in this preliminary model. The intent of this study is to examine only changes of glacier mass with time and not to attempt determination of the response to this mass variation. It is hoped that the mass-balance data provided here will also be useful to those interested in dynamic modeling.
Run-off-precipitation (RP) MODEL
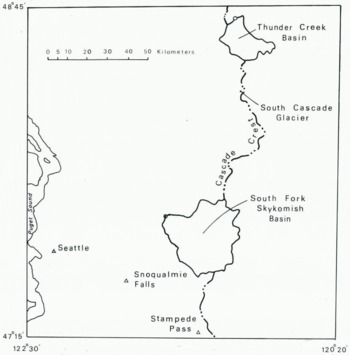
Two large drainages with long-term records of stream flow in the North Cascades are particularly well suited to an analysis of past glacier behavior. Thunder Creek is in a glacierized basin containing 51 glaciers that form a glacier cover of approximately 14.5% of the total area (38.6 km2). The South Fork Skykomish River is in a non-glacierized basin lying 75 km to the south (Figs 1 and 2). A preliminary version of a method to determine annual balances using these drainage basins has been described (Reference TangbornTangborn, 1968).
Location of South Cascade Glacier, the drainage basins, and the weather stations in the North Cascades that were used in the development of the climate–glacier model.
The Thunder Creek basin. This drainage is 272 km2 in area, has a mean altitude of 1558 m, and contains 51 glaciers with a total area of 39.4 km2 (14.5% of the total drainage area). The mean altitude of the glacierized area is 2120 m. Glacier boundaries are those of 1970, interpreted from aerial photographs by Austin Post.

The two mountain drainage basins used in this study are similar in most respects except that, chiefly because of differences in the distribution of area with altitude, one is glacierized and the other is not. If glacier cover were the only dissimilarity, differences in annual run-off would be attributed entirely to the loss or gain in mass of the glaciers in the Thunder Creek basin. However, apparent precipitation differences between the two basins make the following development necessary.
The hydrologic balance of each basin is:

and

where ΔS is the change in water storage (all forms), P the precipitation, R the run-off, and E the net evaporation–condensation; the suffices g and n refer to the glacierized and non-glacierized basins respectively.
The difference between ΔS g and ΔS n for any time period is the difference in the water balance for the two basins. When the variables are summed over one hydrologic year:


where S g and S n are annual balances for the two basins, respectively.
The annual balance of the non-glacierized basin (S n) is approximately equal to zero; the difference between basin balances (S g–S n) is then:

By assuming that the precipitation each basin receives is related to a single independent measurement of precipitation multiplied by a coefficient unique to that basin and by assuming that annual net evaporation–condensation is equal in these two basins, (Equation 5) can be simplified.
Then

and

where p a is annual precipitation measured at a valley station and M and N are coefficients representative of the two basins, respectively. Equation (5) now becomes:

The glacierized area of the Thunder Creek basin (currently 14.5% of the total area) is the chief source of annual water-balance variations, so S g divided by this fraction of the total basin area is equal to the annual balance, B a**, and average of all the glaciers in the basin:

where A f is the fraction of glacier cover.
The final expression can be simplified to

where B a, R n, R g, and p a are all hydrologic year (1 October–30 September) values.
A value for the coefficient k can be found if B a is known for a period of time greater than one year:

The period used for the calculation of K was 1947–61 because two of the larger glaciers (North and South Klawatti Glaciers) in this basin were mapped in September of 1947 and 1961 (Reference MeierMeier, 1966). The mass changes determined for these glaciers during this 14 year period (one gained 5.8 m of ice, the other lost 8.3 m) and the area–altitude distribution for each glacier has been used to calculate a distribution of balance with altitude that was consistent for both glaciers and a paper describing this work is in preparation by W. V. Tangborn, W. G. Sikonia, and M. F. Meier. Thus the large difference in mass change of the Klawatti Glaciers appears to be caused entirely by the difference in area–altitude distributions. The application of this same balance–altitude function to the area–altitude distribution of the combined glaciers in Thunder Creek basin showed a total mass change of –0.3 m for these glaciers during the 1947–61 period. A value of 0.305 for k was determined using (Equation 8).
The average value of A f during the 1947–61 period was 0.145 (Reference PostPost and others, 1971). As the final snow cover at the end of each ablation season is indistinguishable hydrologically from the glacier cover, A f is somewhat dependent on B a (if B a is very positive, A f will be greater than its average value). However, the error this produces is small because the quantity remaining is usually insignificant relative to glacier ice, and A f is assumed to be reasonably constant during the entire 1920–74 period.
The predicted annual balance for the Thunder Creek glaciers is then determined by:

Results for the 1920–74 period (for which run-off and precipitation data are available) are shown in Figure 3 (cumulative balance), and in Table I (column B a** (2)).
(Note: Values are in meters of water equivalent)

Cumulative balances for the Thunder Creek glaciers (upper curves) and South Cascade Glacier (lower curves) for the 1884–1974 period. The solid lines are cumulative annual balances derived from the precipitation–temperature model. The dashed curve for the Thunder Creek glaciers is from balances calculated by the run-off model. (1920–74). The dashed curve for South Cascade Glacier is from actual field measurements of annual balance (1958–74).

Precipitation–temperature (PT) model, Thunder Creek Glaciers
Precipitation and temperature have been measured and recorded by standard methods at a few sites throughout the world since the beginning of the eighteenth century (Reference ManleyManley, 1948; Reference BrooksBrooks, 1949). A glacier-balance model that incorporated only these easily measured variables would be useful for interpreting both past and current glacier behavior in relation to climate. In a study similar to this one, mass balances for Lednik IGAN in the Polar Urals have been estimated for the 1818–1962 period by calculations using meteorological data from the Syktyvkav weather station (Reference TroitskiyTroitskiy and others, 1966).
The weather station used in the North Cascades study, Snoqualmie Falls (Fig. 1), lies 125 km south-west of the Thunder Creek basin and 110 km south-west of South Cascade Glacier. Even though it is located some distance from these glaciers and at a much lower altitude (131 m), its unbroken record (1899–1974) and apparent good correlation with currently operated high-altitude and other lowland stations made it the only logical choice in this region. It was necessary to use two other lowland stations, Seattle and North Head (on the Pacific Coast) to extrapolate precipitation and temperature data for the period prior to 1899. The precipitation record was extended to 1884 by a linear regression of monthly values at this station to that observed at Seattle–a station which has been in continuous operation since 1884. The correlation between Snoqualmie Falls and Seattle is high for most winter months during the 1884–98 period, and the extrapolation of precipitation data to 1884 is considered quite accurate.
Extending the temperature record at Snoqualmie Falls was more difficult. The stations and period used are North Head (1884–1930) and Seattle (1893–1974). The procedure was first to extend the Seattle maximum and minimum monthly temperature records to 1884 by the parallel North Head–Seattle period of 1893–1930. Mean lapse-rates between the two stations were then used for each month to construct the missing Seattle record. The parallel 1899–1974 Seattle–Snoqualmie Falls period was then used to extend the Snoqualmie Falls record to 1884. In this way the maximum length of simultaneous temperature records was used for each of the three stations. The final result is a synthetic temperature record for Snoqualmie Falls, from 1884 to 1898, constructed from both North Head and Seattle data. The reliability of the data for this early period naturally is considered less than that observed during the 1899–1974 period.
The annual balance B a of a glacier is the end result of two large mass changes: B w, winter accumulation of snow, and B s, summer ablation of both ice and snow. In the North Cascades, balance is usually an order of magnitude less than either accumulation and ablation. High accuracy is therefore often difficult to obtain, even with detailed field measurements (Reference Meier, Wright and FreyMeier and Tangborn, 1965; Reference MeierMeier and others, 1971).
Total annual accumulation and ablation are not measured by these two models and current mass-balance terminology cannot be applied. The balance symbols used in the PT and RP models are similar in concept to those in standard terminology (UNESCO/IASH, 1970; Reference Mayo, Mayo, Meier and TangbornMayo and others, 1972). However, there are significant differences in the techniques used for obtaining balance values with the PT and RP models and those obtained by the usual field measurements. New symbols are necessary and the relationship between these and standard balance terminology are shown in Table II.

The dates (30 April and 30 September) which end the winter and summer seasons were chosen for this analysis on the basis of when accumulation and ablation are dominant at South Cascade Glacier: these are also the dates used in the Kårsa Glaciären study in Sweden (Reference WallénWallén, 1948).
Snowfall occurring at high altitudes in the North Cascades of Washington appears to be closely related to precipitation recorded at low-altitude valley stations (Reference Rasmussen and TangbornRasmussen and Tangborn, 1976; Reference Tangborn and RasmussenTangborn and Rasmussen, 1976). Although winter precipitation occurs mostly as rain at low altitudes, snowfall is dominant above 1500 m. Periods of heavy rainfall do occasionally occur during the October–April season at glacier altitudes; however, winter run-off in this region is negligible as shown by observations at the South Cascade Glacier gaging station–because of the refreezing of water within the cold snow-pack and the storage of liquid water within the glacier (Reference TangbornTangborn and others, [1975]).
Winter accumulation (the winter balance) on North Cascades glaciers is approximated by winter precipitation recorded at Snoqualmie Falls (p w):

From studies on South Cascade Glacier it has been found that an average of 35% of the winter accumulation on this glacier is derived by wind-drifting and avalanching of snow from the adjacent slopes (Reference TangbornTangborn and others, 1977). There is some indication that this additional nourishment is a function of actual snowfall, so that a winter of high precipitation produces correspondingly greater deposits of avalanched and drifted snow on the glacier surface than a winter of low precipitation.
Ablation from snow and ice surfaces is not easily measured accurately by direct means, and is extremely difficult to model from meteorological parameters, particularly over long periods of time (Reference LaChapelleLaChapelle, 1959; Reference HoinkesHoinkes, 1955; Reference PatersonPaterson, 1969; Reference HubleyHubley, 1957; Reference MeierMüller and Keeler, 1969). Summer snowfall has also been used as a variable in estimating ablation (Reference HoinkesHoinkes, 1968; Reference HoinkesHoinkes and others, 1968) but its use is only implicit in these models. Compared with several theoretical ablation models that have been developed, usually for a single point or small area on a glacier, the method described here is undeniably crude. Although an attempt has been made to develop a physically real system, the limitation imposed by using only measured temperature creates an unavoidably empirical means of estimating ablation. It is hoped that neglecting such important ablation factors as albedo and its changes with time, surface roughness, condensation, humidity, and wind is compensated for by the extreme simplicity of this method of estimating total ablation. Undoubtedly several of these factors are implicitly included by the use of air temperature as a variable. The fact that temperature appears to be closely related to ablation is probably caused more by the similarity of air temperature and ablation as functions of the energy processes producing ablation and air warming–namely the radiation balance–than by any direct effects.
Two main components of ablation energy were approximated in this approach: convective, which is primarily the turbulent energy exchange between the air and snow surface and the heat energy released by condensation (both are assumed to be related to mean air temperature) ; and radiative, which includes both incoming solar radiation and the net exchange of long-wave radiation between the snow and ice surface and the sky. Both radiation components depend on sky cover, but they are of opposite sign with regard to ablation. The part of total summer ablation caused by convective forms is designated B h, and that caused by radiative forms by B r, so that the summer balance B s* is the sum of both:

B h is estimated by mean air temperature during the summer (May–September season):

where C 1 and C 2 are coefficients and T s is equal to the average of the mean monthly temperature at Snoqualmie Falls. It should be emphasized that this relationship is not one of cause and effect; that is, air temperature by itself is not a significant force in producing ablation but is an index of other forms of energy.
B r is approximated by a linear relation to mean cloud cover, n:

Cloud-cover observations in the North Cascades are limited to those at Stampede Pass, 150 km south of the Thunder Creek basin, beginning in 1948 and continuing to the present day. The brevity of this record precludes the direct use of these data for ablation modeling over a long period of time.
A relationship between mean monthly cloud cover at Stampede Pass and the spread between the mean monthly maximum and mean monthly minimum temperatures (ΔT) at Snoqualmie Falls is shown in Figure 4. There is an obvious physical basis for such good agreement between temperature spread and cloud cover. The monthly means of maximum and minimum temperatures are derived from the average of the observed daily maxima and minima. Thus, from meteorological considerations it can be reasoned that daytime warming and night-time cooling due to cloud cover strongly affect the temperature range. Precedence for such a concept has been given in other studies (Reference ÅngströmÅngström, 1925; U.S. Army. Corps of Engineers, 1956, p. 238; Reference GeigerGeiger, 1961). In the North Cascades a better relationship between observed cloud cover and temperature results when the mean monthly range is used instead of either the minimum or maximum. Based on this relationship, the mean cloud cover for each May–September season extending back to 1884 was estimated (Fig. 5) and used in the balance model. The higher-than-average apparent cloud cover since about 1952, which is quite striking, appears to be related to the more stable glacier balances during the 1952–74 period.
The relation between monthly mean cloud cover at Stampede Pass and the range between the mean monthly maximum and minimum temperatures at Snoqualmie Falls. Cloud cover is an average based on six observations per day, and temperatures are an average of daily maximum and minimum observations. The correlation coefficient for this sample is 0.87. The period used was 1958–73.

Annual values of mean summer (May–September) temperature at Snoqualmie Falls ( T s), and mean summer cloudcover fraction at Stampede Pass (n) (based on the relationship between cloud cover at Stampede Pass and temperature at Snoqualmie Falls). Winter (October–April) balance (Bw*) is for South Cascade Glacier, based on winter precipitation at Snoqualmie Falls. The summer balance is that determined by the PT model for South Cascade Glacier and the Thunder Creek glaciers. The mean value of each variable (except annual balances) is given for the period 1884–1974. Positive deviations from this mean are shaded.

A function can now be formed that implicitly includes cloud cover and relates summer balance to maximum and minimum summer temperatures:

and the final equation relating annual glacier balance to winter precipitation and summer temperature is an equation which can be solved by multiple linear regression techniques:

where B a** is the annual balance for the Thunder Creek glaciers calculated with the RP model, p w is the total winter precipitation, T s is the mean summer temperature, and ΔT s the mean monthly range of daily temperatures at Snoqualmie Falls. The statistical results, when B a determined by the run-off model is fit with these variables, are given in Table III.

Some physical meaning is present in (Equation 14), as the values obtained by an unconstrained, least-squares fit between these variables and annual balances appear to have significance. The value determined for α indicates an average winter accumulation of 3.5 m, which appears reasonable compared to measured values on other glaciers in this region. The values for the coefficients β and σ give some indication of the relative influence of the convective and radiative components. The t value, another statistical means of assessing the weight of each factor, indicates that winter precipitation is the most influential, and cloud cover the least, in determining balance. The mean temperature coefficient is about three times that of the temperature-spread coefficient (the averages for T s and ΔT s are nearly equal, so that the relative size of each coefficient is significant). The negative sign of the radiative coefficient signifies that ablation energy from radiation sources is inversely proportional to cloud cover. This finding appears to disagree with the results of two other studies (Reference HolmgrenHolmgren, 1971; Reference AmbachAmbach, 1974) which show that long-wave radiation is a stronger factor in snow and ice ablation than is incoming short-wave isolation; thus ablation increases with cloudiness. However, both of these studies were conducted on high-altitude ice caps, and the conclusion is reached that long-wave radiation is more influential only when the albedo is greater than 0.75, which is higher than the mean summer albedo of 0.60 for these glaciers (Reference MeierMeier, 1966). It does agree with other findings that show ablation decreasing with increasing cloudiness (Reference WallénWallén, 1948; Reference LaChapelleLaChapelle, 1959).
A significant amount of interdependence probably exists between T s and ΔT s, and the conclusions given here may be very tenuous. In addition, temperature and precipitation tend to be inversely correlated (cool and wet or warm and dry weather often coincide), so that complete independence between accumulation and ablation calculations is not possible. As the PT and RP models are not independent, the prediction accuracy of either model by a direct comparison of B a* and B a** cannot be determined. The annual balances of the Thunder Creek glaciers for the 1920–74 period (RP model) and for the 1884–1974 period (PT model) are given in Table I and Figure 5.
Application to South Cascade Glacier
An independent test of the PT model was made by applying (Equation 14) and fitting precipitation and temperature values from the same low-altitude station to annual balance measured by field techniques at South Cascade Glacier during the 1958–74 period (Table I, B a(4)).
The results for the multiple-regression coefficients given by (Equation 14) are:

with a standard error of estimate for B a** of 0.43 m (Table I, B a**(3), and Fig. 6).
Measured (horizontal axis) versus predicted (vertical axis) annual balances for South Cascade Glacier for the 1958–74 period. The standard error limits for both methods are given for each determination of balance.

The precipitation coefficient is slightly larger than, and the ablation coefficients are nearly equal to, those given for the Thunder Creek glaciers. The independently estimated 1910–67 winter balance for South Cascade Glacier (based partly on actual measurements), is 3.1 m (Reference TangbornTangborn and others, 1977); the value given by the PT model (3.2 m) is only slightly larger. The mean measured winter balance for the 1966–74 period is 3.1 m, while that given by this model for the same period is 3.6 m.
The apparently greater influence of mean temperature over cloud cover on summer ablation may or may not be real. It seems reasonable that the higher-altitude Thunder Creek glaciers, located on the east side of the main Cascade Crest, may be more influenced by cloud-cover variations than is South Cascade Glacier, which is less exposed to direct insolation.
Balance history (1884–1974)
The cumulative mass balance of both the Thunder Creek glaciers and South Cascade Glacier can now be calculated with the PT model using standard precipitation and temperature observations. Results for the past 91 years are shown in Figures 3 and 5. The mass change of the Thunder Creek glaciers since 1920 given by the RP model is also shown (dashed), and the measured mass balance, cumulative since 1958, is shown (dashed) for South Cascade Glacier.
Several points of interest on these graphs can be elaborated:
-
1. The difference in trend between Thunder Creek and South Cascade Glacier can be explained by the difference in mean altitude (Thunder Creek glaciers, altitude = 2120 m, South Cascade, altitude = 1925 m). The more negative balances on South Cascade Glacier are probably due more to the increase in ablation with decreasing altitude than to any differences in winter snow accumulation.
-
2. Short-lived growth occurred between 1947 and 1955. This understandably prompted speculation about a possible rejuvenation of Pacific Northwest glaciers (Reference HubleyHubley, 1956; Reference HarrisonHarrison, 1956; Reference LaChapelleLaChapelle, 1960). The reversal from the hundred-year period of drastic glacier shrinkage was first detected in 1946 by a slight thickening on the upper profile of Nisqually Glacier (Reference JohnsonJohnson, 1960).
-
3. There is evidence that the retreat of Nisqually Glacier on Mount Rainier was halted for a few years around the turn of the century (Reference HarrisonHarrison, 1954). The 1890 advance of South Cascade Glacier disclosed by moraine-dating techniques (Reference MeierMeier, 1964; Reference MillerMiller, 1967) appears to be confirmed by the maximum shown here at the end of the nineteenth century. An interruption of the marked, half-century recession of glaciers in the Alps in the 1890s is well known (Reference HoinkesHoinkes, 1955). However, neither these results or nor other North Cascades studies (Reference MillerMiller, 1967) show a period of glacier advances in the early 1920s, such as occurred in the Alps and Norway.
-
4. The phenomenal loss of mass between 1900 and 1945 has been observed for nearly all glaciers throughout the world (Reference AhlmannAhlmann, 1948; Reference HoinkesHoinkes, 1955; Reference KasserKasser, 1959; Reference SchyttSchytt, 1959; Reference Grosval’d and KotlyakovGrosval’d and Kotlyakov, 1969). A corresponding rise in air temperature in the northern latitudes in the 1890–1940 period is well established (Reference LandsbergLandsberg, 1949; Reference Mitchell and SingerMitchell, [c1970]).
-
5. The four-year period of growth following 1932 has been verified by observations in both Washington and California (Reference Matthes and MeinzerMatthes, 1942; Reference HarrisonHarrison, 1964).
Sensitivity of mass balance to precipitation and temperature
An advantage of a climate–glacier balance model that requires only elementary meteorological observations is that an assessment of past (and perhaps future) climatic conditions that affect man is possible. Both the precipitation and temperature variables used in the PT model are basic geophysical parameters upon which the survival of plant and animal species of the Earth depends. Moderate changes in either can cause economic hardships or even disastrous famines–particularly in regions that are on the borderline of consistently successful food production (Reference KuklaKukla, unpublished; Reference Schneider and MesirowSchneider, 1976). Some of the serious food shortages in Europe recorded in medieval times were related to abnormal meteorological conditions (usually cold summers) which coincided with pronounced glacier advances (Reference Ladurie and BrayLadurie, [c1967]).
By holding two of the three variables ( p w, T s, and ΔT s) constant and allowing the third to fluctuate, it is possible to examine the sensitivity of glacier balance to each. In order to compare the relative influence of each conveniently, the standard deviation from the 1920–74 mean was used to scale each variable (Fig. 7). In this way the slope of the line relating balance to precipitation and temperature is a means of determining relative sensitivity. The standard deviation is also useful to test the absolute effect of each factor that determines mass balance. If significant changes in balance (for example, a change in trend from negative to positive) occur within one standard deviation from the mean of each variable, this suggests that large-scale changes in glacier mass could easily take place with a barely perceptible climate change.
Sensitivity of annual balance of the Thunder Creek glaciers to the three main climate variables that are related to glacier mass changes. Cloud-cover fraction (upper), related to the difference between mean summer maximum and minimum temperatures at Snoqualmie Falls, appears to be less important than meam summer temperatures (middle), adjusted to mean glacier altitude by an observed summer lapse rate of 0.4 deg/100 m, and winter precipitation (lower). The mean and standard deviation (SD) of each variable are given so that direct comparisons of the significance of each variable can be made.

These results demonstrate that mean summer temperature in the North Cascades would need to have decreased by only 0.5 deg, or winter snow accumulation on these glaciers to have increased by only 10% of the 1920–74 average (350 mm), to have made the balance of the Thunder Creek glaciers continuously positive during this period of extreme glacier recession. A trend toward both cooler and wetter weather would require even less change in these variables to cause glacier growth. It should be noted that continued glacier growth at these high altitudes does not necessarily mean indefinite growth at all altitudes. There would be an equilibrium position for each climatic situation, and a slightly renewed growth condition would soon be stabilized as the glaciers advanced to lower altitudes.
Another way of viewing the responsiveness of glaciers to climate is to examine the conditions when these glaciers are in three different modes of activity for similar time periods (Table IV). Based on the average of each variable during these diverse periods of glacier activity, it appears that extremely small departures from climate conditions prevalent during a period of stability are needed for rapid and large-scale changes in glacier size in this region. The transformation from an expanding to a shrinking glacier, and vice versa, requires a slightly greater change in climate.

Conclusions
Weather records from low-altitude stations can be used to estimate accumulation, ablation, and mass balance of glaciers in the North Cascades. These climate–glacier relationships (which it may be possible to determine in some other regions of the Earth by the same method) are useful in extending glacier balance records back in time and for relating the response of glaciers to climate more precisely. The next obvious step would be to use these climate–glacier relationships to extend the climate record back several thousand years by using known glacier fluctuations determined by moraines and other datable evidence. This information would be of value to those interested in climate change and especially for such purposes as predicting the Earth’s potential food production on the basis of both current and past climates.



