




No CrossRef data available.
Economic Globalization, the Macro Economy, and Reversals of Welfare: Expansion in Affluent Democracies, 1978–94
Published online by Cambridge University Press: 09 August 2005
Abstract
A key question in debates over globalization is its effect on the welfare states in particular on welfare “retrenchments”: programmatic retractions of the scope and coverage of social programs. We conceptualize such retrenchments as discrete policy events; and we offer a comprehensive model of their occurrence that integrates domestic economic, political, and institutional factors as well as those related to the global economy. Our analysis of all such retrenchments in Organization for Economic Cooperation and Development (OECD) nations between 1978 and 1994 indicates that the effects of globalization are complex, with trade openness and financial liberalization clearly operating against such retrenchments but outward foreign direct investment perhaps pressuring for them. In addition, we uncover support for a dynamic of “self-limiting immoderation”: economic and demographic pressures for costly welfare expenditures provoke actions to roll back eligibility and benefit rates that link increasing numbers of unemployed and retired persons to increased social spending. In short, the same demographic pressures that gave often been noted to substantially drive welfare spending may trigger welfare cutbacks.Our thanks to A. A. Alderson, Bob Jackman, Lane Kenworthy, Joakim Palme, Duane Swank, John Stephen, and two anonymous reviewers for their helpful comments and discussions, as well as to Kendralin Freedman for her work preparing the final manuscript. All remaining errors are our own. Previous versions of this article were presented at the Annual Meetings of the American Political Science Association and the American Sociological Association. The views expressed herein are those of the authors and do not reflect the opinions of the National Science Foundation or the U.S. government. All data and commands necessary to replicate the analyses presented here are available at our Web site 〈http://polisci.emory.edu/zorn/HZ/index.html〉.
Information
- Type
- Research Article
- Information
- Copyright
- © 2005 The IO Foundation and Cambridge University Press
Economic theorizing and journalistic reporting have for some time claimed that globalization has, of necessity, forced welfare states to contract; and some recent political science research has reinforced the claim.1
At the same time, much research on affluent democratic welfare states contests this claim on the basis of findings indicating that globalization expands welfare spending.2See Rodrik 1997 and 1998; Boix 2001; Garrett 1998a and 1998b; Huber and Stephens 2001; and Swank 2002.
See, for example, Esping-Andersen 1999; Huber and Stephens 2001; and Swank 2002.
The underlying reason for these varying results lies in the complexity of their effects. In particular, the causes of sudden reversal in the trajectories of policy outputs may differ from those causes that, period after period, have tended to drive up those outputs that retrenchment drives down. For example, Western finds that that high strike activity is both conducive to high union density and “union decline” defined in terms of reversals in the growth of union density.4
Western 1997, chaps. 7, 11.
We suggest that international factors such as trade openness and foreign investment—as well as certain domestic influences—are free to relate one way to typical variations in a policy outcome and another way to occasional reversals in its movement. This is the case for several reasons. For one, a given variable may affect policy via more than one mechanism: increases in unemployment, for example, may expand welfare spending by driving up the number of beneficiaries of unemployment compensation programs, yet dampen spending by motivating policymakers to constrict aspects of unemployment compensation policy (for example, by limiting program eligibility, cutting program benefits, or shortening the maximum period for benefit reception). Second, indicators of entitlements to and demands for welfare benefits—for example, unemployment rates—may be involved in what we dub the “paradox of self-limiting immoderation.” That is, factors that promote social policy outputs may, by doing so excessively and in ways that aggravate the policy's negative by-products (for example, high costs, fiscal strain, and work disincentives), build up pressures for unsustainable rates of spending growth that switch over into pressures for spending cuts. Finally, variables may affect policy with varying degrees of immediacy or directness. For example, not only may unemployment cue decisions to retrench; deindustrialization may, by triggering such consequences as rising unemployment, promote retrenchments (such as spending and deficit reduction) that are aimed at economic stimulation.
In short, our solution to the theoretical puzzle posed by claims that certain factors found to drive up welfare spending also spur retrenchments is this: some forces simply put enough pressure on rates of welfare outputs for them to become unsustainable to the point where the same forces eventually begin motivating policymakers to cut back on policy outlays. In this way, single variables may have multiple consequences. As we describe below, these dynamics are particularly acute in the case of influences relating to societal aging, rising and downwardly sticky unemployment, and globalization. More broadly, we assert that a more nuanced theoretical consideration of the relationship between transnational economic influences and domestic welfare policy can reconcile some competing claims.
The plan of our article is as follows. We begin by discussing, in general terms, the political economy of welfare retrenchments, with particular attention to the potential influence of globalization on domestic social welfare programs. We next outline our corresponding expectations regarding the influence of factors related to economic and demographic changes, and domestic political institutions on the incidence of welfare retrenchments. We describe the data on which we examine those expectations. Finally, we analyze both retrenchments as discrete events and more conventional, continuous measures of welfare effort; in doing so, we are able to untangle the contradictory claims of previous analysts regarding the influence of globalization on domestic social policy.
Globalization matters: openness to trade and portfolio capital flows work against retrenchment, but there is some indication that outflows of foreign direct investment (FDI) work for it. The domestic economy matters as well: need—in the form of unemployment, societal aging, and deindustrialization—tends to promote retrenchments, while productive and expansive aggregate economic performance, as indicated by measures of economic affluence and growth inhibits it. Political institutions—inclusive electoral institutions (such as proportional representation), neocorporatism, and, above all, power-dispersing institutions (like federalism)—also play a role, as do more overtly political factors such as left-party control of government. Taken as a whole, our findings present a picture of welfare retrenchments that is both comprehensive and complex.
The Political Economy of Welfare Retrenchment
The concept of welfare “retrenchment” most commonly refers to what Pierson has termed “programmatic retrenchments.”7
The fact of moderate amounts of welfare retrenchment, cuts, or calibrating reform is now clearly demonstrated in the qualitative studies of Pierson 1994, 1996, and 2001b; and Scharpf and Schmidt 2000; and in the quantitative work of Hicks 1999; Scharpf and Schmidt 2000b; and, above all, Korpi and Palme 2003, 433. Swank 2002 finds that governments have “restructured social policy to a degree, adapting to crises and long-term pressures with widespread yet limited retrenchments of social spending and modest extensions of social welfare provision.” This is so even though some quantitative studies, despite a wealth of qualitative evidence of welfare cutbacks, have cast doubt on the reality of welfare retrenchment. See Pierson 1994 and 1996; Esping-Andersen 1999; Myles and Pierson 1997; Huber and Stephens 1998; Iversen and Cusack 2000; and Fligstein 2002.
Globalization
Perhaps the most debated of the several sets of explanations currently considered is that stressing globalization. The most publicized variant of globalization thinking about retrenchment is the “competitive” view, in which globalization pressures for reduced state spending and revenue costs (and thus reduced “market distortions”) in national economies increasingly open to global markets.9
See Krugman 1995; Greider 1997; and Friedman 2000.
See, for example, Williamson 1990, 7–20.
For competition, see Garrett and Mitchell 2001; Burgoon 2001; and Korpi and Palme 2003. For compensation, see Garrett 1998a and 1998b; and Swank 2002. For combinations, see Rodrik 1997 and 1998; Hicks 1999; Swank 2002; and Korpi and Palme 2003.
Both theoretical arguments and empirical evidence are best discussed in terms of specific aspects and indicators of globalization. We focus on three: trade openness; openness involving flows, in particular outward flows, of FDI; and financial liberalization.12
For trade openness, see Cameron 1978; Garrett 1998a and 1998b; and Swank 2002. For FDI, see Hicks 1999; and Swank 2002. For financial liberalization, see Quinn 1997; and Swank 2002.
See Quinn 1997; Hicks 1999; and Swank 2002.
While recognizing the increasing attention given to more recently affluent democracies such as Portugal and Spain (see, for example, Franzese 2002), we confine our attention to the eighteen affluent nations, listed in Table 1, that have been democracies since the mid-twentieth century and the foci of most quantitative analyses of affluent democratic welfare states into the first years of the current century. See, for example, Hicks 1999; Huber and Stephens 2001; and Swank 2002. We do not address retrenchment elsewhere. For details, see Hicks and Esping-Andersen 2005, 5.

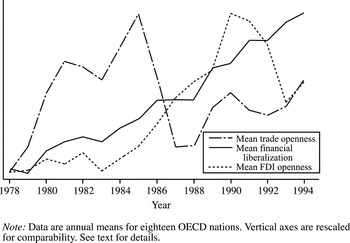
Annual OECD means for trade openness, outward FDI, and financial liberalization, 1978–94
In using theories of globalization and the welfare state, it is best to proceed with an eye to each of these three separate facets of globalization, alert to the countervailing expectations of the “competitive” and “compensation” perspectives, and to the alternative hypotheses that they imply. It is also useful to bear in mind the general rule that a straightforward reading of the competitive and compensation theses would state that what promotes (inhibits) social spending under a given theory inhibits (promotes) welfare retrenchment under that theory.
With respect to trade openness, both “competitive” and “compensation” expectations have been applied to the study of welfare spending, and the findings have been mixed. Garrett, Hicks, Swank, and Ploemper, Troeger, and Manow provide evidence in support of the compensation prediction (that is, positive effects of openness on welfare spending), whereas Garrett and Mitchell, Burgoon, and Korpi and Palme report findings in support of the competitive prediction of negative effects on spending; still others have found evidence of mixed effects, as well as no effects at all.15
For evidence of competition, see Garrett 1998a and 1998b; Hicks 1999, chap. 7; Swank 2002; and Ploemper, Troeger, and Manow forthcoming. For evidence of compensation, see Garrett and Mitchell 2001; Burgoon 2001; Korpi and Palme 2003. For evidence of mixed efforts, see Rodrik 1997 and 1998; Hicks 1999, chap. 7. For evidence of no effect, see Huber and Stephens 2001; and Franzese 2002.
Inquiries into the consequences of FDI have used both outward and total (inward plus outward) FDI flows as shares of GDP,17
See Hicks 1999; Garrett and Mitchell 2001; Burgoon 2001; Huber and Stephens 2001; Swank 2002; Bradley et al. 2003; and Moller et al. 2003.
Hicks 1999, chap. 5.
With respect to financial liberalization, the weight of evidence in Swank and Korpi and Palme20
See Swank 2002; and Korpi and Palme 2003;
Domestic Economic/Demographic Pressures
Demographic pressures include not only direct influences such as unemployment and societal aging, but also public fiscal imbalances, deindustrialization, levels of economic affluence, and rates of economic growth.22
See Hicks and Misra 1993; Huber, Ragin, and Stephens 1993; Esping-Andersen 1999; Hicks 1999; Iversen and Cusack 2000; Swank 2002; and Korpi and Palme 2003.
See, for example, Esping-Andersen 1999, 2–3; Hicks 1999, chap. 7; Huber and Stephens 2001, chap. 6–7; and Swank 2002.
As we noted earlier, such aspects of social need and social entitlement as unemployment and old age have been shown to promote welfare effort.24
See Hicks 1999; Iversen and Cusack 2000; Pierson 2001a and 2001b; and Huber and Stephens 2001.
See Hicks and Misra 1993; and Pierson 1996.
In our data, the zero-order Pearson correlation between unemployment and welfare effort is 0.20, and that between changes in unemployment and welfare effort is 0.47; the corresponding correlation between our measures of the elderly population and welfare effort is 0.67.
Yet the matter may be more complex than this. Swank writes of large welfare state systems that “rapid rises in unemployment and long-lived joblessness at substantial levels create unsustainable fiscal burdens on unemployment compensation, social assistance, early retirement (and often disability) pensions, and active labor market policies.”27
Swank 2002, 265.
In one scenario, illustrative of these demographic pressures, unemployment and societal aging—often seen as aspects of the “need” for social insurance—increase so precipitously and to such high levels of late that, by triggering costly entitlements and corresponding taxes (or deficits), they impose powerful imperatives for fiscal cutbacks in social outlays.29
See Esping-Andersen 1999; Feldstein 1998; Gordon 1998; Hicks 1999, chap. 6; and Huber and Stephens 2001, chap. 6–7.
The consequence of this widely regarded scenario for policy action is that demographic pressures for costly welfare expenditure at some point provoke action to roll back the eligibility and benefit rates that link increases in numbers of unemployed and retired persons to increased social spending. In short, the same demographic pressures that generate welfare spending provoke welfare cutbacks. This may occur because observed spending has become excessive, because its excessive growth is feared, or simply because spending cuts are seen as a means of redressing negative by-products of demographic pressures. In light of this view, we hypothesize that shares of unemployed in labor forces and of the elderly in populations will tend to promote welfare retrenchment.
Unemployment and aging aside, a host of other economic and demographic factors appear to affect welfare policy. By the straightforward logic that what has one effect on welfare spending has the opposite on welfare retrenchment, these factors are prospective causes of retrenchment. For example, economic affluence, less a pressure than a resource, is expected to diminish pressure for retrenchment and thus to inhibit it, as is its corollary, economic growth. In a parallel vein, Iversen and Cusack32
See Iversen and Cusack 2000; and Iversen 2001.
Finally, domestic budgetary factors may also affect the incidence of welfare retrenchments. National public deficits/surpluses—which stimulate price inflation, threaten foreign account balances, and snowball as accumulating debt—have been argued to exert strong pressures for spending rollbacks. Thus we hypothesize that budget deficits will promote retrenchment. Similarly, social spending levels, as often large and controversial components of public spending (and deficit) expansion, have sometimes become self-limiting.33
For national public deficit pressure, see Scharpf 1999. For self-limiting social spending, see Flora 1986; and Garrett 1998b.
Welfare effort, both the prevalent measure of welfare spending and an apt measure of the societal cost of welfare policy, has the same numerator as our measure of per capita welfare spending, reversals in which we use to identify retrenchment events; thus, it risks artifactual association with these events. In particular, as retrenchments entail falls from previous levels of welfare spending, lagged measures of welfare spending are likely to correlate negatively with subsequent retrenchments. See, for example, Flora 1986. Also, welfare effort alone is unlikely to capture all aspects of social spending that cause retrenchment. For these reasons, especially the risk of artifactual relations, we refrain from placing emphasis on analyses with welfare effort as a regressor. However, we do (1) include lagged welfare effort as a regressor in some retrenchment models, and (2) regard our results for need variables in the absence of controls for social spending as estimates of reduced form coefficients (see Alwin and Hauser 1975; and Greene 2000, chap. 16). These include both indirect effects of need variables exercised through social spending as well as direct effects of need conveyed by other mechanisms (for example, through forms of spending other than welfare effort).
Compare Brady 2003.
Political Organizations/Institutions
Political organizations include decentralized political institutions marked by competitive veto points (principally centralized state jurisdictional and administrative structures), inclusive electoral systems (for example, systems of proportional representation), neocorporatist systems of societally extensive and centralized interest organizations (principally labor confederations), and strong—typically ruling—left and center-left parties, Social and Christian Democratic in particular.36
See Hicks and Misra 1993; Huber, Ragin, and Stephens 1993; Garrett 1998a; Hicks 1999; and Swank 2002.
For many authors, reformist left-center parties are the principal causes of social welfare expansion. Left party (that is, social democratic, socialist, labor, and communist) governments are particularly prone to welfare spending; Christian Democratic parties are also frequently judged to promote welfare spending.37
For examples of left-center explanation, see Hewitt 1977; Cameron 1978; Esping-Andersen 1985; Garrett 1998a and 1988b; Hicks and Swank 1992; Hicks and Misra 1993; and Brady 2003. For example of Christian Democratic Party explanation, see Stephens 1979; Wilensky 1981; and Huber, Ragin, and Stephens 1993.
Another political determinant is neocorporatism, a system of interest articulation between society and state and of the incorporation of cohesive labor movement organizations (union and party) into the policymaking process of the state. Such arrangements tend to empower employees relative to employers, especially insofar as the former are well organized.40
See Lange and Garrett 1985; and Hicks and Swank 1992.
See Cameron 1984; Hicks and Misra 1993; Hicks 1999; Garrett 1998a; and Swank 2002.
Finally, state-centered and political institutional theorists have proposed internal organizational (and interorganizational) structures of states as sources of social policy. For example, Huber, Stephens and Ragin, Birchfield and Crepaz, and Swank have all argued that federal, presidential, bicameral, and referenda-oriented political institutions, by dispersing power and proliferating veto points, obstruct reformist policymaking, especially inclusive, populist reform.42
In addition, inspired by Lijphart,43 these authors have argued that inclusive electoral institutions associated with “proportional representation” tend to promote reformist policymaking, especially the inclusive, populist reforms associated with progressive welfare states. Accordingly, we hypothesize that power-dispersing institutions will promote welfare retrenchment, while inclusive electoral institutions inhibit it. Note, however, that if the respective antireformist and proreformist consequences of these dispersive and inclusive systems involve effects on policy change in general (that is, in any direction), rather than solely progressive prowelfare effects, then a pair of contrary hypotheses would be appropriate.Data and Methods
As noted above, we confine our examination of retrenchment to the long-standing affluent capitalist democracies of the OECD, during the period from 1978 to 1994. This period begins with the second OPEC oil boycott of 1978–80, and with the 1979 rise of the conservative policies of English Prime Minister Margaret Thatcher; both occurrences are harbingers of Esping-Andersen's “third crisis” of the welfare state,44
Esping-Anderson 1999.
Identifying Retrenchments
We conceptualize welfare retrenchments as discrete policy events, using our novel coding of such events. Our coding assesses changes in the relatively raw (or objective) data, that is, in per capita social transfer spending for the years 1978–94. In short, we follow the lead of Western, Hicks, and Korpi and Palme45
See Western 1997; Hicks 1999; and Korpi and Palme 2003.
Korpi and Palme base their assessments of cuts on data for only three programs—unemployment compensation, workers compensation, and sickness insurance—and for only every fifth year (1975–95). Regrettably, the programs studied neither include expenses on medical services, nor retirement insurance on the most costly of programs. Moreover, their focus on benefit changes across five-year gaps (for example, 1975–80 or 1980–85) invites particular forms of measurement error. A series of five-year windows that open only every five years (for example, in 1975, then 1980, and so on) become degraded as a means of detecting cuts to the extent that the optimal periods for detecting cuts consist of a different set of five-year period (for example, 1978–83 or 1982–87, instead of 1975–80) and degrades even further to the extent that the optimal period for detecting a cut is not five years long (for example, 1975–77 or 1975–83, instead of 1975–80).
We identify retrenchments on original, relatively objective grounds, aided by data on per capita welfare spending. We begin by identifying a preliminary set of retrenchment events on the basis of downturns of at least two or three years in duration in annual per capita real social spending series, constructed with social spending data from the OECD,50
population data from numbers of the OECD Labor Force Statistics, and consumer price indices from the International Monetary Fund (IMF). Next, we standardized these events by confining attention to events that involved notable, sustained declines in the percentage rate of change in the annual per capita real social spending series.In particular, we examined national series on annual per capita real social spending (PCRSit) for insight into what might constitute notable and sustained declines. We found that while declines that were reversed after a single year seemed too transitory to be notable, declines that continued beyond three years appeared too rare to encompass all notable retrenchments. We also found that declines of two or three years duration that also were of 4 to 6 percent in magnitude appeared consequential in depth and extension and moderate (neither too few for analysis or too numerous for realism) in number. Accordingly, we code a retrenchment as occurring according to the following formula:

where, k indexes the duration of the decline, while c is the cutoff at which we code a retrenchment as having occurred; larger values of k correspond to longer periods of retrenchment, while larger (negative) values of c indicate deeper levels of retrenchment activity. As suggested above, we focus on declines of both two and three years in duration (that is, on k = 2 and k = 3) and on three magnitudes of decline (specifically, c = −0.04, −0.05, and −0.06).
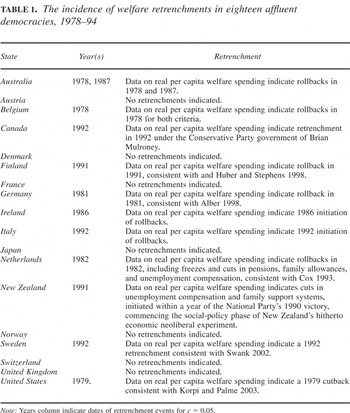
The resulting dates for retrenchment events constitute a tidy set of more than momentary reversals in the generally upward (if often decelerating) trajectories of annual per capita real social spending. Moreover, they are free of the exaggeratedly countercyclical character of welfare effort measures (for example, social spending as a share of GDP), which will decline with GDP increases both for artifactual reasons and because of the countercyclical movement of need. In addition, these measures are generally robust to the choice of both k and c. In particular, the sets of retrenchments for k = 2 and k = 3 are identical for equal values of c, and change little when c itself is varied.51
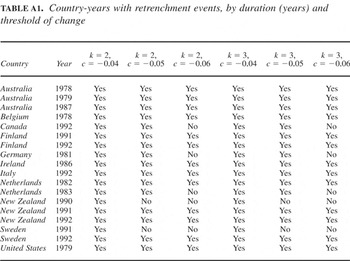
All nation-years with retrenchment events (including ones for successive years) for any combinations of the two values of k and the three thresholds of change c by which events were identified are reported in Appendix 1. More generally, the number of qualifying retrenchments changes only slowly across broader ranges of variation in both k and c; interested readers are encouraged to contact the authors for details on the robustness of this measure to the choices of these parameters.
Other successive declines included Finland and Sweden (1991 and 1992 for all thresholds), the Netherlands (1982 and 1983 for all thresholds), and New Zealand (1991 and 1992 for the −0.05 and −0.06 thresholds).
The incidence of welfare retrenchments in eighteen affluent democracies, 1978–94

We do not claim to have achieved a definitive accounting of retrenchment events, even for the eighteen nations and the 1978–94 period in question. To do so would require a yet more enterprising and extensive effort than this one; in particular, it would appear to require data on benefit rates (for example, income-replacement rates for typical beneficiaries) and on who does and does not receive benefits (for example, enrollment and coverage for a comprehensive set of relevant programs).53
Even without such benefit and coverage data, we would have preferred to have measured social spending per needy person or, at the very least, per beneficiary. However, reliable data on the population of needy persons are not readily available; such data would necessarily need to include those at risk of illness and work injury, as well as the unemployed and elderly (not to speak of the poor). In a perfectly accommodating world, we would have benefit and coverage data of the sort currently approaching the public domain from the work Korpi and Palme 2003 and Allan and Scruggs 2004; however, these data are not yet available. Perhaps future work by Korpi and Palme, or by Allen and Scruggs, which uses annual data income replacement data on a full range of social insurance programs and contains some consideration of coverage and enrollment as well as benefit rates, offers our best promise of a definitive operationalization of welfare retrenchment.
These lagged counts of retrenchment events have highly significant negative effects on welfare effort. However, if we replace these lagged counts of retrenchment events with ones based on Korpi and Palme 2003 events as reported in their Appendix 2, no significant effects of their “major cuts” on subsequent welfare effort emerge.
Further Data and Operationalizations
Our measurement and operationalization of our models' key covariates draw on existing work on welfare retrenchments, and on the larger corpus of literature on the politics of welfare states more generally. We measure trade openness as the ratio of imports plus exports to GDP, investment openness as the ratio of outward FDI investment to GDP, and financial liberalization using the Quinn index.55
Compare Quinn 1997; and Quinn and Inclan 1997.
We measure our economic/demographic variables quite conventionally, as detailed in Appendix 2. Following Iversen,61
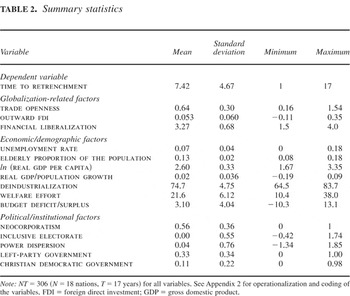
our deindustrialization measure equals 100 minus the sum of manufacturing and agricultural employment as a percentage of the working-age population, based on data from the OECD's Labor Force Statistics; following Iversen, it is specified as a lagged level (at time t−1). The preceding measure, and measures of unemployment rates, real per capita GDP (logged for less skewness and stronger fit), and the share of population over age 65, are documented in Appendix 2. Budget deficits are measured with the conventional ratio of central-government surplus/deficits as a share of GDP; importantly, these are high for surpluses, low for deficits, and are lagged one year. Summary statistics for the variables used in the analyses are presented in Table 2.Summary statistics

To avoid simultaneity bias while also curtailing “specification searching” for optimal lags, explanatory variables are lagged as follows. In line with Hicks,62
zero and one-year lags (averaged together) are used for variables that seem likely to have immediate “automatic” effects as entitlement or revenue triggers or as immediate precipitants of these as well as impacts on legislative decisions requiring decision lags (rates of unemployment and old age, and the natural logarithm of real GDP per capita). One-year lags are used for growth in real per capita GDP, globalization variables, for the power dispersion and electoral inclusiveness variables drawn from Swank,63 and for the measure of neocorporatism. Lags for the deindustrialization variable stick to the precedent set by Iversen64 and are lagged one period. In order to capture a full range of “policy action” lags (covering everything from prompt enactment of a program to slow legislative movements through monitoring, legislative, budgetary, and implementation stages), moving averages of variables, lagged one through four years, are used for each of the two (social democratic and Christian Democratic) cabinet-share variables. One-year lags are used for the remaining variables, welfare effort and surplus/deficits.Methodology
We analyze retrenchment events by means of Cox hazard models for repeated events. The Cox65
model takes the form:
where Xit is a vector of (possibly time-varying) covariates and h0(t) is an unspecified baseline hazard on which the independent variables act in a multiplicative fashion. Unlike parametric models for durations, Cox's model does not assume an underlying form for the baseline hazard; this flexibility in the shape of the baseline hazard has made the Cox model the most widely used in biostatistics and other areas of survival analysis.66
For example, Fleming and Harrington 1991.
To check on the actual, presumably negative, effects of retrenchment events on welfare effort (or spending as a share of GDP), we also estimate the effects of the cumulative number of retrenchment events experienced by a nation through t−1 on welfare effort at t. For simplicity and comparability, we use models that are specified—lagged retrenchment regressors apart—such as those for retrenchments themselves. As a safeguard against inefficient slope estimates and inflated t-statistics because of autoregressive errors, we principally estimate models with panel-corrected standard errors (PCSE) and a single generalized least squares (GLS)-based AR(1) adjustment for autoregressive errors. We also estimate models with PCSE plus a lagged dependent variable (LDV) as a safeguard against autoregressiveness in the errors and correspondingly deflated standard errors.70
However, LDV models of time series are prone to underestimate slopes for variables other than the LDV if the regressand trends upward (as does welfare effort) or if autocorrelation persists in the face of the LDV.71 Thus they risk conservative coefficients and tests statistics.Analysis and Results
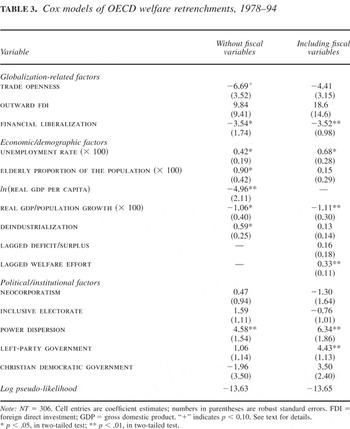
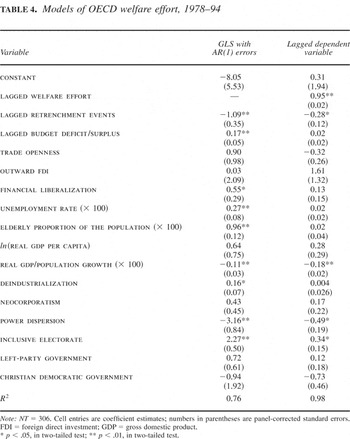
We present Cox repeated-event hazard analyses of retrenchments in Table 3; column (1) reports the general model, while column (2) adds controls for hypothesized fiscal sources of retrenchments. The latter are withheld from the principal model because these variables are such highly proximate potential causes of welfare retrenchment that they might be regarded as mere mechanisms for the transmission of effects of the other regressors, and because welfare effort has the same denominator as our criterion for defining retrenchment events and thus might have artifactual relations to these events. Table 4 reports the GLS regressions of welfare spending on retrenchments and other variables. All models use the retrenchment specification outlined in equation (1), with k = 3 and c = 0.05.72
In addition to the analyses presented here, we estimated a series of models to assess the robustness of our retrenchment measure; these are available in an appendix (Retrenchment: Data and Ancillary Analysis) available at our Web site, 〈http://polisci.emory.edu/zorn/HZ/index.html〉. In every case, with only minor differences, the substantive conclusions reached by those auxiliary analyses mirror those presented here.
Cox models of OECD welfare retrenchments, 1978–94

Models of OECD welfare effort, 1978–94

Substantively, we assess the concept of “self-limiting immoderation” by considering estimates of effects (that is, “reduced form” or “total causal” effects, as noted in note 4) of need variables on retrenchment that are presented in column (1) of Table 3. We further do so by jointly considering estimates of effects of welfare effort on retrenchments in column (2) of Table 3, and by considering estimates of effects of need-related variables (and prior retrenchments) on welfare effort in Table 4. Where both sorts of effects are present, the process whereby need variables trigger retrenchments by inflating spending and deficits is empirically supported.
The Determinants of Welfare Retrenchments
We have already signaled that globalization, the domestic economy, and political institutions matter for retrenchment, and the results in column (1) of Table 3 support these expectations. With regard to globalization, our analyses provide the clearest support for the “compensation” variant of globalization theory: we find consistently negative and generally significant effects of both trade openness and financial liberalization on the incidence of retrenchments. Substantively, the effects of such factors are large; one-standard deviation increases in these two indicators act to decrease the odds of a retrenchment by 86 percent and 91 percent, respectively. In contrast, while the positive sign on outward FDI bears in favor of “competition” theory, those findings fail to attain statistical significance.
More broadly, the joint effects of factors related to globalization appear quite strong. Wald tests indicate that the three globalization variables exert notable joint impacts on the incidences of retrenchments (χ2(3) = 5.93, p = 0.11). Taken as a complex whole, the weight of evidence found here tilts toward the “compensation” view of globalization's relation to the welfare state. However, slight evidence emerges for the “competitive” view that outward FDI—an indicator of enhanced, antiwelfarist corporate clout—promotes welfare retrenchment.73
Hicks 1999, chap. 7.
Our findings for influences related to the domestic economy are also notable. Consistent with our notion of self-limiting immoderation, unemployment and elderly population show significant signs of promoting retrenchment. For the model in column (1), a 1 percent increase in the lagged unemployment rate increases the odds of a retrenchment by 52 percent; the corresponding figure for a 1 percent increase in the proportion of the population at least 65 years of age is 146 percent. Moreover, deindustrialization—conventionally regarded as a source of unemployment and related need at least since Bluestone and Harrison's74
landmark Deindustrialization of America of more than two decades ago—also appears to rather directly exert pressure for retrenchment as well: a 1 percent increase in that variable increases the odds of retrenchments by more than 80 percent.In contrast to the need and deindustrialization measures, our coefficient estimates for affluence and GDP growth are consistently negative and strongly significant. On average, a one standard deviation increase in GDP decreases the odds of a retrenchment by nearly 81 percent, while a 1 percent increase in economic growth decreases the odds of a retrenchment by 189 percent. These findings are unsurprising; clearly a stronger economy increases government's ability to provide social services. What is perhaps more surprising is that, once such effects are controlled for, we find solid support for the notion that need-related influences actually promote retrenchment of benefits.
The combined effects of these domestic economic and demographic variables are also strongly significant. Indeed, those for unemployment and elderly population (the central need variables where the thesis of self-limiting immoderation are concerned) are significant beyond the 0.05 test level (χ2(2) = 5.96); the same can be said for the joint influence of the wealth and growth variables (χ2(2) = 7.24). Our results thus support the contention that the slack resources afforded by economic growth and economic affluence inhibit retrenchment. On the whole, our findings regarding economic influences offer robust support for the dynamics of “self-limiting immoderation”; in particular, those very factors which one might normally expect to bring about more expansive welfare policies—particularly unemployment brought on by widespread deindustrialization during the last quarter of the twentieth century—serve instead as catalysts for reversals of such policies.
Our findings vis-à-vis political influences on retrenchments also offer some novel insights. Prominent among these is the lack of any consistent marginal influence of domestic partisan factors in driving welfare retrenchments; neither left nor Christian Democratic governments were any more (or less) likely to engage in retractions of social benefits than were other parties. Similarly, our estimate for the influence of neocorporatism also fails to attain statistical significance, suggesting that neocorporatism has no clear impact on retrenchment. Conversely, however, both decentralized political institutions and inclusive electoral systems appear to promote retrenchment, although our findings are equivocal for the case of electoral inclusiveness. In particular, the effect of our power dispersion variable is both strongly significant and substantively large.75
Note that these institutional variables are strongly dominated by cross-sectional variation: a series of country-specific indicator variables explains more than 70 percent of the variance in neocorporatism, and more than 95 percent of that in electoral inclusiveness and power dispersion. In such cases, strategies exist for attributing explanation in regressands to the cross-sectionally dominant regressors. For example, relations of longitudinally invariant influences such as power-dispersing institutions might in principal be analyzed by means of a hierarchical modeling approach, for example, Western 1997, pt. III. However, multilevel modeling of discrete response data in general, and of repeated-events duration data in particular, presents notable statistical challenges; see Western 1997, chap. 10. Accordingly, we confine our estimation of temporally quasi-invariant institutional conditions to straightforward additive specifications of these variables in conventional repeated-events models.
One explanation for this finding is that dispersed authority structures favor upper class and corporate interests, which—possessing ample political resources at subnational levels like the province and the firm—are less dependent on formal and national political organization than more redistributive, prowelfarist working class and union interests; see Skocpol 1992.
See Cox 1993; and Green-Pedersen 2003.
Thus, on the whole, our findings regarding political influences indicate that decentralized political institutions and electoral inclusiveness and consensual rule promote welfare retrenchment. At the same time, our findings provide little support for the antiretrenchment effects of government partisanship claimed by Korpi and Palme.78
To the contrary, our results suggest that economic and need variables dominate the retrenchment calculus, and in particular support the existence of both a compensatory influence of globalization-related factors and a dynamic of “self-limiting immoderation” in their occurrence.Incorporating Fiscal Mechanisms
As we noted above, because we expect that the effects of need variables—unemployment and elderly population most especially—are channeled through fiscal variables such as welfare effort and public deficits/surpluses, it is appropriate not to include such fiscal variables in our models of retrenchment. When included, fiscal variables will likely control away effects of sundry other variables, unemployment and elderly population in particular, insofar as the variables exercise their effects by means of the fiscal variables.79
Compare note 35.
Accordingly, column (2) of Table 3 reports a similar Cox regression of retrenchments on the previously described covariates, as well as on lagged measures of welfare effort and budget deficits/surpluses. Because of monotonicity in the Cox partial likelihood—likely induced by the endogenous nature of the added covariates, as noted above—simple variants of the model in column (1) of Table 3 could not be estimated. To obtain valid estimates for column (2), we exclude the covariate most highly collinear with the added variables: in this case, the indicator for per capita GDP.80
In our Web site, we present alternative models, which obtain identification by excluding other model covariates; in all cases, our findings are robust, remaining largely unaffected by our choice of excluded variable.
The results in column (2) of Table 3 are generally consistent with those in column (1). However, in line with our conception of fiscal variables as causal funnels, models with fiscal variables show fewer effects of nonfiscal variables than do models without fiscal variables. In every case in which an estimated effect was distinguishable from zero in column (1), that variable retained its sign—if not its statistical significance—in column (2). The findings in column (2) also support the view that welfare effort, if not the public budget deficit as a share of GDP, is a notable cause of welfare retrenchment and may be an important mechanism for the transmission of need effects and the operation of self-limiting immoderation. At the same time, as expected, the effect of including the fiscal variables is to decrease the joint impact of variables indicating need, particularly that for the elderly population. In short, evidence for positive effects of welfare effort supports our expectation that welfare effort is a mechanism for effects of unemployment and elderly population, our core need variables.
Models of Welfare Effort
While our efforts so far generally support the notion of “self-limiting immoderation,” this interpretation of the positive impacts of need variables on retrenchment is not the only plausible one. Need variables may have varied or multiple mechanisms linking their variation to impacts on policy. Policymakers' perceptions of macroeconomics might lead them to think that need inexorably leads to immoderate spending and thus calls for spending cuts—even where no such effects on spending are observed. High levels of need might be regarded, any spending consequences aside, as economically or otherwise pernicious (for example, high unemployment rates wasting human capital or degrading the quality of life), while spending reductions might be regarded as reducing need (for example, as correcting economic disincentives that engender need). In either case, high needs might cue spending cuts.
Nonetheless, the “self-limiting immoderation” mechanism for the translation of high need into welfare retrenchment seems cogent: Spending is cut because it is getting too high, and because the forces that make it so are too strong. For this to be the case, four key conditions must be observed: (1) positive effects of need variables tied to social spending, (2) positive effects of social spending on retrenchment in the absence of controls for social spending, (3) positive effects of need variables on retrenchment in the absence of controls for fiscal variables, and (4) negative effects of retrenchments on subsequent social spending. As we noted previously, our findings in Table 3 broadly support conditions (2) and (3); need variables exert consistent pressure for retrenchment in the absence of fiscal controls, and past spending exhibits a similar positive influence on the likelihood of retrenchments. Regarding condition (1), positive effects of need variables such as unemployment on welfare effort are prevalent in the literature,81
See, for example, Hicks 1999; Huber and Stephens 2001; and Swank 2002.
We adopt social welfare effort (social spending as a share of GDP) as an appropriate measure of social spending, as it captures the weight of social spending in the economy. We model this spending as a function of the same covariates as in the retrenchment models, but also include an indicator of the (lagged) number of retrenchment events and, in one case, lagged welfare spending itself. We do not pretend that we have an optimally specified model of welfare spending: this article's focus is on retrenchment. However, we believe that these models are a reasonable complement to those presented in our analyses of retrenchment events and can provide at least suggestive evidence about the validity of the “self-limiting immoderation” thesis.
Table 4 presents two models of welfare effort, one for each measure of retrenchment. Here, we regard results with each mode of estimation—a GLS model with an AR(1) adjustment, PCSEs and no lagged dependent variable, and a second model with a lagged dependent variable (LDV), PCSEs, and no AR(1) adjustment—as instructive. Of the two, the former model seems most sensible, as the AR(1) adjustment and PCSEs provide safeguards against inflated standard errors due to heteroskedasticity without the risk of inconsistency introduced by the LDV.82
See Beck and Katz 1995; and Greene 2000.
See Beck and Katz 1996 and 2004; Achen 2000; Huber and Stephens 2001; Ploemper, Troeger, and Manow forthcoming; and Kittel and Winner forthcoming.
As concerns condition (1), both unemployment and elderly populations appear to drive welfare spending in the model using an AR(1) correction, although not in the more conservative LDV model.84
This last qualification is, in some respects, unsurprising. On the one hand, support for effects of need variables on welfare effort is prevalent, for details see Hicks 1999; Huber and Stephens 2001; Franzese 2002; and Swank 2002. On the other hand, a number of authors have recently demonstrated both a tendency for and mechanism by which the inclusion of a lagged dependent variable both “overcorrects” for autoregression in the errors and tends to mask the effects of other independent variables, particularly those which exhibit significant temporal dependence. For example, see Achen 2000; Ploemper, Troeger, and Manow forthcoming; and Kittel and Winner forthcoming. Also note that multicollinearity is high for unemployment and elderly measures in Table 4, especially for the elderly measure in the face of lagged welfare effort.
Note that, as Bluestone and Harrison 1982 would suggest, the zero order correlation between lagged deindustrialization levels and unemployment rates in our data is substantial (0.68). In addition, regressing unemployment on the covariates in Table 4 (minus lagged retrenchment counts), deindustrialization has a highly significant positive impact on unemployment; this is true irrespective of the means by which we correct for autocorrelated errors. These results are available from the authors on request.
See, for example, Hicks 1999; Huber and Stephens 2001; Franzese 2002; and Swank 2002. Compare Iversen 2001.
In addition, the models of Table 4 provide unequivocal support for condition (4): the estimate for the effect of lagged counts of retrenchment events on social spending amply indicates that retrenchment events work to dampen subsequent social spending. In the AR(1) model with PCSE, the estimate for lagged retrenchment counts is −1.09, indicating that the occurrence of a retrenchment instantaneously reduces welfare spending as a fraction of GDP by about 1 percent. The analogous estimate in the model with PCSE and an LDV is −0.28; though smaller in absolute magnitudes than that for AR(1) model, this effect is in fact even larger than that in the AR(1) model. Because the model in column (2) may be interpreted as a Koyck distributed lag model,87
For example, Judge et al. 1985, chap. 10.
Moreover, as in Table 3, our findings are robust to our choice of criteria for defining retrenchments; estimates for models like those in Table 4 where retrenchment events are defined for c = −0.04 and −0.06 are available in at our Web site.
Taken together, the findings in Tables 3 and 4, consistent with our theorizing about the paradox of self-limiting immoderation, provide ample evidence that two aspects of need for income maintenance—unemployment and elderly population—and one underlying source of these needs—deindustrialization—help trigger retrenchment events. We find no evidence that need variables that tend to augment welfare spending inhibit rather than promote welfare retrenchments; by contrast, there is strong evidence that welfare retrenchments, true to their name, dampen welfare effort.
Conclusion
Despite highly visible claims to the contrary, systematic research has seldom found that indicators of economic need such as unemployment promote welfare retrenchment. Moreover, factors related to economic globalization, while often speculated to be a proximate cause of such retrenchment, have often been found instead to promote welfare spending. In this article, we offer evidence that societal need—increasing unemployment rates and aging, plus deindustrialization—actually promotes welfare state retrenchment. At the same time, our research reinforces the notion that globalization tends to inhibit such retrenchment. In addition, we believe our work offers several improvements over existing studies and provides a number of fruitful directions for future research.
Among our innovations, we identify welfare retrenchments as discrete events on the basis of annual data on a full range of income maintenance programs. When retrenchments are considered as events, variables that fail to affect welfare effort and other continuous measures of welfare policy outputs sometimes prove to have notable effects on those retrenchments. Indeed, factors such as unemployment that exert a positive effect on welfare spending prove to have a rather different impact on retrenchment events. Pressures for welfare spending may become unsustainable, and indeed come to cue efforts to relieve such pressures—that is, to trigger welfare retrenchment. In this way, pressures for welfare policy generosity may grow so immoderate that they become self-limiting and reverse into pressures for welfare cuts. In our novel terminology, paradoxes of self-limiting moderation may arise.
Our empirical findings are broadly congruent with this dynamic. In particular, we find that unemployment, despite appearing to drive welfare spending (as its pressures on numbers of welfare beneficiaries requires), promotes welfare retrenchment; and we find that the weight of the elderly in the population tends to do so as well. We also find that deindustrialization, often regarded as a source of welfare need, also tends to exert pressure for welfare retrenchment, despite its noted tendency to drive up welfare spending. The fact that influences such as unemployment, societal aging, and deindustrialization, heretofore understood as proximate prods to welfare spending, may also yield qualitative reversals in social programs is, we believe, a substantial advance in our understanding of the macroeconomics of welfare policymaking.
In regards to the relationship between globalization and welfare retrenchments, we find that it may have conflicting effects and some tendency to promote welfare retrenchment as well as welfare expansion. Our results lead us to conclude that, consistent with the notion that it augments welfare spending, both trade openness and financial liberalization (that is, deregulation of international financial flows) inhibit the onset of retrenchments. This is consistent with the “compensation” school of thought regarding globalization and the welfare state and counter to the widely asserted “competitiveness” view of the topic. At the same time, outward FDI—an indicator of state vulnerability to the actions and preferences of transnational corporations—seems to consistently, if hazily, nudge retrenchments forward. More generally, to the extent that globalization has often been regarded as a source of deindustrialization, and as deindustrialization has in turn been seen as a source of unemployment, the relations of globalization, deindustrialization, unemployment, and retrenchment certainly bear further consideration.89
Compare Bluestone and Harrison 1982; and Alderson 1999.
As we noted above, the correlation between deindustrialization and unemployment in our data is a substantial 0.68. In addition, regressing unemployment on the variables in Table 4 (minus any unemployment regressor) indicates that deindustrialization has a highly significant impact on unemployment. With respect to the possibility that deindustrialization is a consequence of globalization (compare Harrison and Bluestone 1982; and Alderson 1999), note that in our data the zero-order correlations between deindustrialization and lagged measures of trade openness, Outward FDI and financial liberalization are 0.25, 0.34, and 0.30, respectively (all p < .001, two-tailed tests). Additional preliminary analyses further support these contentions, the investigation of which we plan to take up in future work.
With these findings, we recommend that the relevance of societal aging, high and secularly climbing unemployment, deindustrialization, and globalization to welfare retrenchment must be reconsidered. Moreover, the use of almost exclusively continuous measures of social spending such as welfare effort to investigate welfare reform and the so-called “crisis of the welfare state” must be reconsidered as well. New measures of outputs are needed to better assess the extent and causes of the “crisis.”91
See Korpi and Palme 2003; and Allan and Scruggs 2004. In these studies, all findings for effects of unemployment are consistent with the thesis of “self-limiting immoderation,” as concerns direction, if not always significance, of estimates. Elderly effects are not estimated.
Appendix 1
Country-years with retrenchment events, by duration (years) and threshold of change

Appendix 2. Principal Variables: Operationalization and Data Sources
retrenchment events: See text, Table 1, and Appendix 1 for details.
trade openness: Globalization data file of Swank 2002, measured at time t−1.
outward fdi: Globalization data file of Swank 2002, measured at time t−1.
financial liberalization: Index of the absence of restrictions on capital flows from Quinn and Inclan 1997, measured at time t−1.
aged population: Persons at least 65 years old over population from UN's Demographic Yearbook (selected years); and OECD's National Accounts of OECD Member Nations (selected years), average of 0 and 1-year lags.
unemployment rate: Unemployed as proportion of the economically active population, averaged across t and t-1, from OECD's Labor Force Statistics (selected years).
real gdp per capita: Measured as natural logarithm with data from OECD's National Accounts of OECD Member Nations (selected years). Average of 0 and 1-year lags.
growth: Percentage annual change in real gdp per capita lagged one year (that is, the natural logarithm of the quantity real gdp per capita at t−1 minus real gdp per capita at t−2). Percentage change in real gdp per capita. Measured at t and t−1.
deindustrialization: 100 minus the sum of manufacturing and agricultural employment as a percentage of the working age population at t−1, from Iversen 2001; OECD 1996a; and OECD's Labor Force Statistics (selected years).
welfare effort: Social security expenditure as percentage of GDP, as measured with “total social welfare outlays” from data files for Swank 2002, with data from OECD 1994 and 1996b. Annual per capita real social spending, measured in thousands of units of national currencies with social spending data from the OECD 1994 and 1996b; population data from OECD's Labor Force Statistics (selected years); and consumer price indices from the IMF's International Financial Statistics (selected years).
deficit/surplus: Deficit/surplus as a share of GDP from OECD's Economic Outlook; and OECD's National Accounts of OECD Member Nations (selected years).
left government: Four-year average (t−4 through t−1) of left-party cabinet classifications data are from Swank's 2003 Comparative Party Data Set available at 〈http://www.marquette.edu/polisci/Swank〉. Accessed 10 March 2005.
christian democratic government: Strictly analogous to left cabinet.
neocorporatism: The time-varying measure of degree and level of union bargain coordination of Kenworthy 2001, measured at time t−1.
power-dispersing institutions: “Dispersion of authority” from Swank 2002, measured at t−1.
inclusive electoral institution: From Swank 2002, measured at t−1.
References
REFERENCES
Achen, Christopher H.
2000.
Why Lagged Dependent Variables Can Suppress the Explanatory Power of
the Other Independent Variables.
Paper presented at the 96th Annual Meeting of the American
Political Science Association, July, University of California at Los
Angeles.
Alber, Jens.
1998.
Recent Developments in Continental European Welfare States: Do
Austria, Germany and the Netherlands Prove to Be Birds of a
Feather?
Paper Presented at the 14th World Conference of Sociology, July,
Montreal, Canada.
Alderson, Arthur S.
1999.
Explaining Deindustrialization: Globalization, Failure, or
Success?
American Sociological Review
64 (5):701–21.Google Scholar
Allan, James P., and
Lyle Scruggs.
2004.
Political Partisanship and Welfare State Reform in Advanced
Industrial Societies.
American Journal of Political Science
48 (3):496–512.Google Scholar
Alwin, Duane, and
Robert Hauser.
1975.
The Decomposition of Effects in Path Analysis.
American Sociological Review
40 (1):37–47.Google Scholar
Amenta, Edwin.
2001.
A Review of “Social Democracy and Welfare
Capitalism.”
Contemporary Sociology
30 (4):383–84.Google Scholar
Beck, Nathaniel, and
Jonathan Katz.
1995.
What to Do (and Not to Do) with Time-Series Cross-Section
Data.
American Political Science Review
89 (3):634–47.Google Scholar
Beck, Nathaniel, and
Jonathan Katz.
1996.
Nuisance vs. Substance: Specifying and Estimating
Time-Series–Cross-Section Models.
Political Analysis
6 (1):1–36.CrossRefGoogle Scholar
Beck, Nathaniel, and
Jonathan Katz.
2004.
Time-Series Cross-Section Data Analysis: 2004.
Paper presented at the Annual Summer Meeting of the Society for
Political Methodology, July–August, Stanford University,
Calif.
Birchfield, Vicki, and
Markus M.L. Crepaz.
1998.
The Impact of Constitutional Structures and Collective and
Competitive Veto Points on Income Inequality in Industrialized
Democracies.
European Journal of Political Research
34 (2):175–200.Google Scholar
Bluestone, Barry, and
Bennett Harrison.
1982.
The Deindustrialization of America: Plant Closings, Community
Abandonment, and the Dismantling of Basic Industry.
New York:
Basic Books.
Boix, Carles.
2001.
Democracy, Development, and the Public Sector.
American Journal of Political Science
45 (1):1–17.CrossRefGoogle Scholar
Box-Steffensmeier, Janet M., and
Christopher Zorn.
2002.
Duration Models for Repeated Events.
Journal of Politics
64 (4):1069–94.CrossRefGoogle Scholar
Bradley, David,
Evelyn Huber,
Stephanie Moller,
Francois Nielsen, and
John D. Stephens.
2003.
Distribution and Redistribution in Postindustrial
Democracies.
World Politics
55 (2):193–228.Google Scholar
Brady, David.
2003.
The Politics of Poverty: Left Political Institutions, the Welfare
State and Poverty.
Social Forces
82 (2):557–88.Google Scholar
Burgoon, Brian.
2001.
Globalization and Welfare Compensation: Disentangling the Ties that
Bind.
International Organization
55 (3):509–51.Google Scholar
Cameron, David.
1978.
The Expansion of the Public Economy: A Comparative Analysis.
American Political Science Review
72 (4):1243–61.Google Scholar
Cameron, David.
1984.
Social Democracy, Corporatism, Labor Quiescence, and the
Representation of Economic Interest in Advanced Capitalist Society.
In
Order and Conflict in Contemporary Capitalism, edited by
John H. Goldthorpe,
143–78.
New York:
Oxford University Press.
Cox, D. R.
1972.
Regression Models and Life Tables.
Journal of the Royal Statistical Society, Series B
34 (2):187–220.Google Scholar
Cox, Robert H.
1993.
The Development of the Dutch Welfare State: from Workers'
Insurance to Universal Entitlement.
Pittsburgh, Penn.:
University of Pittsburgh Press.
Esping-Andersen, Gøsta.
1985.
Politics Against Markets: The Social Democratic Road to
Power.
Princeton, N.J.:
Princeton University Press.
Esping-Andersen, Gøsta.
1999.
The Social Foundations of Post-Industrial Economies.
New York:
Oxford University Press.
Feldstein, Martin, ed.
1998.
Privatizing Social Security.
Chicago:
University of Chicago Press.
Fleming, Thomas R., and
David P. Harrington.
1991.
Counting Processes and Survival Analysis.
New York:
Wiley.
Fligstein, Neil.
2002.
The Architecture of Markets: An Economic Sociology of Twenty-First
Century Capitalist Societies.
Princeton, N.J.:
Princeton University Press.
Flora, Peter.
1986.
Growth to Limits: the Western European Welfare States Since World
War II, Vols. 1, 2, 3, 4.
New York:
Walter de Gruyter.
Franzese, Robert J.
2002.
Macroeconomic Policies of Developed Democracies.
New York:
Cambridge University Press.
Friedman, Thomas L.
2000.
The Lexus and the Olive Tree: Understanding Globalization.
New York:
Anchor.
Garrett, Geoffrey.
1998a.
Partisan Politics in the Global Economy.
New York:
Cambridge University Press.
Garrett, Geoffrey.
1998b.
Global Markets and National Politics: Collision Course or Virtuous
Circle?
International Organization
52 (4):787–824.Google Scholar
Garrett, Geoffrey, and
Deborah Mitchell.
2001.
Globalization, Government Spending and Taxation in the OECD.
European Journal of Political Research
39 (2):145–77.Google Scholar
Golden, Miriam,
Peter Lange, and
Michael Wallerstein.
1993.
Trends in Collective Bargaining and Industrial Relations in
Non-Corporatist Countries: A Preliminary Report.
Paper Presented at the 89th Annual Meeting of the American
Political Science Association, September, Washington, D.C.
Gordon, Andrew.
1998.
The Wages of Affluence: Labor and Management in Post-War
Japan.
Cambridge, Mass.:
Harvard University Press.
Greene, William H.
2000.
Econometric Analysis, 4th ed.
Upper Saddle River, N.J.:
Prentice Hall.
Green-Pedersen, Christoffer.
2003.
Small States, Big Success: Party Politics and Governing the Economy
in Denmark and the Netherlands from 1973 to 2000.
Socioeconomic Review
1 (37):411–37.Google Scholar
Greider, William.
1997.
One World, Ready or Not: The Manic Logic of Global
Capitalism.
New York:
Simon and Schuster.
Hall, P. A., and
David Soskice.
2001.
An Introduction to Varieties of Capitalism. In
Varieties of Capitalism, edited by
P. A. Hall and
David Soskice,
1–68.
New York:
Oxford University Press.
Hewitt, Christopher.
1977.
The Effects of Political Democracy and Social Democracy on Equality
in Industrial Societies: A Cross-Sectional Comparison.
American Sociological Review
42 (3):450–64.Google Scholar
Hicks, Alexander.
1999.
Social Democracy & Welfare Capitalism: A Century of Income
Security Politics.
Ithaca, N.Y.:
Cornell University Press.
Hicks, Alexander, and
Gøsta Esping-Andersen.
2005.
Introduction to the Comparative and Historical Political Sociology
of the Welfare State. In
Handbook of Political Sociology, edited by
Thomas Janoski,
Robert Alford,
Alexander Hicks, and
Mildred Schwartz.
New York:
Cambridge University Press.
Hicks, Alexander, and
Joya Misra.
1993.
Political Resources and the Growth of Welfare in Affluent Capitalist
Democracies, 1960–1982.
American Journal of Sociology
99 (3):668–710.Google Scholar
Hicks, Alexander, and
Duane Swank.
1992.
Politics, Institutions and Welfare Spending in Industrialized
Democracies, 1960–82.
American Political Science Review
86 (2):658–674.Google Scholar
Huber, Evelyne, and
John D. Stephens.
1998.
Internationalization and the Social Democratic Model—Crisis
and Future Prospects.
Comparative Political Studies
31 (3):353–97.CrossRefGoogle Scholar
Huber, Evelyne, and
John D. Stephens.
2001.
Development and Crisis of the Welfare State.
Chicago:
University of Chicago Press.
Huber, Evelyne,
Charles Ragin, and
John D. Stephens.
1993.
Social Democracy, Christian Democracy, Constitutional Structure and
the Welfare State.
American Journal of Sociology
99 (3):711–49.Google Scholar
International Monetary Fund (IMF).
Selected years.
International Financial Statistics.
Washington, D.C.:
IMF.
Iversen, Torben.
1999.
Contested Economic Institutions: The Politics of Macroeconomics and
Wage Bargaining in Advanced Democracies.
New York:
Cambridge University Press.
Iversen, Torben.
2001.
The Dynamics of Welfare State Expansion: Trade Openness,
De-Industrialization and Partisan Politics. In
The New Politics of the Welfare State, edited by
Paul Pierson,
45–79.
Oxford:
Oxford University Press.
Iversen, Torben, and
Thomas R. Cusack.
2000.
The Causes of Welfare State Expansion: Deindustrialization or
Globalization?
World Politics
52 (3):313–49.Google Scholar
Judge, George G. R.,
Carter Hill,
W. E. Griffiths,
Helmut Lütkepohl, and
Tsoung-Chao Lee.
1985.
The Theory and Practice of Econometrics. 2d ed.
New York:
Wiley.
Kenworthy, Lane.
2001.
Wage Setting Measures: A Survey and Assessment.
World Politics
54 (1):57–98.Google Scholar
Kittel, Bernhard, and
Hannes Winner.
Forthcoming.
How Reliable Is Pooled Data in Political Economy: The
Globalization-Welfare State Nexus?
European Journal of Political Research
44 (2).
Korpi, Walter, and
Joakim Palme.
2003.
New Politics and Class Politics in the Context of Austerity and
Globalization: Welfare State Regress in 18 Countries,
1975–1995.
American Political Science Review
97 (3):425–46.Google Scholar
Krugman, Paul.
1995.
Development, Geography, and Economic Theory.
Cambridge, Mass.:
MIT Press.
Lange, Peter, and
Geoffrey Garrett.
1985.
The Politics of Growth: Strategic Interaction and Economic
Performance in the Advanced Industrial Democracies,
1974–1980.
Journal of Politics
47 (3):792–827.CrossRefGoogle Scholar
Lijphart, Arend.
1984.
Democracies: Patterns of Majoritarian and Consensus Government in
Twenty-One Countries.
New Haven, Conn.:
Yale University Press.
Moller, Stephanie,
David Bradley,
Evelyne Huber,
Francois Nielsen, and
John D. Stephens.
2003.
Determinants of Relative Poverty in Advanced Capitalist
Democracies.
American Sociological Review
68 (1):22–51.Google Scholar
Myles, John, and
Paul Pierson.
1997.
Friedman's Revenge: The Reform of “Liberal” Welfare
States in Canada and the United States.
Politics and Society
25 (4):443–72.Google Scholar
Organization for Economic Cooperation and Development
(OECD).
1994.
New Directions in Social Policy.
Paris:
OECD.
Organization for Economic Cooperation and Development
(OECD).
1996a.
International Sectoral Data Base.
Paris:
OECD.
Organization for Economic Cooperation and Development
(OECD).
1996b.
Social Expenditure Statistics of OECD Member Countries.
Paris:
OECD.
Organization for Economic Cooperation and Development
(OECD).
Selected years.
Economic Outlook.
Paris:
OECD.
Organization for Economic Cooperation and Development
(OECD).
Selected years.
Labor Force Statistics.
Paris:
OECD.
Organization for Economic Cooperation and Development
(OECD).
Selected years.
National Accounts of OECD Member Nations.
Paris:
OECD.
Organization for Economic Cooperation and Development
(OECD).
Forthcoming.
OECD Database on Entitlements and Replacement Rates.
Paris:
OECD.
Pierson, Paul.
1994.
Dismantling the Welfare State? Reagan, Thatcher, and the Politics of
Retrenchment.
New York:
Cambridge University Press.
Pierson, Paul.
1996.
The New Politics of the Welfare State.
World Politics
48 (2):143–79.Google Scholar
Pierson, Paul.
2001a.
Post-Industrial Pressures on the Mature Welfare States. In
The New Politics of the Welfare State, edited by
Paul Pierson,
80–104.
Oxford, England:
Oxford University Press.
Pierson, Paul.
2001b.
Coping with Permanent Austerity: Welfare State Restructuring in
Affluent Democracies. In
The New Politics of the Welfare State, edited by
Paul Pierson,
410–56.
Oxford:
Oxford University Press.
Ploemper, Thomas,
Vera E. Troeger, and
Philip Manow.
Forthcoming.
Panel Data in Comparative Politics: Linking Method to Theory.
European Journal of Political Research
44 (2).
Quinn, Dennis.
1997.
The Correlates of Change in International Financial
Regulation.
American Political Science Review
91 (3):531–51.Google Scholar
Quinn, Dennis, and
Carla Inclan.
1997.
The Origins of Financial Openness: A Study of Current and Capital
Account Liberalization.
American Journal of Political Science
41 (3):771–813.CrossRefGoogle Scholar
Rodrik, Dani.
1997.
Has International Economic Integration Gone Too Far?
Washington, D.C.:
Institute for International Economics.
Rodrik, Dani.
1998.
Why Do More Open Economies Have Bigger Governments?
Journal of Political Economy.
106 (5):997–1032.Google Scholar
Scharpf, Fritz.
1999.
Governing in Europe: Effective and Democratic?
New York:
Oxford University Press.
Scharpf, Fritz, and
Vivien A. Schmidt.
2000.
Conclusions. In
Welfare and Work in the Open Economy, Volume 1: From Vulnerability
to Competitiveness, edited by
Fritz W. Scharpf and
Vivien A. Schmidt,
310–36.
New York:
Oxford University Press.
Skocpol, Theda.
1992.
Protecting Soldiers and Mothers: The Political Origins of Social
Policy in the United States.
Cambridge, Mass.:
Belknap Press.
StataCorp.
2004.
Stata 8.0.
College Station, Texas:
StataCorp.
Stephens, John D.
1979.
The Transition from Capitalism to Socialism.
London:
Macmillan.
Swank, Duane H.
2002.
Diminished Democracy?
New York:
Cambridge University Press.
Tsebelis, George.
1995.
Decision-Making in Political Systems: Veto Players in
Presidentialism, Parliamentarism, Multicameralism and
Multipartyism.
British Journal of Political Science
25 (3):289–325.CrossRefGoogle Scholar
United Nations.
Selected years.
Demographic Yearbook.
New York:
United Nations.
Weede, Erich.
1995.
Economic Development, Social Order, and World Politics.
Boulder, Colo.:
Lynne Rienner.
Western, Bruce.
1997.
Between Class and Market: Postwar Unionization in the Capitalist
Democracies.
Princeton, N.J.:
Princeton University Press.
White, Halbert.
1980.
A Heteroskedasticity-Consistent Covariance Matrix Estimator and a
Direct Test for Heteroskedasticity.
Econometrica
48 (4):817–30.CrossRefGoogle Scholar
Wilensky, Harold L.
1981.
Leftism, Catholicism, and Democratic Corporatism. In
The Development of Welfare States in Europe and America,
edited by
Peter Flora and
Arnold Heidenheimer,
345–82.
New Brunswick, N.J.:
Transaction.
Williamson, John.
1990.
What Washington Means by Policy Reform. In
Latin American Adjustment: How Much Has Happened?, edited by
John Williamson,
5–20.
Washington, D.C.:
Institute for International Economics.
Annual OECD means for trade openness, outward FDI, and financial liberalization, 1978–94
The incidence of welfare retrenchments in eighteen affluent democracies, 1978–94
Summary statistics
Cox models of OECD welfare retrenchments, 1978–94
Models of OECD welfare effort, 1978–94
Country-years with retrenchment events, by duration (years) and threshold of change
 You have
Access
- 44
- Cited by