


Introduction
Accurate surface topography is an essential boundary condition for atmospheric modelling. It affects calculations of precipitation, surface temperatures, and wind intensity and direction. Adequate resolution is also required to produce accurate estimates of surface fluxes. Before the launch of ERS-1, in 1991, the topography of Antarctica beyond 72° S was poorly known, and large errors existed in the available dataset (Reference BamberBamber, 1994a). The geodetic phase of ERS-1, which was completed in May 1995, has provided unprecedented coverage by satellite radar altimetry, of the ice sheet up to a latitude of 82° S (Fig. 1). This denser coverage, compared to previous missions and earlier phases of the ERS-1 mission, has improved the accuracy of the derived digital-elevation model (DEM) for three reasons: (1) more of the marginal regions have coverage, necessitating less interpolation of the data, (2) the reduced spacing between adjacent sub-satellite tracks means that the slope-induced error (see later) is reduced, and (3) random errors in individual altimeter height measurements (which are at their largest near the margins) can be reduced by averaging the data locally.
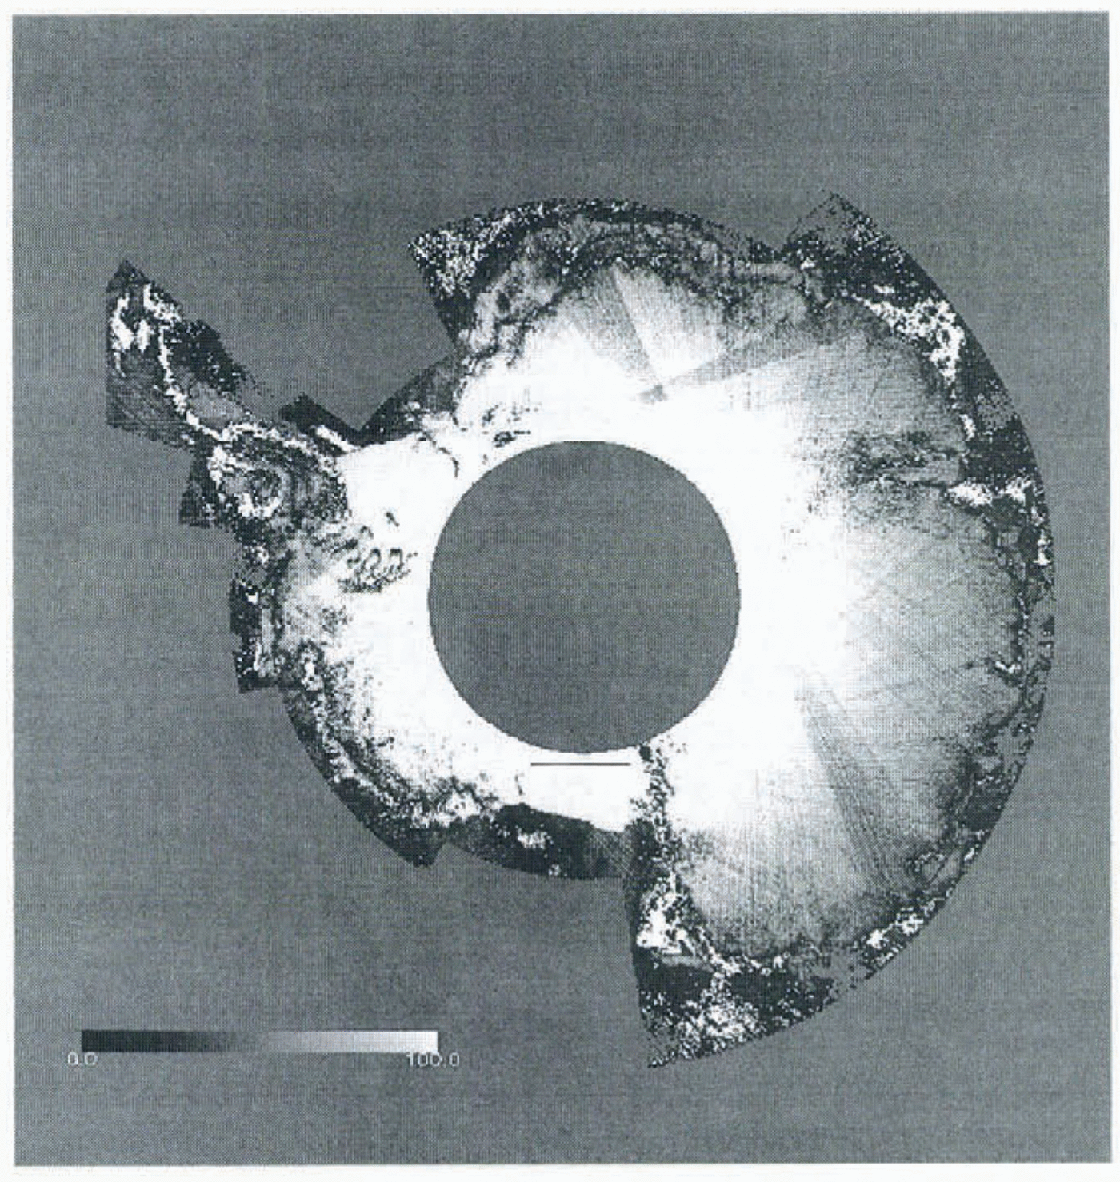
The number of radar-altimeter height estimates used to produce the local average x, y, z value. Areas in white indicate regions where no, or insufficient, data were present within the vicinity of the gridpoint and provide an indication of those gridcells that required an interpolated estimate of elevation from the surrounding cells. The solid black line on the Ross Ice Shelf shows the location of the height profile plotted in Figure 5.
In this paper we present a new 5 km resolution surface DEM, derived from the geodetic phase of ERS-1, and provide evidence that the improved resolution of this dataset, combined with an updated ice-thickness grid (Reference Bamber and HuybrechtsBamber and Huybrechts, 1996) gives new insights into the form and flow of the Antarctic ice sheet. Imagery from the Landsat Thematic Mapper (TM) instrument has been combined with the new bed-elevation grid to identify the location of the “onset of Streaming” of Ice Stream D. The datasets have been used to calculate basal driving stresses over areas of grounded ice, and three regions in the vicinity of the Ross Ice Shelf are examined in detail as examples of the value of the datasets.
Datasets and Reduction Methods
In March 1995, ERS-1 was placed in two long repeat cycles of 168 days. The two phases were offset from each other so that they were equivalent to a single 336 day cycle, providing 8.3 km across-track spacing at the Equator. This reduces to about 4 km at 60° latitude and 2 km at 70°. The along-track spacing of each altimeter height measurement is 335 m. The total number of data points, after filtering (see below), over the ice sheet was about 40 million.
The data-eduction methodology has been described, in detail, elsewhere (Reference BamberBamber, 1994b; Reference Bamber and HuybrechtsBamber and Huybrechts, 1996) and therefore only the most relevant points are mentioned here. To improve the accuracy of elevation estimates over ice sheets, it is necessary to apply a range-estimate refinement procedure (known as wave-form retracking) and a slope correction to provide the correct range and location for the corresponding sub-satellite ground point. The former was carried out using the offset centre of gravity method for calculating the wave-form amplitude, with a power threshold of 25%. This threshold was chosen as it best represents the mean height over a topographic surface (Reference Partington, Ridley and ZwallyPartington and others, 1989). Slope correction was applied using the relocation method with several modifications (Reference BamberBamber, 1994b).
Appropriate data filtering is required over non-ocean surfaces due to frequent occurrences of anomalous height returns. Fourteen different tests were applied to the return-echo wave-form shape, backscalter coefficient, and retracking correction value for each altimeter height estimate. Approximately 27% of the data were removed during this filtering procedure. The majority of these bad data were associated with the altimeter having lost “lock” of the ice-sheet surface in areas of high relief, before the instrument software had registered that loss of lock had occurred. A further step was required to remove the occasional spurious orbit. These were identified by comparing one track with another at the point where they cross each other (known as crossover analysis). The majority of poor orbits were found to the close in time to orbit manoeuvres of the satellite, even though the orbit-manoeuvre flag in the data product was not set and had not been for one two revolutions of the satellite.
Onee the various corrections had been applied, and filtering carried out, the data were interpolated onto a 5 km grid. A polar stereographic projection, with the origin at the South Pole and a standard parallel of 71° S was used to translate from polar to Cartesian co-ordinates. This is a standard projection used for Antarctica.
The spatial distribution of the altimeter data is highly anisotropic — estimates are separated by 335 m along-track and by up to 4 km across-track. To prevent introducing biases on individual gridpoints (due to the spatial sampling pattern and grid spacing) a two-stage gridding procedure was employed. the first step involved producing local distance-weighted means of x, y and z in the region of a grid-point, producing a quasi-regular array of average height estimates. A triangulation procedure was then used to interpolate to the exact gridpoint locations (Reference Renka and ClineRenka and Cline, 1984) and to extrapolate to gridpoints where no altimeter data were present.
The density of data coverage is shown in Figure 1. No land mask has been applied to this plot, so areas of sea ice and open water are also included. The value plotted is the number of points used in the first step of the interpolation procedure described above (i.e. the number of points in each 5 km gridcell). Areas where no valid data were present tire shown in white (8% of the area covered by the satellite had no valid data present). The areas with the poorest or no coverage are in regions of high relief, such as the Transan-tarctic and Prince Charles Mountains, along the Peninsula and around the periphery of the Amery fee Shelf. To improve the visual definition near the margins, the maximum value plotted is 100, although near the latitudinal limit of the satellite, the number of points in each gridcell exceeds 1000. Coverage of the Ross and Filchner Ronne Ice Shelves is excellent and few data were removed during the filtering for these areas. Three “wedges” of lower density coverage can be seen where certain ground-tracks were not available due to storage limitations of the on-board tape recorder.
The ice-thickness grid was derived from a combination of the original radio-echo sounding data and a re-digitisation of the Antarctic folio map (Reference Bamber and HuybrechtsBamber and Huybrechts, 1996). Bed elevations were calculated as the difference between the two for regions of grounded ice only.
The accuracy of the ice-thickness grid has been discussed elsewhere (Reference Bamber and HuybrechtsBamber and Huybrechts, 1996). Limited in situ datasets are available to validate the surface DEM. Comparison with two GPS surface-levelling datasets around Dome C and the Lambert Glacier drainage basin were used to determine the accuracy of the DEM presented in Reference Bamber and HuybrechtsBamber and Huybrechts (1996) and similar results were obtained for the new surface DEM. It is not possible to provide a quantitative estimate, therefore, of the improvement in accuracy of the new DEM based on ground-truth data. Comparison of the coverage of data used to produce the two datasets gives a qualitative indication of the improvement. Due to the relatively wide-track spacing of the altimctric dataset used in Reference Bamber and HuybrechtsBamber and Huybrechts (1996), 22% more of the gridpoints contained interpolated height estimates from neighbouring cells (i.e. not derived from altimeter measurements within the radius of the gridpoint).
Results
Bed digital elevation model
A substantial part of East Antarctica is devoid of reliable ice-lhickness data (Reference Bamber and HuybrechtsBamber and Huybrechts, 1996, Fig. 2). In these regions, the bed elevations will be less reliable, and the true spatial resolution much worse, than the 10 km grid spacing. Only the large-scale (100–200 km) basal topography is meaningful in these regions. Where radio-echo sounding data are present, however, real detailed basal topography can be resolved and has been preserved in the gridded dataset.
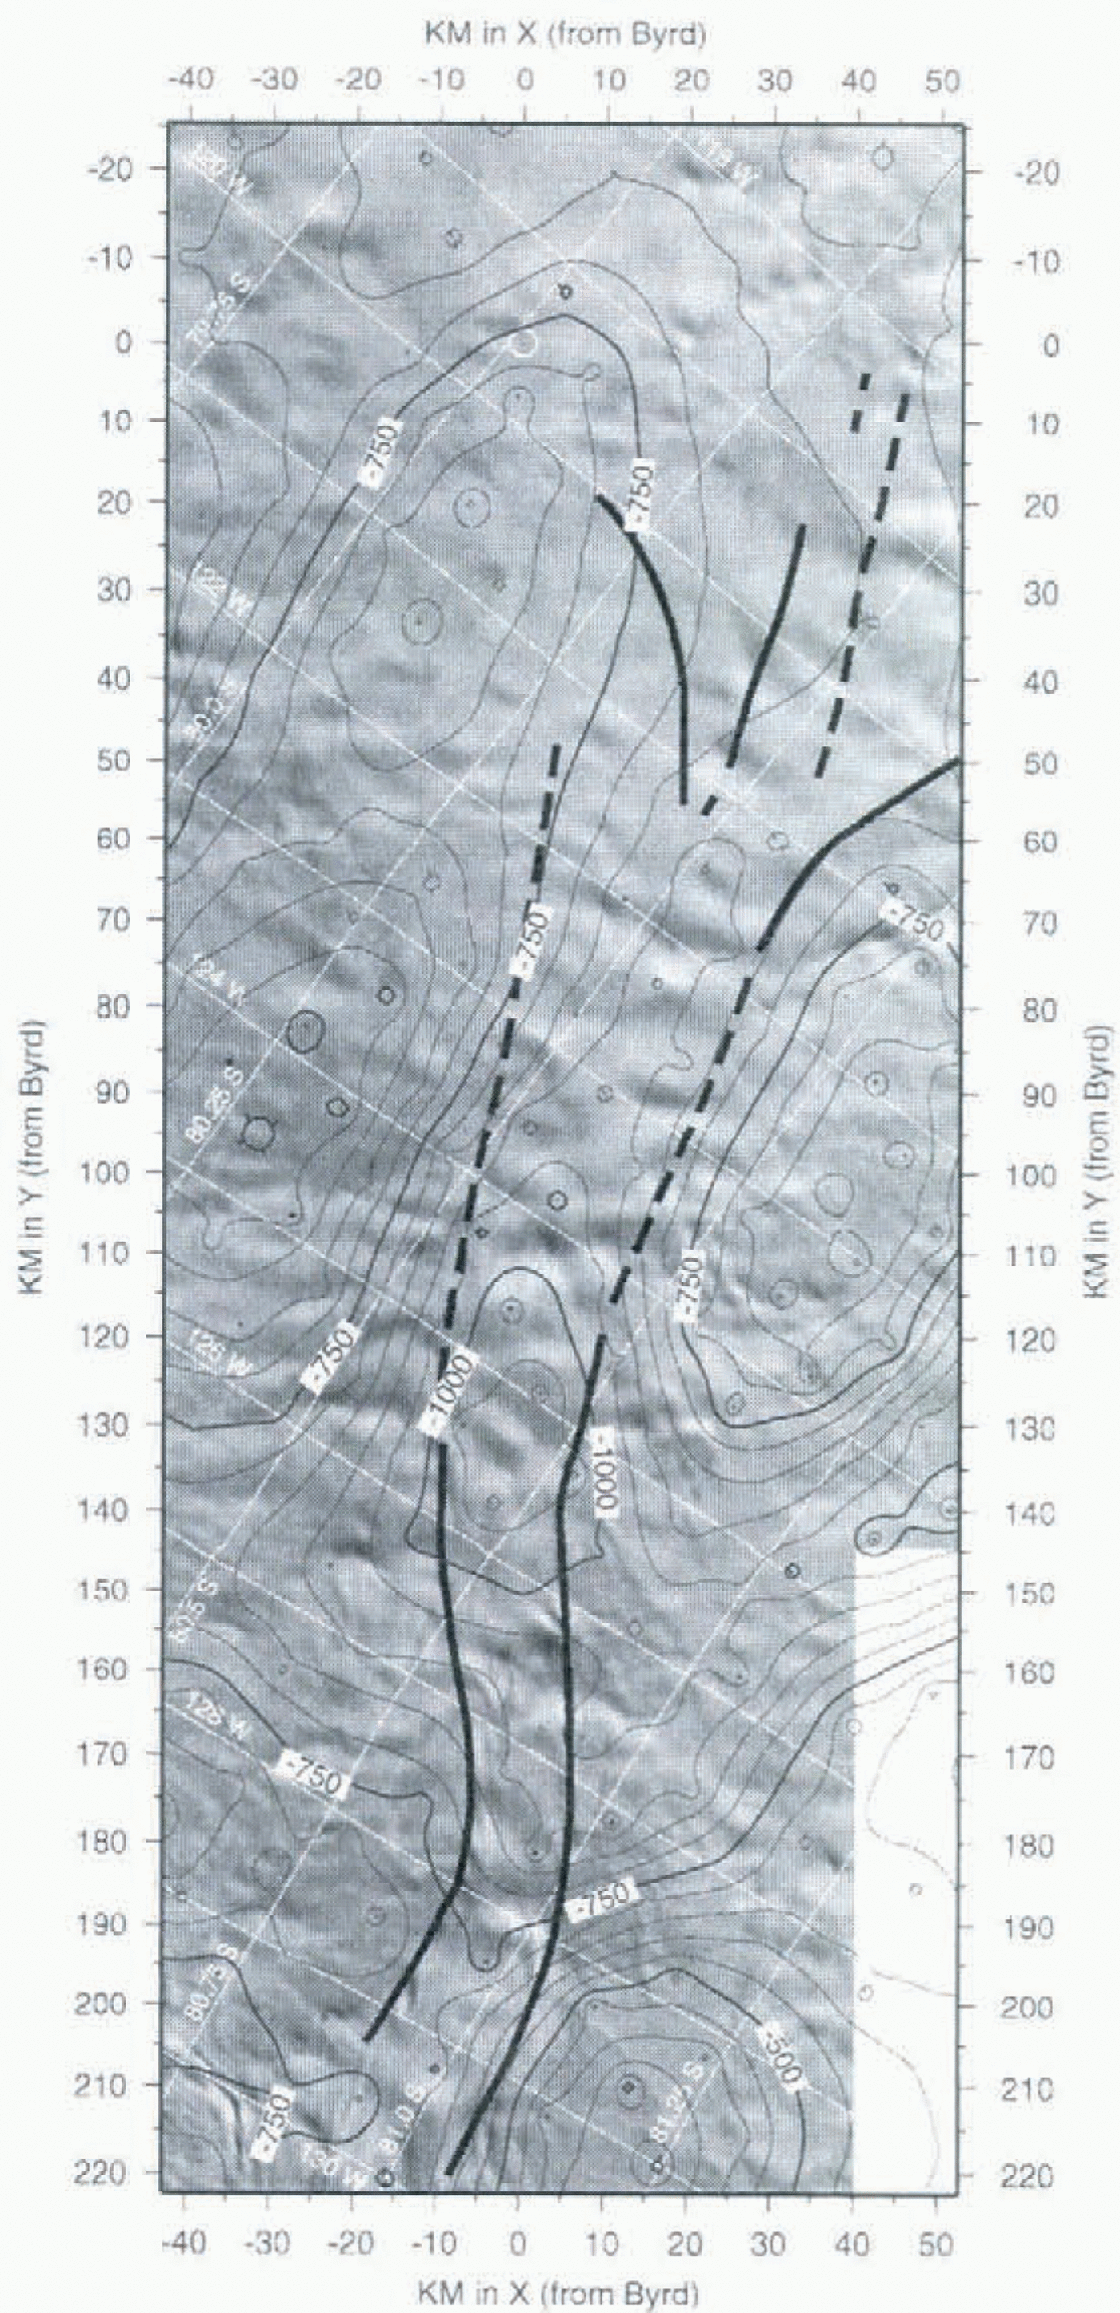
Combination of Landsat TM imagery and the ice-thickness grid in the region of Ice Stieam D (West Antarctica) reveals the level of detail in the gridded dataset. At the onset region of Ice Stream D, the development of streaming flow coincides with an over-deepened bed channel. This is shown in Figure 2, which superimposes the new bed-elevation data on portions of two Landsat TM images (Path 233, Row 118, ID#4270814203; Path 233, Row 119, ID#5105014074, Reference Bindschadler, Vornberger, Blankenship, Scambos and JacobelBindschadler and others, 1996). The boundary of the ice stream is clearly visible in the imagery, and coincides with a “valley” in the bed grid. It is clear that the direction of this incipient flow is controlled by the basal topography. This is a new finding that is the result of the improved bed-elevation grid produced by Reference Bamber and HuybrechtsBamber and Huybrechts (1996). The contouring of the Scott Polar Research Institute Folio maps (Reference DrewryDrewry, 1983), combined with multiple digitisations of them, fails to preserve much of the detail contained in the original data, and shows no sign of the over-deepening found in the revised dataset, and observed, indirectly, in the Landsat imagery.
A mosaic of two Landsat TM images (Path 233, Row, 118,ID#4270814203; Path 233, Row 119, ID#5105014074) for the onset region of Ice Stream D. Bed elevation contours from the 10 km dataset have been overlaid to indicate correspondence between bed topography and the surface expression of streaming, as indicated in the imagery. The solid black lines, based solely on interpretation of the imagery, show the approximate boundary of the ice stream.
Surface digital elevation model
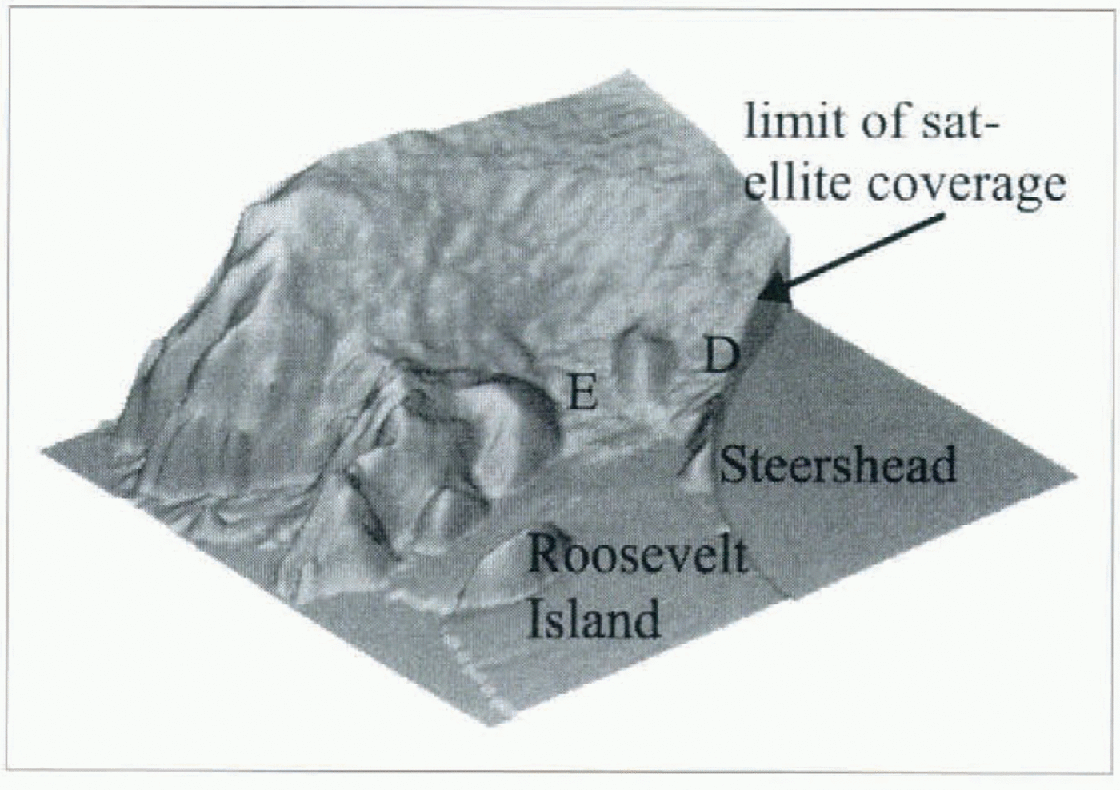
The spatial resolution of the surface DEM presented here, and its vertical accuracy in the regions where the slope is between about 0.4 and 0.65°, is a significant improvement over the datasets presented in Reference Bamber and HuybrechtsBamber and Huybrechts (1996). The level of detail can be seen in a number of examples taken from the region around the Ross Ice Shelf. Figure 3 is a shaded isometric view of the western side of Ross Ice Shelf looking west, up Ice Streams D and E. The north edge of Siple Dome is just within the satellite’s orbital limit, as is the major portion of Ice Stream D. This view illustrates that the elevation field is of sufficient horizontal and vertical resolution to include the undulating character of the grounded ice-sheet surface seen in moderate-resolution visible imagery (such as AVHRR, i.e. Reference Bindschadler and VornbergerBindschadler and Vornberger, 1990). The smoother surface of the inter-stream ridge separating Ice Streams D and E is clear, as is the smoother surface of Roosevelt Island. The grounding zone, where there is a rapid change in surface slope, can also be clearly distinguished, and a comparison between the altimeter-derived location and that obtained from Laudsat imagery and radio-echo sounding data shows good agreement (Reference Jacobel, Robinson and BindschadlerJacobel and others, 1994). Also apparent on the Ice Shelf are rumples southwest of Roosevelt Island and a positive surface expression of Steceshead Crevasses due east of Siple Dome.
Shaded isometric relief map of the western side of the Ross Ice Shelf “looking” westward up Ice Streams D and E.
Although the Ross Ice Shelf looks flat and featureless in Figure 3, a vertical exaggeration of the floating part of the Shelf reveals yet more topographic detail. In Figure 4, elevations above 80 m have been truncated to illustrate the detailed structures contained in the ice-shelf topography. Steershead and the rumples mentioned above are still visible, but in addition, linear features aligned with the general direction of flow appear across the entire ice-shelf surface and other curvilinear features are apparent. Fongitudinal variations of these features’ heights probably contain information on historical variations in flow that await methods to decipher their evolution.
Shaded isometric relief map of the floating portion of the Ross Ice Shelf. Grounded regions have been suppressed to allow the subtle flow features on the shelf to be visible.
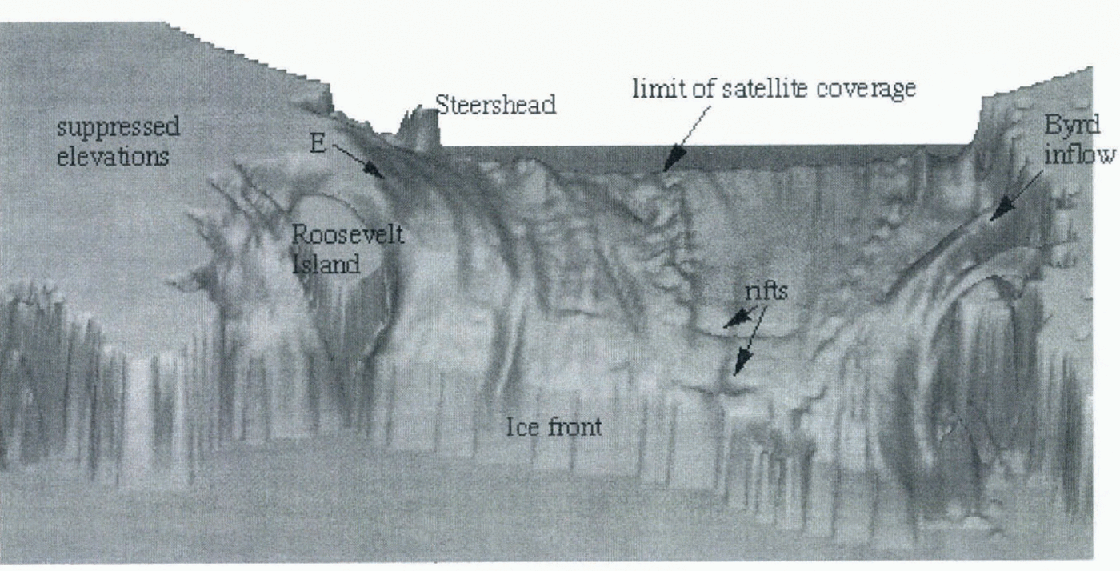
Transverse to flow, towards the ice front, two linear depressions indicate the existence of rifts that herald future, possibly major calving events. Some of these features were included in the map by Reference Cassassa and TurnerCassassa and Turner (1991), but lacked the quantitative topographic scaling that the elevation dataset provides. The vertical exaggeration in Figure 4 is significant and, although there appears to be substantial topography in the image, the actual height variation across this part of the shelf is just a few metres.
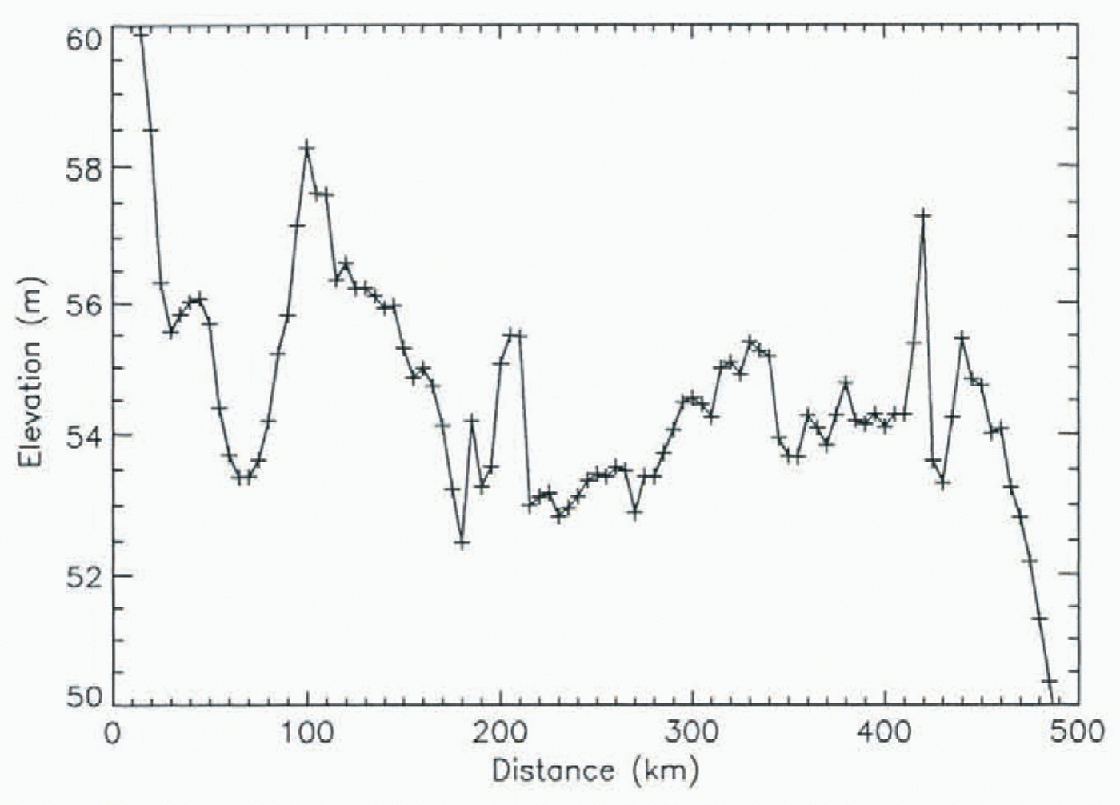
Figure 5 provides a quantitative indication of the height variation over some of these features. It is an elevation profile running across the Shelf from west to cast. The location of the profile is shown in Figure 1. The mean peak, between 60 and 170 km, is the surface expression of the inflow of one of the ice streams. This feature runs parallel to the surface expression of Ice Stream D, which is just seen at the lefthand end of Figure 5 from 0–25 km. The other smaller (in amplitude and width) peaks along the profile are the same curvilinear flow features seen in Figure 4. Most of them can be traced to close to the ice front. Even the smallest features, which are no more than 20 km wide and 50 cm high, can be traced 100 km or more downstream. The amplitude of these undulations v aries between about 50 cm and 2 m. These features contain information about the flow regime of the Shelf and the ice streams feeding it. The DEM allows, for the first time, a quantitative analysis of the surface expression of these subtle topographic undulations. These features provide an excellent example of the level of detail available in the DEM. The accuracy and noise level of the radar-altimeter data is al its best over the ice shelves as they are the flatest regions in Antarctica, and the returned-echo wave forms are less variable than those from more topographic regions. Nonetheless, similar levels of topographic detail, related to longitudinal stresses in the ice, can be seen in the surface DEM over other regions of grounded ice.
An elevation profile across the Ross Ice Shelf running from west to east and starting at the edge of the surface expression of Ice Stream D. The location of the profile ts shown as a solid black line in Figure 1.
Basal driving stresses
An alternative representation of this dataset that can often provide additional glaciological insight, is the driving stress. Driving stress τ is calculated using the following equation:

where ρ is the mean density of ice (taken as 910 kg m−3), g is the acceleration due to gravity, h is the mean ice thickness, and α is the surface slope averaged over a distance of 10 × h (Reference PatersonPaterson, 1981). The spatial variation in driving stress generally is more dependent upon variations in surface slope than thickness. Thus Figure 6 quantitatively represents many of the same features qualitatively seen in Figure 3, such as the extremely low driving stress on the ice shelf due to the low surface slopes, and the spatial variations in driving stress on the grounded ice due to the variations in surface slope.
Basal driving stress calculated for the Ross Ice Shelf region.
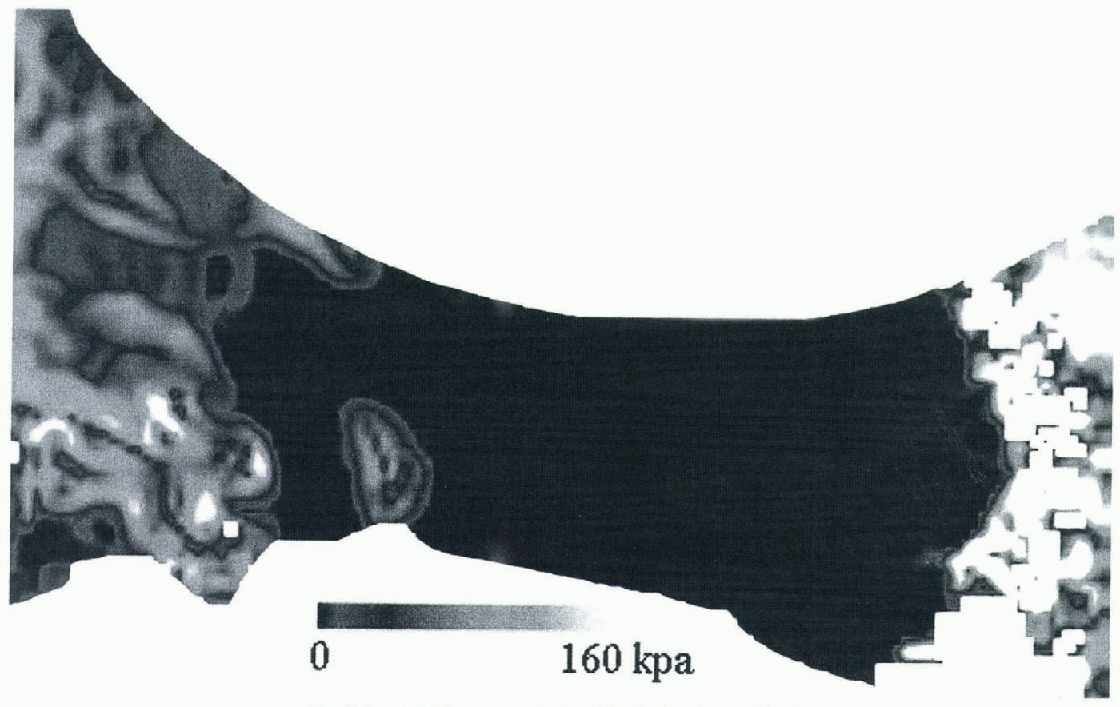
However, Figure 6 also provides additional details that are not apparent in Figure 3: the low driving stresses of Ice Streams D and E relative to the surrounding ice, an isolated region of extremely low driving stress at the confluence of D and E, and a peculiar quasi-periodic variation of driving stress on E. The first two have been noted elsewhere (i.e. Reference Bamber and BentleyBamber and Bentley, 1994; Reference Bindschadler, Vornberger, Blankenship, Scambos and JacobelBindschadler and others, 1996), but the last is new.
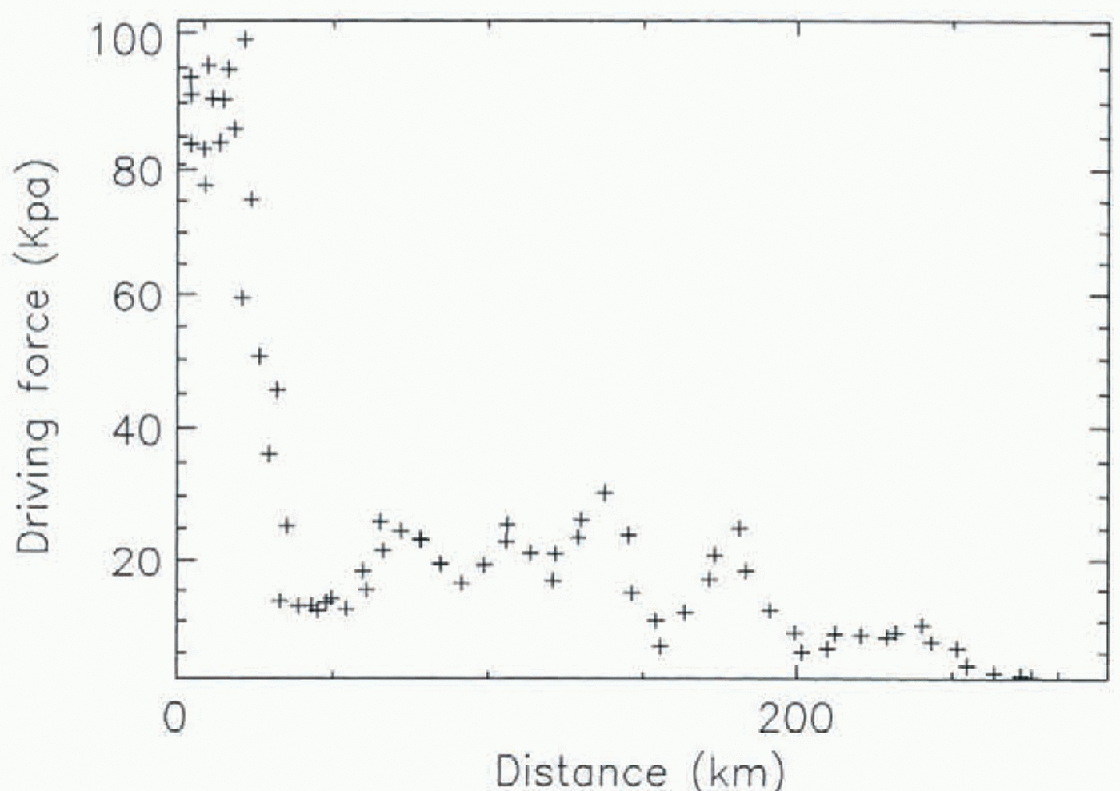
Figure 7, a longitudinal profile of driving stress calculated along the centre flow-line from before the onset of streaming to the point where flotation takes place, shows that this oscillation has an approximate wavelength of 60 km, and a variable amplitude of between 10 and 30 kPa. The regions of higher driving stress on Ice Stream E in Figure 6 correlate well with the regions of increased surface undulations, inferred by Reference Bindschadler, Vornberger, Blankenship, Scambos and JacobelBindschadler and others (1996) to be regions of higher basal resistance. They also correlate, although generally less well, with the regions of higher basal resistance calculated by Reference MacAyeal, Bindschadler and ScambosMacAyeal and others (1995). The poorer correlation with the results of MacAyeal and others is probably due to the fact that their method began with a less well-known surface-elevation field and attempted, by way of control methods, to adjust the fields of elevation, ice thickness and velocity from initial estimates simultaneously in a way that was consistent with a designated flow law. Beginning with a better surface-elevation field would improve the ability of the method to calculate a more accurate basal-stress distribution.
A longitudinal profile of driving stress, running down the centre flow-line of Ice-Stream E.
Summary
Through a focused and specific investigation in the vicinity of the Ross Ice Shelf we have demonstrated the value and potential that the new surface- and bed-elevation grids have for ice-sheet modelling. Although we have concentrated, here on the glaciological potential of the datasets, they are also valuable for climatological modelling studies. This application is explored in Reference Marsiat and BamberMarsiat and Bamber (1997). Problems remain in providing adequate surface-elevation estimates south of 82° and, until the launch of the Geoscienees Laser Altimeter System currently scheduled for 2002, few newdata are likely to become available. Methods applying photoclinometry to AVHRR data, however, personal communication with Scambos and Fahnestock, 1997) may be able to improve the surface DEM for this region.
Problems also exist with the bed-elevation data for approximately 60% of the East Antarctic ice sheet. However, radio-echo sounding datasets exist that it is hoped will be incorporated in a future revision of the ice-thickness grid thus improving the accuracy and resolution of the dataset in this region.
Acknowledgements
The authors would like to thank P. Vornberger for providing Figure 2. J. L. Bamber was funded by a UK NERC Earth Observation lectureship. R. A. Bindschadler was supported by NSF grant 9317627.



