

I. INTRODUCTION
Imaging systems for security applications have been in the focus of intense research for a number of years. A great number of systems and techniques have been investigated in typical application fields, for example passenger [Reference Sheen, McMakin and Hall1] and luggage [Reference Nercessian, Panetta and Agaian2] scanners for conceiled weapon detection. Main objectives of all these systems are a quick imaging process combined with a highly reliable detection rate to ensure a large inspection throughput as well as an enhanced security level. Further important issues are health and privacy considerations. Since electromagnetic waves in the millimeter wave region are of non-ionizing nature, but yet deliver well-resolved images, this spectral region is the preferred choice for passenger scanners. Apart that, an automated threat detection is desirable to protect the privacy of scanned persons. Hence, algorithms for the automatic detection of dielectrics have been developed. These can, for example, be based on time domain analysis of radar data [Reference von Aschen, Gumbmann and Schmidt3] or the exploitation of the co-polarization scattering information of scenes [Reference Cenanovic, Gumbmann and Schmidt4]. These algorithms deliver the relative permittivity and thickness of dielectrics; however, a statement about the geometrical form of the dielectrics, e.g. about surface structurings, edges or curvatures, cannot be made offhand. The H-α decomposition method investigated here, is well-known from remote sensing of the earth surface [Reference Cloude and Pottier5, Reference Lee and Pottier6]. The approach is based on an eigenvalue examination of the fully polarimetric scattering properties of a region. The number of elemental scattering processes and an average scattering process within each resolution cell of the imaged region is deduced. This allows for the classification of the region, for example for its dominant vegetation type. Here, this classification method is investigated for close range security applications. Every threat object is likely to consist of a unique composition of elementary scattering processes, which depends on its geometrical structure. This H-α fingerprint allows for a threat object classification.
II. H-α-DECOMPOSITION AND CLASSIFICATION SCHEME
Assume a two dimensional (2D) distribution of scatterers as in Fig. 1, for which the polarimetric scattering properties have been determined in form of the Sinclair matrix S(x, y). With EH = E HuH and EV = E VuH, where uH and uV represent the unit vectors in horizontal (H) and vertical (V) direction, the matrix S(x, y) can be found for each point (x, y) of the scene from the evaluation of
 $$\left[\matrix{E_{\rm H\comma s} \lpar x\comma \; y\rpar \cr E_{\rm V\comma s} \lpar x\comma \; y\rpar } \right]= {\bi S} \left(x\comma \; y \right)\cdot \left[\matrix{E_{\rm H\comma i} \lpar x\comma \; y\rpar \cr E_{\rm V\comma i} \lpar x\comma \; y\rpar } \right]\comma$$
where
 $${\bi S}\left(x\comma \; y \right)= \left[\matrix{S_{\rm HH} \lpar x\comma \; y\rpar &S_{\rm HV} \lpar x\comma \; y\rpar \cr S_{\rm VH} \lpar x\comma \; y\rpar &S_{\rm VV} \lpar x\comma \; y\rpar } \right].$$
2D distribution of scatterers in an xy-coordinate system with horizontal and vertical polarization vectors EH and EV. Angle θ describes the angular offset between the coordinate systems.

The vectors [E H,i(x, y), E V,i(x, y)]T and [E H,s(x, y), E V,s(x, y)]T denote the polarization state of the incident and the scattered wave in the plane of the scene. When the angle θ between the coordinate systems in Fig. 1 is 0°, the H polarization oscillates in x-direction and the V polarization in y-direction, respectively. Since S HV(x, y) = S VH(x, y) for any real and reciprocal antenna, the Pauli scattering vector k(x, y) can be calculated from the Sinclair matrix via the relation
 $${\bi k}\lpar x\comma \; y\rpar = \displaystyle{1 \over \sqrt{2}} \left[\matrix{S_{\rm HH} \lpar x\comma \; y\rpar + S_{\rm VV} \lpar x\comma \; y\rpar \cr S_{\rm HH} \lpar x\comma \; y\rpar - S_{\rm VV} \lpar x\comma \; y\rpar \cr 2 \cdot S_{\rm HV} \lpar x\comma \; y\rpar } \right].$$
This vector is more affiliated to the physical nature of the scattering process. The first element of k(x, y) is proportional to odd bounce scattering behavior, e.g. in the case of specular reflection at a flat surface. The second element indicates even bounce characteristics, for instance dihedral scattering. Finally, the third element of k(x, y) depends on the cross-polarized part of S(x, y) and therefore indicates diffuse scattering processes. Hence, from the value of k(x, y), the physical character of the imaged scatterers can be concluded.
However, a great disadvantage of k(x, y) is its dependency on the angle θ between the coordinate system of the employed polarization basis and the spatial orientation of the scattering object. Due to this fact, different orientations of imaged objects result in different values of k(x, y), which hampers an automated detection. Hence, the coherency matrix T has to be calculated from the multiplication of k with its Hermitian transpose counterpart:
 $${\bi T} = {\bi k} \cdot {\bi k}^H = \left[\matrix{T_{11} \lpar x\comma \; y\rpar & T_{12} \lpar x\comma \; y\rpar &T_{13} \lpar x\comma \; y\rpar \cr T_{21} \lpar x\comma \; y\rpar & T_{22} \lpar x\comma \; y\rpar & T_{23} \lpar x\comma \; y\rpar \cr T_{31} \lpar x\comma \; y\rpar & T_{32} \lpar x\comma \; y\rpar & T_{33} \lpar x\comma \; y\rpar } \right].$$
The matrix can be decomposed into a set of real eigenvalues λ 1, λ 2, λ 3 and their corresponding orthogonal eigenvectors ν1, ν2, and ν3 at every point (x, y) of the scene:
 $${\bi T} = \left[\matrix{ & & \cr {\bi v}_1 & {\bi v}_2 & {\bi v}_3 \cr & &} \right]\cdot \left[\matrix{{\rm \lambda}_1 & 0 & 0 \cr 0 & {\rm \lambda}_2 & 0 \cr 0 & 0 & {\rm \lambda}_3} \right]\cdot \left[\matrix{{\bi v}_1^H \cr {\bi v}_2^H \cr {\bi v}_3^H} \right].$$
The eigenvectors and eigenvalues may be interpretated as three independent scattering processes and their respective weighting within the observed resolution cell. According to [Reference Lee and Pottier6], the eigenvectors are to be parameterized according to
 $${\bi v}_i = \left(\matrix{\cos \alpha_i e^{j\Phi_i} \cr \sin \alpha_i \cos \beta_i e^{j\lpar \delta_i + \Phi_i\rpar } \cr \sin \alpha_i \sin \beta_i e^{j\lpar \gamma_i + \Phi_i\rpar }} \right)\comma \; {\rm with}\quad i = 1\comma \; 2\comma \; 3.$$
On the one hand, this relation ensures orthogonality between the eigenvectors, while on the other hand, the three alpha values α 1, α 2, and α 3 can be evaluated. The entropy H(x, y) and the parameter α (x, y) can be calculated from the normalized eigenvalues P i(x, y):
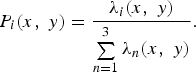 $$P_i \lpar x\comma \; y\rpar = \displaystyle{\lambda_i \lpar x\comma \; y\rpar \over \sum\limits_{n = 1}^3 \lambda_n \lpar x\comma \; y\rpar }.$$
 $$H\lpar x\comma \; y\rpar = - \sum\limits_{i = 1}^3 P_i \lpar x\comma \; y\rpar \cdot \log_3 \left[P_i \lpar x\comma \; y\rpar \right].$$
 $$\underline{\alpha} \lpar x\comma \; y\rpar = \sum\limits_{i = 1}^3 P_i \lpar x\comma \; y\rpar \alpha_i \lpar x\comma \; y\rpar .$$
Note that the calculation is based on an eigenvalue analysis and an appropriate parameterization of the eigenvectors. Since both are independent of the rotational offset θ, both H and α are independent of the offset, too. This property is referred to as the roll invariance property of the H-α decomposition, which is essential for a robust threat object classification.
The meaning of entropy H and parameter α shall be discussed here in a more detailed form. According to equation (8), the value H can vary between 0 and 1. As an entropy, it describes the disorder within a system, i.e. the disorder in the scattering behavior within the observed resolution cell. The disorder becomes largest, when three different scattering processes with equal power are present, i.e. λ 1 = λ 2 = λ 3. This behavior yields an entropy of H = 1.
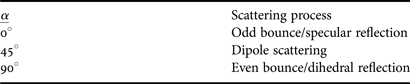
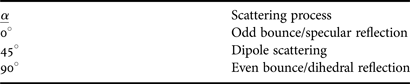
In contrast, low disorder can be observed when one scattering process dominates the total scattering behavior. In the extreme case, only one scattering process is present, for example when λ 1 ≠ 0, λ 2 = λ 3 = 0. This results in entropy H = 0. Values for H between the extremes 0 and 1 result from the presence of more than one relevant scattering process with significant power within the observed resolution cell. Parameter α can be seen as a classification parameter for the dominant scattering process in the observed resolution cell. It can take values from 0° to 90°. Three distinguished scattering processes can be assigned to the values given in Table 1. If more than one of the given scattering processes is present, α yields an averaged value.
Parameter α for elementary scattering processes.
For the object classification a subregion of the whole scene is evaluated. This area can either be directly selected by the operator or can be found with techniques identifying dielectric items, like time domain analysis methods or ellipsometric approaches ([Reference von Aschen, Gumbmann and Schmidt3, Reference Cenanovic, Gumbmann and Schmidt4]). The H and α distributions of the subregion are then transferred into a histogram, i.e. the occurrence of each possible H-α value pair within the analyzed subregion is determined. This remapping produces the H-α map N(H, α) of the subregion. For an easier characterization of the distribution N(H, α), only the weighted average regarding H and α according to
 $$G_H = \displaystyle{1 \over N_{\rm tot}} \vint_{H = 0}^1 N\lpar H\comma \; \underline{\alpha}\rpar \cdot H \ dH\comma$$
 $$G_{\underline \alpha } = \displaystyle{1 \over N_{\rm tot}} \vint_{\underline{\alpha} = 0^{\circ}}^{90^{\circ}} N\lpar H\comma \; \underline{\alpha}\rpar \cdot \underline{\alpha} \ d\underline{\alpha}\comma$$
with
 $$N_{\rm tot} = \vint_{\underline{\alpha} = 0^{\circ}}^{90^{\circ}} \vint_{H = 0}^1 N\lpar H\comma \; \underline{\alpha}\rpar \ dH\, d\underline{\alpha}\comma$$
is evaluated here. This parameter can then be compared to known values of threat objects.
III. IMAGING SETUP AND CALIBRATION PROCEDURE
The quasi-monostatic imaging setup is shown in Fig. 2. The transmit (Tx) and receive (Rx) antennas can be positioned at arbitrary locations y Tx and y Rx in y-direction, which is achieved by a vertical positioning unit for each antenna. This allows for the sampling of user-defined, one dimensional multistatic array configurations in y-direction. Furthermore, the antennas are mounted onto a common horizontal positioning unit, thus the desired multistatic column array can be sampled at any location on the x-axis. Hence, the setup allows for the sampling of 2D arrays in the xy-plane with multistatic operation in y-direction.
Multistatic measurement system consisting of a network analyzer with two extenders (covered with black absorber material) to reach the W-band, and two horn antennas.
For the pursued fully polarimetric imaging two types of horn antennas with different polarization are employed. The H and V antennas are polarized in x- and y-direction, hence θ = 0° in Fig. 1. Both antenna types possess a polarization decoupling ratio of at least 24 dB within an angle of 24° in azimuth and elevation around the antennas' main radiation direction.
Test objects are positioned in a distance z 0 in negative z-direction. To completely measure the polarimetric scattering behavior of a scene, three main measurements for the two co-polarization terms (S HH, S VV) and for one cross-polarization term (S HV or S VH) are performed. The antenna configuration has to be adjusted accordingly in each case. However, the measured datasets cannot be processed offhand. Assuming r′(f, x, y Tx, y Rx) to be the measurement dataset of one of the three main measurements, it can be written:
 $$r^{\prime}\lpar f\comma \; x\comma \; y_{\rm Tx}\comma \; y_{\rm Rx} \rpar = r\lpar f\comma \; x\comma \; y_{\rm Tx}\comma \; y_{\rm Rx}\rpar \cdot e_{\rm sys} \lpar f\rpar + e_{\rm ct} \lpar f\comma \; y_{\rm Tx}\comma \; y_{\rm Rx}\rpar .$$
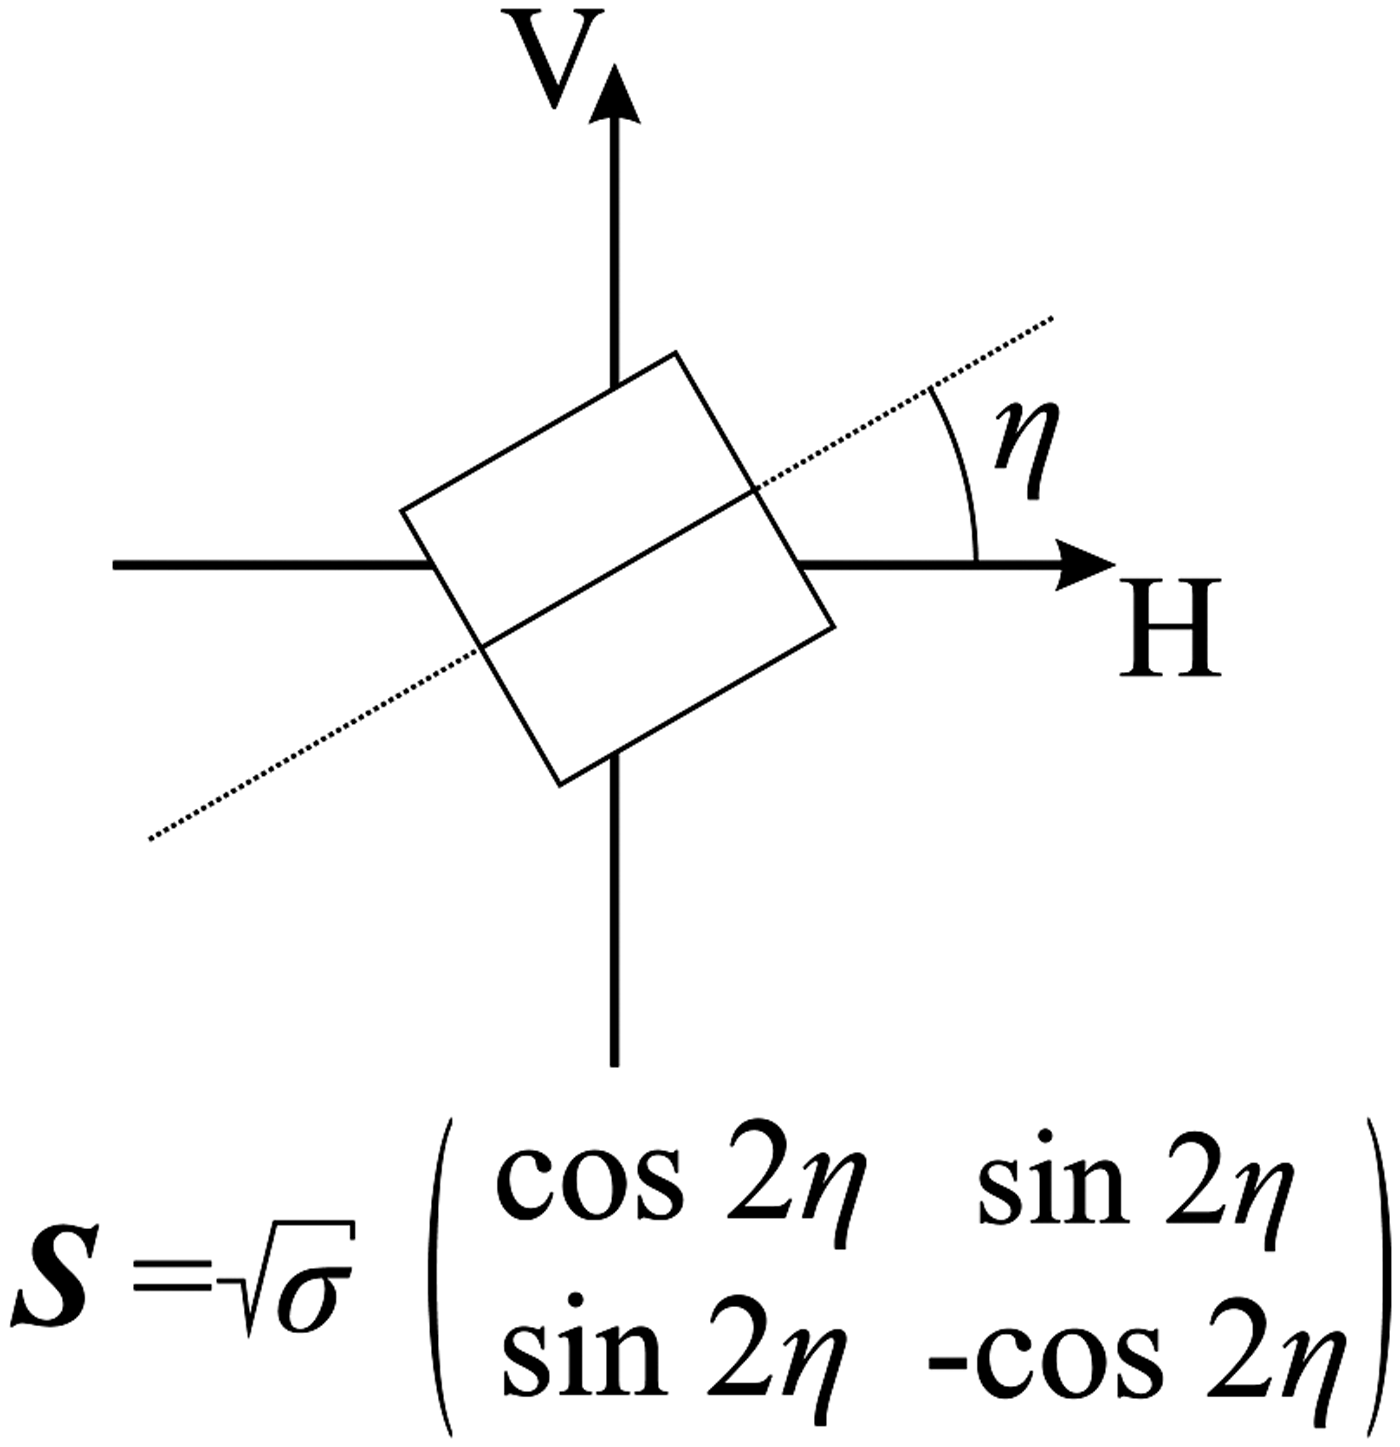
The terms e sys(f) and e ct(f, y Tx, y Rx) model the frequency characteristics of the system components and the antenna crosstalk, respectively. Since the multistatic array operation is only performed in y-direction, the antenna crosstalk term does not depend on x. The frequency dependency of the system components is identical for all transmit–receive combinations, hence the corresponding term only depends on f. The term r(f, x, y Tx, y Rx) represents the desired error-free scattering information of the objects to be imaged, but cannot be acquired directly. For this reason, a response and isolation calibration is performed based on the error model and calibration scheme proposed in [Reference Wiesbeck and Riegger7]. Two preparative measurements are conducted for each main measurement data set r′(f, x, y Tx, y Rx). First, an empty space measurement is performed, yielding e ct(f, y Tx, y Rx). Second, a measurement with a reference target with distinctive polarimetric scattering behavior is conducted. A dihedral mirror as in Fig. 3, can be employed for both co-polarization (η = 0°) and cross-polarization (η = 45°) calibration measurements. Since this second measurement is to eliminate the influence of e sys(f), it suffices to perform the measurement for only one transmit–receive constellation of the antennas, for example at the first transmit position y Tx,1 and y Rx = y Tx,1. Thus, the measurement yields a term r ref(f). A calibrated raw data set r cal(f, x, y Tx, y Rx) can then be obtained from each of the three main measurement data sets r′(f, x, y Tx, y Rx) by the relation
Sketch of a dihedral reflector and its ideal scattering matrix.
 $$r_{\rm cal} \lpar f\comma \; x\comma \; y_{\rm Tx}\comma \; y_{\rm Rx}\rpar = \displaystyle{r^{\prime}\lpar f\comma \; x\comma \; y_{\rm Tx}\comma \; y_{\rm Rx} \rpar - e_{ct} \lpar f\comma \; y_{\rm Tx}\comma \; y_{\rm Rx}\rpar \over r_{\rm ref} \lpar f\rpar - e_{\rm ct} \lpar f\comma \; y_{\rm Tx\comma 1}\comma \; y_{\rm Rx} = y_{\rm Tx\comma 1}\rpar }.$$
This operation removes the influence of the antenna crosstalk and frequency dependent behavior of the system components. After time gating, the calibrated data can be processed with digital beam forming and FFT-based synthetic aperture radar (SAR) reconstruction algorithms to obtain the scatting profile of the scene in terms of the Sinclair matrix terms S HH(x, y), S HV(x, y), S VH(x, y), and S VV(x, y).
Note that the application of multistatic operation in only one spatial direction, as with the described system, offers a couple of advantages. First of all, the hardware complexity is kept at a moderate level since only one horizontal positioning unit is required. Second, the image reconstruction of the measured data is less time consuming, since the reconstruction kernels in array- and azimuth direction can be separated [Reference Gumbmann and Schmidt8]. Furthermore, the calibration effort of this system is relatively low, since the calibration measurements only have to be performed in the direction of the multistatic array, but not for the full 2D array.
IV. MEASUREMENT RESULTS
The scene to be imaged and evaluated with the H-α classification is shown in Fig. 4.
Scene of dielectric threat objects, consisting of a kitchen knife with ceramic blade, a stepped bee wax sheet with different thicknesses d 1 = 5.0 mm (yellow part), d 2 = 10.0 mm (red part), and d 3 = 15.0 mm (orange part) with relative permittivity  ${\rm \epsilon }_r \approx 2.3$ and a small bag filled with table salt (NaCl). All objects are attached to a metal plate. The red dashed line indicates the fully polarimetric imaged area for both mono- and multistatic measurement setups.
The setup consists of three dielectric threat objects. The wax sheet and the table salt are to simulate plastic explosives and dangerous powders, respectively. Since the human skin has reflection properties similar to those of metal in the millimeter-wave region due to its high water content, the threat objects are affixed to a metal plate to emulate the human body surface.
A) Monostratic imaging setup
In a first investigation, the measurement scene in Fig. 4 was imaged in a distance z 0 = 250 mm with a quasi-monostatic array configuration, i.e. y Tx = y Rx for all sampled points of the 2D aperture. A sampling stepwidth of Δd x,y = 1.5 mm was maintained in both x- and y-direction to ensure an alias-free acquisition. The polarimetric imaging was performed in the frequency interval from 100 to 105 GHz at 29 equally spaced frequency points. After calibrating the measurement data sets, a SAR reconstruction was performed using a matched filter algorithm for each measured frequency. Finally, the reconstructions at all frequency points were coherently averaged.
The result of the imaging process for the S HH(x, y) component can be seen in Fig. 5. Clearly, the metal plate regions, as well as flat dielectric surfaces like the wax sheet and partly the ceramic blade, show strong co-polarization properties. On the contrary, the knife handle and the salt bag are much darker, which is on the one hand due to their shape, i.e. the ergonomic form of the handle and on the other hand due to their inner composition, namely the orderless powder consistency of the salt. Both effects cause scattering of power into the cross-polarization and hence, the co-polarization term is smaller.
S HH(x, y) component of the imaged scene, averaged over the measured frequency interval from 100 to 105 GHz.
The result of the H-α decomposition is shown in Fig. 6. Low entropy and α values can be determined in regions with only one strong scattering process, for example in the region of the wax sheet. Here, only specular reflections from the step in permittivity at the air-wax boundary and the subjacent metal plate have to be expected. However, at the edges of the wax sheet, higher entropy and α can be determined, which is due to the additional edge scattering process. Similar behavior can be found at the knife blade. In regions with diffuse scattering objects, for example at the knife handle and the salt bag, the depolarizing behavior as a combination of several scattering processes is represented by higher values of H and α.
(a) Entropy H of the polarimetrically imaged scene. (b) Parameter α of the scene in degrees. In both figures, the colored frames indicate the areas evaluated for the H-α classification.
However, the entropy H and the parameter α generally yield relatively small values in comparison to their theoretical value range. A reason for this phenomenon can be found in the measurement bandwidth. Since the resolution δ z in z-direction, not taking focussing effects in the near field of the array into account, depends on the available bandwidth of BW = 5.0 GHz, it has the relatively large value of δ z = c 0/(2·BW) ≈ 30.0 mm. Due to this fact, the reflections of the threat objects and the metal plate lie within one range gate of the reconstruction. Thus, the calculated H and α distributions are heavily influenced by the specular reflection of the metal plate. Since in the ideal case, the decomposition of the polarimetric scattering response of a metal plate delivers the values H = 0 and α = 0°, the calculated H and α distributions tend towards these values.
For the target classification the H-α characteristics within the colored frames, which correspond to the threat objects, were evaluated. As an example, the H-α map of the salt bag and the corresponding point of weighted averages can be seen in Fig. 7. The points of weighted averages for all three threat objects are displayed in Fig. 8. Obviously, the three objects can clearly be distinguished from each other by their corresponding points of weighted averages. Furthermore, the objects can even be separated from each other under the influence of clothing. For this purpose, the scene was imaged two more times. Once with the object scene covered with one layer of thin shirt tissue (100% cotton) and once covered with two layers of thick pullover tissue (65% cotton, 35% polyester). As can be seen from Fig. 8, the points of weighted averages of the threat objects changed only slightly in comparison to the measurement without clothing. Hence, zones can be introduced to classify threat objects. In zone 1, the weighted average points of objects with mainly specular reflection behavior, like flat sheets, can be found. In zone 3 diffuse scattering objects, like powders appear. In between lies the transition zone 2, identifying items with both specular and diffuse reflection behavior. This way, the wax sheet can definitely be separated from the other objects, but the knife and the salt bag cannot clearly be distinguished from each other. However, the tendency that the points of weighted average of the salt bag generally lie at higher values of H and α than those of the knife is visible. This indicates that these objects could be separable with an optimized imaging process.
H-α map N(H, α) of the area within the blue frame in Figs 6(a) and 6(b), i.e. the table salt bag. The blue dot shows the location of the point of weighted averages in H and α.
Points of weighted averages for the wax sheet (red), the knife (yellow), and the salt bag (blue) and for different types of conceiling clothing (monostatic array configuration).
B) Multistatic imaging setup
As was observed in the previous section, the classification results of the monostatic imaging approach are heavily influenced by the strong specular reflection of the metal plate background. However, it would not be reasonable to remove the metal plate since it imitates the reflection from the human skin, which is inherent in the designated practical application. Hence, the influence of the strong specular reflection of the background has to be reduced by other means. A multistatic imaging procedure was considered here, the according array constellation is shown in Fig. 9. The dimensions of the array were chosen to be the same as for the monostatic array (L x = L y = 250 mm). A sampling interval of Δd x,y = 2.0 mm in x- and y-direction assures alias-free acquisition.
Multistatic column array configuration, consisting of 126 Rx elements flanked by two Tx elements. Employing the measurement system shown in Fig. 2, the Rx positions are sequentially sampled for each Tx position. Horizontal movement of the array expands the 2D aperture.
The antenna constellation was designed regarding illumination considerations, which are illustrated in Figs 10 and 11. The extension of the scene to be imaged in a distance z 0 from the array is assumed to be limited to the size L y of the arrays. As can be seen, different conditions apply to the illumination effective areas (IEA) for the specular reflection of the metal plate and for isotropic scatterers. For the monostatic setup, the IEA is identic for both specular reflecting metal plate and isotropic scatterers. For the multistatic array, the areas have to be investigated in dependence of the illumination situation. As far as the specular reflection from the metal plate is concerned, only field components reflected by the upper part of the metal plate can be received by the Rx elements when the upper Tx element illuminates the scene. This yields the IEA for the upper Tx element in Fig. 11(a). An analoguous consideration leads to the IEA for the lower Tx element. Together, the two IEAs yield a uniform illumination of the metal plate. Considering isotropic scatterers, the IEA spreads over the whole array length for both illumination situations, as can be seen in Fig. 11(b). This is due to the fact that all Rx elements are valid receivers for isotropic scatterers at any location within the imaging scene.
Monostatic array configuration: illumination effective area (green) for both specular reflection from the metal plate and isotropic scatterers. The black dots represent the Tx/Rx elements.
Multistatic array configuration: illumination effective areas (green) for (a) specular reflection from metal plate background and (b) isotropic scatterers. Red dots represent Rx elements, blue dots represent Tx elements.
Hence in the multistatic imaging process, each isotropic scatterer located in the image scene is effectively illuminated twice, whereas the metal plate is illuminated only once. In the monostatic case on the contrary, both metal plate and isotropic scatterers are effectively illuminated once. Therefore, the ratio between the received power from isotropic scatterers P iso and from the metal plate P mp is higher for the multistatic approach:
 $$\left. \displaystyle{P_{\rm iso} \over P_{\rm mp}} \right\vert_{\rm multistatic} \quad \gt \left. \displaystyle{P_{\rm iso} \over P_{\rm mp}} \right\vert_{\rm monostatic}.$$
A careful investigation of the monostatic results in Fig. 6 shows that the H and α values yield high values in areas with isotropic scattering behavior, thus several elementary scattering processes which were introduced in Section II are present there.
This can for example be observed in the area of the salt bag which possesses isotropic scattering properties due to the granular consistency of the salt. In turn, it can be assumed that isotropic scattering can be understood as a composition of several elementary scattering processes.
As can be seen from equation (15), more power from isotropic scatterers is present in multistatic measurement data, which must emphasize areas with several elementary scattering processes within the reconstructed image data. This in turn must yield higher values for H and α in these regions.
For the fully polarimetric imaging, the same frequency interval as in the monostatic measurement was evaluated (100–105 GHz). Calibration of the measurement data was performed according to Section III. Figure 12 shows the result of the proposed classification approach based on multistatic imaging data gained with the array setup introduced in Fig. 9. It can clearly be seen that all threat objects can easily be distinguished from each other by their corresponding points of weighted average. The absolute values of the points of weighted average generally yield higher values than for the monostatic imaging setup, which is in good accordance to the considerations made in this section. Still, hiding the threat objects under clothing has a small effect on the classification, yet its influence on the relative position of the points to each other is much smaller. For all investigated clothing scenarios, all three threat objects can be distinguished from each other and be classified with the preliminary, overlap-free zones drawn into Fig. 12, which was not possible with the monostatic approach.
Points of weighted averages for the wax sheet (red), the knife (yellow), and the salt bag (blue) and for different types of conceiling clothing. Multistatic array configuration.
V. CONCLUSION AND OUTLOOK
In this paper, a new approach for the classification of dielectric threat objects with a close range radar was presented. Based on fully polarimetric radar data, it was shown that various dielectric objects can be distinguished from each other by the location of their corresponding point of weighted averages in the H-α plane. One great advantage over other polarimetric classification schemes is the roll invariance property of the H-α decomposition. Due to this feature, the orientation of a possible threat object around the radar line of sight has no influence on the classification result, which in turn increases the robustness of the approach.
As far as monostatic imaging configurations are concerned, the classification already allows to distinguish between dielectric sheets and geometrically structured objects or powders, even under the influence of clothing.
Employing a multistatic array constellation enhances the classification result, due to the stronger weighting of scene areas which contain several elementary scattering processes. It was shown that a determination between objects, which could not be separated with the monostatic approach is possible.
Spending more bandwidth could support the classification approach for both imaging scenarios. Investigations concerning the analysis of further statistical properties like the standard deviation of the H-α characteristics are also promising.
 Julian Adametz received the Dipl.-Ing (M.Sc.) degree in Electrical Engineering from the University of Erlangen-Nuremberg (FAU), Erlangen, Germany, in 2009. He joined the Institute of Microwaves and Photonics (LHFT) at the FAU in the same year and is currently working towards the Ph.D. degree. His research interests are in the fields of millimeter-wave imaging, polarimetric imaging, and non-destructive testing.
Lorenz-Peter Schmidt (M'87-SM'02) received the Diploma and Ph.D. degrees in Electrical Engineering from the Technical University of Aachen, Germany, in 1974 and 1979. In 1979, he became a Postdoc with the University of Texas, Austin. From 1980 to 1998, he was with AEG-Telefunken, Ulm, Germany (now CASSIDIAN), where he became the Head of the Corporate Advanced Millimeter-Wave Department. Since 1998, he has been a Full Professor and the Head of the Institute of Microwaves and Photonics, University of Erlangen-Nuremberg, Germany. His main research interests are in the field of millimeter-wave and terahertz components and antennas as well as active and passive high resolution imaging systems. Dr. Schmidt is a Member of VDE and a member of the German IEEE MTT/AP Chapter Commission. In 2003, he served as the EuMW General Chairman and in 2013 as the EuMC Chairman. In 2013, he received the Microwave Prize of the MTT Society.