1 Introduction
In light of the increased responsibility that workers and retirees face with regard to retirement decisions, financial literacy is becoming a crucial tool to help individuals reach retirement with adequate resources (OECD, 2008). The importance of this special type of education is particularly relevant for economies in which the responsibility for retirement provision relies heavily on defined contribution (DC) arrangements and, therefore, on individual choice.
Chile, was one of the first countries to pioneer pension reform and was the first to implement the World Bank's multi-pillar approach to pension provision. In 1982, Chile completely restructured its public pay-as-you-go (PAYG) pension system and switched to a fully funded, privately managed mandatory DC system.Footnote 1 Currently, our data indicate that 82% of workers are enrolled in the mandatory DC system. This is quite a high figure if we consider that studies report a level of informality of urban workers of around 18% (Perticara and Celhay, Reference Perticara and Celhay2010). Considering the high penetration of DC pensions, it seems imperative to understand and evaluate the levels of financial literacy of its population and the capacity of individuals to effectively plan and manage pension savings.
This paper analyses the link between the level of financial literacy of the Chilean population and Chilean's propensity to plan for retirement. With this analysis we are also contributing to the efforts undertaken as part of the Financial Literacy around the World project (FLat World), published in a special edition of the Journal of Pension Economics and Finance.Footnote 2 That special edition presented key findings on the relationship between financial literacy and retirement planning for eight countries based on comparable measures of key financial literacy concepts, including, understanding of interest rates and compound interest; understanding of inflation; and understanding of risk diversification.Footnote 3 Comparable measures for these financial literacy concepts and indicators of people's propensity to plan for retirement (measured in the same way as in the FLat World project) are also available for Chile through the Social Protection Survey (EPS).Footnote 4 The availability of these data provides us with an excellent opportunity to contribute to this project with further evidence on the relationship between financial literacy and retirement planning while allowing us to benchmark Chile in the international context.
Many studies have looked at levels of financial sophistication and retirement planning as well as at the influence of financial literacy over savings and investment behaviour (see, for example OECD, 2005; Lusardi and Mitchell, Reference Lusardi and Mitchell2011a; Bernheim, Reference Bernheim, Mitchell and Schieber1998; Bayer et al., Reference Bayer, Bernheim and Scholz2009 and Bernheim and Garrett, Reference Bernheim and Garrett2003). In the case of Chile, Hastings and Mitchell (Reference Hastings and Mitchell2011) analysed how financial literacy relates to savings and investment decisions and find that financial literacy is correlated with wealth (including retirement savings). Similarly, Behrman et al. (Reference Behrman, Mitchell, Soo and Bravo2012) find that financial literacy and schooling have a significant effect on wealth accumulation and pension contribution patterns in Chile.
More recently, the FLat World project conducted country-specific studies and showed that the likelihood of planning for retirement is positively linked to the level of financial literacy in the population (Alessie et al., Reference Alessie, Van Rooij and Lusardi2011; Almenberg and Säve-Söderbergh, Reference Almenberg and Säve-Söderbergh2011; Bucher-Koenen and Lusardi, Reference Bucher-Koenen and Lusardi2011; Crossan et al., Reference Crossan, Feslier and Hurnard2011; Fornero and Monticone, Reference Fornero and Monticone2011; Klapper and Panos, Reference Klapper and Panos2011; Lusardi and Mitchell, Reference Lusardi and Mitchell2011b; Sekita, Reference Sekita2011). One of the aims of that project is to present a common measure of financial literacy across key economies and analyse its relationship to retirement planning.
This paper contributes to this growing literature. Our findings show that levels of financial literacy and planning in Chile are quite low compared with international evidence. In spite of this, and in line with the prevailing literature, we find a positive association between financial literacy and retirement planning. Exploiting the panel nature of our data, we find that our results still hold when we control for individual unobserved heterogeneity. Though the focus of this paper remains on Chile, we believe that the substantive findings of this study are quite relevant for other countries that also have mandatory DC pensions and in which individual choice remains a key feature of retirement arrangements.
The paper is organized as follows: Section 2 presents a brief overview of the Chilean retirement system. Section 3 introduces the dataset and key summary statistics. Section 4 describes the measurement of financial literacy and retirement planning and presents the distribution of financial literacy and planning across demographics. Section 5 studies the relationship between financial literacy and retirement planning. Section 6 presents our panel estimation results and Section 7 concludes and discusses policy implications.
2 The Chilean retirement system
Starting in 1982, Chile completely revamped the way in which its retirement provision was financed by introducing a mandatory system of privately-manage individual retirement accounts to replace the government-administrated PAYG system. Existing workers were allowed to choose between two retirement optionsFootnote 5 (with the exception of those with 5 years or less to retirement), but new labour force joiners were automatically enrolled in the new system. According to Kritzer (Reference Kritzer2008), the old system is expected to close by 2050. In 2008, a new series of reforms was introduced to the private system with the aim of increasing coverage, promoting competition, enhancing risk management among pension fund administrators (PFA), promoting voluntary savings, and improving financial literacy of contributors and retirees.Footnote 6
The current retirement system is organized in three pillars. The first pillar has a poverty alleviation objective and offers non-contributory pensions to citizens having low or no income in retirement. These ‘solidarity’ pensions are financed from general revenue. The 2008 reform introduced key changes to this pillar that increased coverage and incorporated groups of people who were previously uncovered.
The second pillar, or contributory pillar, is of a DC nature and workers are mandated to contribute a minimum of 10% of their taxable income (with a cap of 60 unidades de fomento) to individual retirement accounts. On top of this 10%, additional contributions (ranging from 2% to 3% of taxable income) are also deducted from taxable income to cover management fees, disability, and survivor insurance. Participation for self-employed workers used to be voluntary, but from 2012 self-employed started contributing to the DC system.Footnote 7 With respect to pension payments, future distributions are no longer defined as a percentage of salary and years of services, but instead, they are now determined by employees’ contributions and asset returns earned in their individual accounts throughout their working lives.
Private pensions are administered by private PFA and workers are allowed to choose among six providers.Footnote 8 With respect to investment options, pension funds administrators are mandated to offer a choice of five investment funds. These funds vary in the degree of exposure to risky assets, ranging from a maximum of 80% in variable income securities (Fund A), to no exposure to these types of securities (Fund E).Footnote 9 The default investment strategy follows a life-cycle path as assets are gradually shifted towards less risky holdings as workers approach the normal retirement age (65 for men and 60 for women).Footnote 10
When a worker reaches normal retirement age, he is required to either take programmed withdrawals (PW) for a period equal to his expected lifespan, or purchase a life annuity contract. Combinations of these two options are also allowed, for example, setting up PW up to a certain age and purchasing a deferred life annuity. Lump-sum withdrawals are allowed as long as the annuitized income is enough to cover at least 1.5 times the minimum pension or 70% of pre-retirement income (whichever is higher).Footnote 11 Early retirement is also permitted as long as the retiree has sufficient funds to purchase an annuity or PW of 1.5 times the minimum pension or 70% of pre-retirement income (whichever is higher).
As a way to increase competition and lower premiums the government implemented an electronic bidding systemFootnote 12 to trade annuities in which insurance companies quote annuities rates upon workers’ request. This facilitates price comparison, gives transparency to the system, and encourages competition.
There are also certain government guarantees in place to mitigate members’ risk exposure. In the accumulation stage, legislation mandates PFAs to offer a minimum return to members set as the 3-year-average return exhibit by all PFAs. To cover up potential losses, each PFA is required to keep a reserve fund equal to 1% of the funds under management. Should this fund not be enough to make up for losses, the government contributes the difference and winds up the administrator. In the de-cumulation stage, the government guarantees a monthly pension of up to 45 Unidades de FomentoFootnote 13 in case of failure of the pension provider.
The third pillar includes voluntary contributions made either by employers or employees (or both) to supplemental retirement accounts. However, the takeup rate of this pillar is not very high. According to our calculations based on data from the 2009 EPS, less than half of the interviewed population knows about the possibility of making voluntary contributions to the retirement fund. Moreover, only 13% of those who know about this voluntary pillar were actually making supplemental contributions on top of the legal minimum. In order to make voluntary savings more appealing, the 2008 reform introduced a legal framework for employer-provided retirement plans (the Ahorro Previsional Voluntario Colectivo). According to this new legislationFootnote 14, employers can now offer one or more voluntary retirement plans to their employees. They have to be offered on a non-discriminatory basis, though the establishment of minimum vesting periods is allowed. Employer contributions are tax deductible.
Overall, the Chilean retirement system has gone through a great deal of change over the past 30 years and continues to evolve granting a growing number of members increased choice in relation to their risk exposure, voluntary savings, and de-cumulation strategies. This increased level of choice also demands a greater understanding by participants of how the system works and the options available to them. This, in turn, requires higher levels of financial sophistication as well as a greater responsibility and commitment of savers with respect to retirement planning. The relevance of informed decision making throughout the life-cycle is probably greater in Chile than in other economies. Therefore, it is important to carefully analyse the level of financial literacy and retirement planning of its population.
3 The dataset
Our study uses the second wave of a module on financial literacy included in the 2009 EPS. The EPS is a panel study run by the Micro Data department of the Universidad de Chile in cooperation with the University of Pennsylvania. The survey is done in person through an interviewer. The first wave of the study was released in 2002 and the latest in 2009. The sample includes around 14,500 individuals older than 18 years of age and representative of the Chilean population. The survey contains information on labour history and retirement, education, health status, income and assets, family history, and background, as well as other demographics, and household information. Most importantly, the survey contains a module of financial literacy that includes comparable questions to those of the FLat World project. These questions were introduced in the 2006 wave, so most respondents have been asked the financial literacy module twice. Still, if we compare raw responses between the two surveys a learning process cannot be detected.Footnote 15
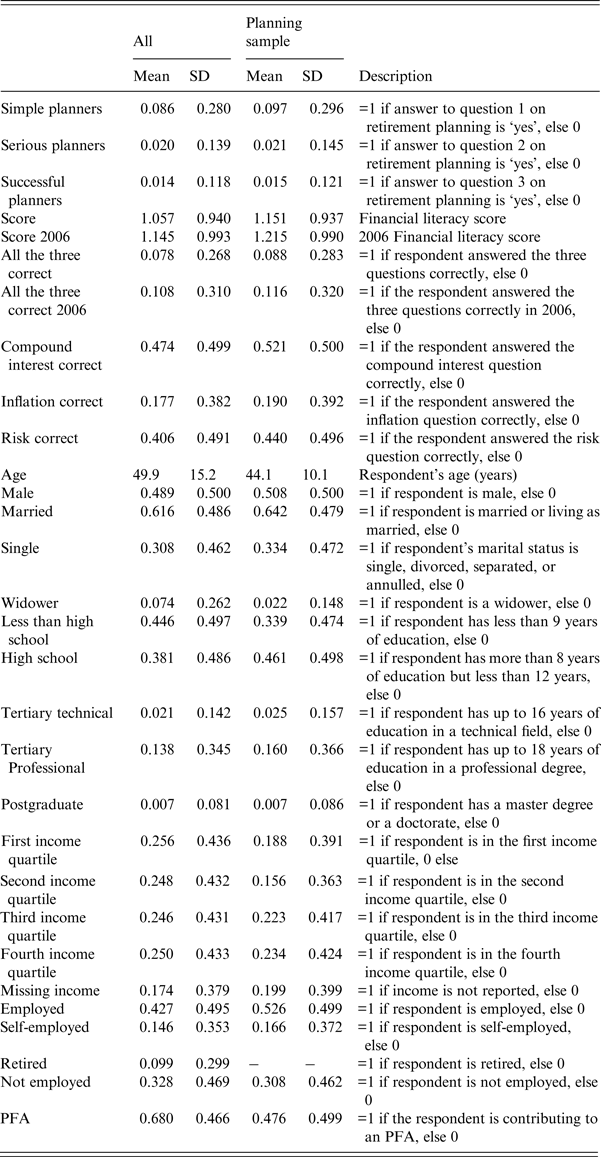
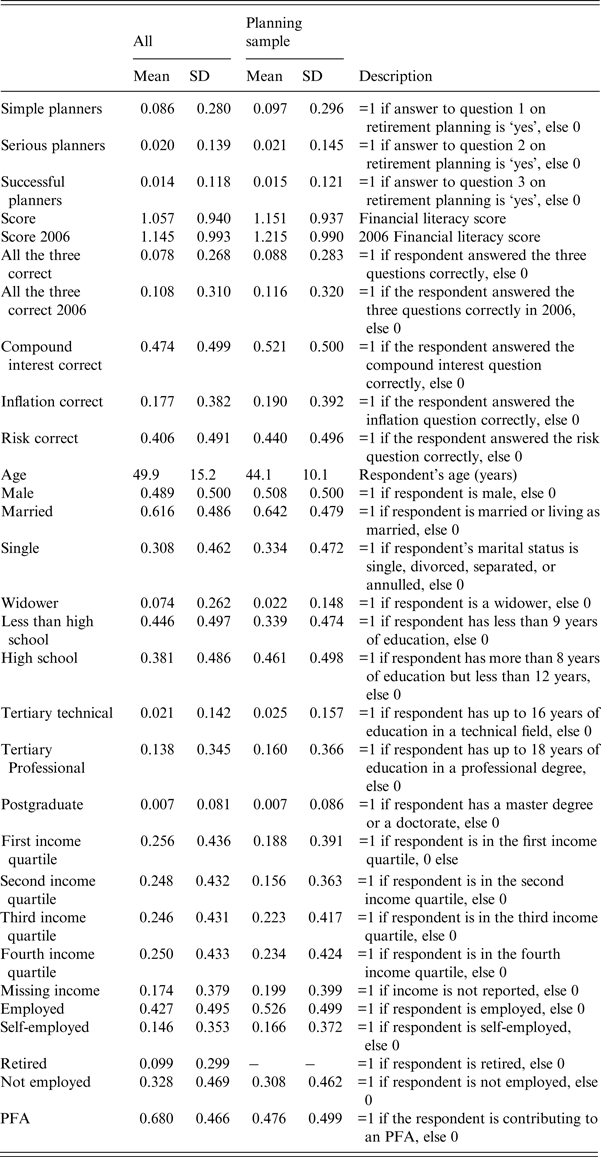
The Appendix presents a brief description of our main variables and key summary statistics. Around half of the sample is composed of male respondents and the average age is 49 years. Around 60% of respondents are employed or self-employed, and 10% are already retired. With respect to education, we classified respondents in five categories following Chile's mapping of the International Standard Classification of Education (ISCED) 1997 reported by UNESCO (2013). These categories include: ‘less than high-school’ (those with <9 years of formal education), ‘high-school’ (those with >8 years of education and up to 12), ‘tertiary technical’ (those with up to 16 years of education in a technical diploma with specific specialisation), ‘tertiary professional’ (those with up to 18 years of education in a bachelor's degree or other professional qualification), and ‘postgraduate’ (those with a master or a doctorate degree). In our sample, almost 45% report having less than a high school diploma and only about 15% having a tertiary (technical or university) degree.
Income is defined as the total after-tax monthly income in Chilean pesos (CLP) and includes all relevant sources of income, including employment, pensions, rents, interest, and dividends as well as other income sources such as government aid programmes and subsidies. Average per capita monthly income in 2009 amounts to around CLP 290,000.Footnote 16
4 Empirical evidence
4.1 Demographics of financial literacy in Chile
We measure financial literacy using three questions included in the EPS survey (English translation below). Similar questions were first analysed by Lusardi and Mitchell (Reference Lusardi and Mitchell2011a) for the USA using data from the Health and Retirement Study (HRS) and are in line with those used in the studies undertaken as part of the FLat World project. Notions of compound interest, inflation, and risk are the three main skills measured through these questions.
1. Suppose you had $100 in a savings account and the interest rate was 2% per year. After 5 years, how much do you think you would have in the account if you left the money to grow: (i) more than $102; (ii) less than $102; (iii) exactly $102; (iv) do not know; (v) refuse to answer?
2. Imagine that the interest rate on your savings account was 1% per year and the inflation was 2% per year. After 1 year, would you be able to buy: (i) more than; (ii) exactly the same; (iii) or less than today with the money in this account; (iv) do not know; (v) refuse to answer?
3. Do you think that the following statement is true or false? ‘Buying a single company stock usually provides a safer return than a stock mutual fund’. (i) True; (ii) false; (iii) refuse to answer.
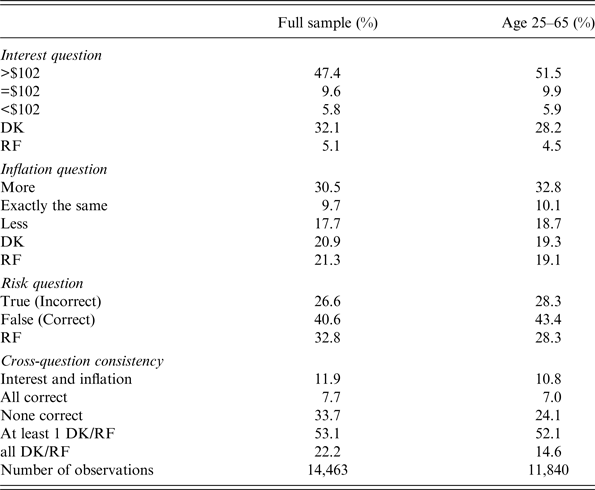
Summary statistics for the three financial literacy questions in our full sample and for those aged 25–65 are presented in Table 1. Only 47% of Chileans can give a correct answer to the compound interest question and 40 to the risk question.Footnote 17 If we consider the sample of those between 25 and 65, they do slightly better than the average Chilean on the financial literacy questions, except for the inflation one. In the case of inflation, we find that only 18% of the population can answer the question correctly, which is quite surprising considering the history of inflation of the country. This is showing that the Chilean population find it hard to understand the impact of inflation on purchasing power. Given the low percentage of correct answers to the inflation question, it is not surprising to find that <8% of respondents answer all questions correctly (see Table 1).
Summary statistics on three financial literacy questions in the Social Protection Survey

Note: Distribution of responses to financial literacy questions in full sample and for those individuals aged 25–65. DK indicates respondent does not know the answer. RF indicates respondent refused to answer.
Interestingly, a sizeable proportion of the population refuses to or is not able to answer the questions. We find that more than half of the population selects either the ‘do not know’ or ‘refuse’ option in at least one of the questions and that 22% chooses one of these two options in all the questions. In the case of the interest question, around 37% of respondents select the ‘refuse to answer’ or ‘do not know’ options. This percentage is higher for the inflation questions (40%) and drops slightly for the risk diversification question (33%).
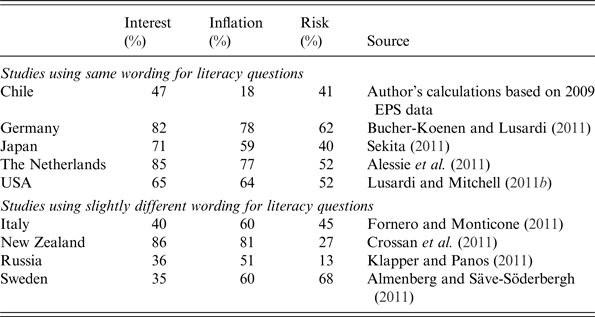
Table 2 summarizes correct response rates for these questions for the countries considered in the FLat World project. On an international comparison, and considering countries with comparable questions to the ones in the EPS (upper panel of Table 2), Chileans lag behind the USA, Germany, the Netherlands, and Japan. Surprising is the low percentage of people who can give a correct answer to the inflation question (only around 20% of Chilean respondents answered this question correctly) considering a long history of inflation in the Chilean economy. Chile presents by far the lowest correct response rate in this category.
Correct response rates for financial literacy questions
Note: Table shows the percentage of people giving a correct answer in financial literacy questions. Cross-country differences are confounded with survey design differences as surveys were not harmonized ex-ante. The upper panel shows figures for countries that share the same wording on financial literacy questions. The lower panel summarizes responses for countries where wording was somewhat different, namely: Italy – risk question: imagine you have only equity funds and stock market prices fall. Are you…? better off/worse off/as well off as before/do not know; Sweden – interest question: Suppose you have 200 SEK in a savings account. The interest is 10% per year and is paid into the same account. How much will you have in the account after 2 years? open ended; New Zealand – compound interest: If Nicky had 100 NZD in a savings account and the interest rate was 2% per year, after 5 years how much would Nicky have in her account if she left the money to grow? Would it be more than NZD 102, exactly NZD 102 or less than NZD 102?. Inflation: if the interest rate on Anne's savings account was 1% per year and inflation was 2% per year, after 1 year, with the money in this account, would she be able to buy more than today, exactly the same as today, or less than today. Risk: which one of the following is generally considered to make you the most money over the next 15–20 years? (a) a savings account, (b) a range of shares, (c) a range of fixed interest investments, (d) a cheque account; Russia – compound interest: let us assume you deposited 100,000 rubles in a bank account for 5 years at 10% interest rate. The interest will be earned at the end of each year and will be added to the principal. How much money will you have in your account in 5 years if you do not withdraw either the principal or the interest? More than 105 K rubles, Exactly 105 K rubles, less than 105 K rubles, do not know. Inflation: let us assume that in 2010 your income is twice what it is now, and that consumer prices also grow twofold. do you think that in 2010 you will be able to but more, less, or the same amount of goods and services as today? Risk: which is the riskiest asset to invest in? Shares in a single company stock, shares in a unit fund, risk are identical in both cases, do not know; Chile – The question on risk diversification has a slightly different set of answers to that of other countries as ‘do not know’ is not listed among the response options.
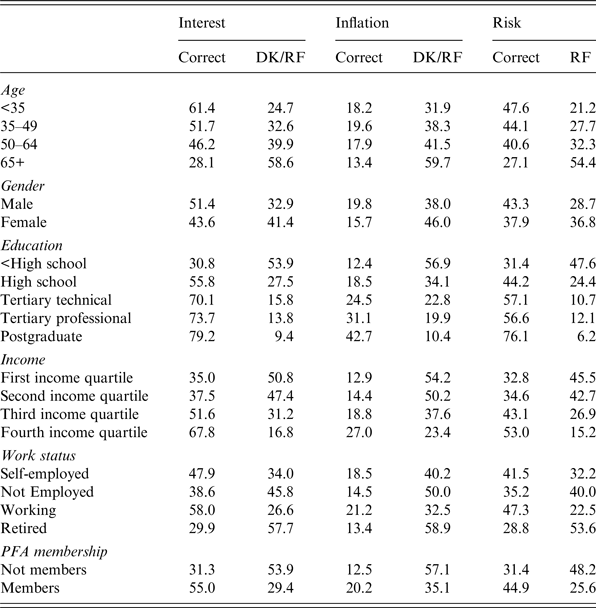
The relationship between socio-demographic variables and financial literacy is presented in Table 3. Unlike other studies that find a hump-shaped age profile for financial literacy (Bucher-Koenen and Lusardi, Reference Bucher-Koenen and Lusardi2011), our results show that levels of financial literacy deteriorate with age. In fact, the percentage of correct responses of those in the 65 plus age cohort is lower than that of the other three age groups and these differences are statistically significant at the 1% level.
Distribution of financial literacy across demographic attributes in the EPS survey (%)
Note: Figures are presented in percentages. DK indicates respondent does not know. RF indicates respondent refuses to answer the question.
In line with the results of other studies, we find that women are significantly less likely to give correct answers than men. Also, as expected, financial literacy improves with the level of education (comparing across ISCED levels) and income. While under one-third of those with less than high school answer the compound interest question correctly, more than 70% of those with a tertiary degree do. In the case of income, those in the highest income quartile are more than twice as likely to answer correctly the compound interest and inflation questions, than those in the lowest quartile.
Financial literacy is significantly correlated with work status. Those who are working have higher literacy scores and are significantly less likely to report they do not know the answer to a question. Unlike other studies (Alessie et al., Reference Alessie, Van Rooij and Lusardi2011), we do not find that the self-employed are financially more educated than employees, in fact, they are significantly less likely to provide a correct answer to the interest and risk questions than employees (differences for the inflation question are not statistically significant between self-employed and employees). Employees are also more financially literate than retirees and than those who are not employed.
Those enrolled in the private DC system (PFA members) do better at answering financial literacy questions.Footnote 18 The age effect might be influencing this finding as younger generations are much more likely to belong to this new systemFootnote 19 and, seen, they are more financially educated. Still, we can also argue that the compulsory enrolment in a choice-based DC system might drive contributors to become more financially literate. Under this new system, contributors are compelled to make decisions regarding retirement savings that were not required under the former PAYG system.
4.2 Demographics of retirement planning in Chile
The EPS survey includes three questions in the area of retirement planning that mimic those included in the HRS for the USA and in other studies of the FLat World project, namely:
1. Have you ever tried to figure out how much your household would need to save for retirement?
2. Did you develop a plan for retirement saving?
3. How often were you able to stick to this plan: would you say always, mostly, rarely, or never?
Questions were asked in a sequential manner, so question 2 is only asked to those who answered ‘yes’ to question 1, and question 3 is only asked to those who responded ‘yes’ to question 3. Following Lusardi and Mitchell (Reference Lusardi and Mitchell2011a), I use the term simple planners for those people who responded ‘yes’ to the first question, serious planners to those who responded ‘yes’ to the second question, and successful planners to those who said ‘always’ or ‘mostly’ to the third question. Also, and in line with the prevailing literature, we classify as planners to those who answered ‘yes’ to the first question.
Considering that the retirement decision might be endogenous to planning behaviour, the analysis in this section is restricted to a sample of individuals who are non-retired, older than 25 years old, and below the legal retirement age which is 60 years for women and 65 for men. This yields a sample of 11,141 respondents.
Planning prevalence is extremely low in Chile, as only around 9% of the overall sample states taking some action regarding retirement planning (i.e., are simple, serious, or successful planners). undertaking in an international comparison, planning prevalence in Chile looks extremely low, which is worrying considering the high reliance on DC arrangements. Data for the USA show that 43% (Lusardi and Mitchell, Reference Lusardi and Mitchell2011b) of respondents say they ever tried to figure out how much they needed in retirement (simple planners). In the case of Germany, this figure drops to 25.3% (Bucher-Koenen and Lusardi, Reference Bucher-Koenen and Lusardi2011), which is lower than in the USA but it is still much higher than in Chile. For Sweden and the Netherlands, questions are formulated a bit differently but, nonetheless, planning prevalence is much higher than in Chile.Footnote 20 In the Netherlands, Alessie et al. (Reference Alessie, Van Rooij and Lusardi2011) find that around 70% of Dutch respondents report having thought ‘a lot’ or ‘some’ about retirement and Almenberg and Säve-Söderbergh (Reference Almenberg and Säve-Söderbergh2011) show that around 30% of Swedish respondents can be considered planners. Finally, in the case of Japan, Sekita (Reference Sekita2011) finds that around half of the sample has no plan for retirement.
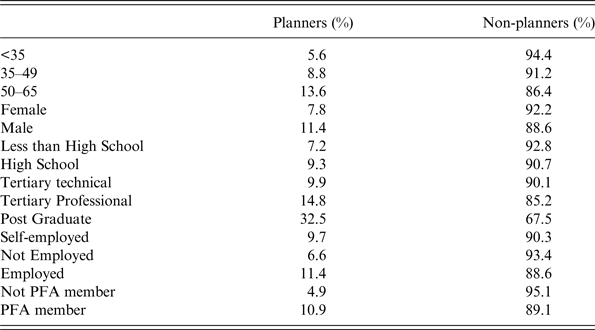
Table 4 presents summary statistics on planning activities by different demographic characteristics. As expected, we find that prevalence rates on planning activities rise as Chileans approach retirement. Still, around 86% of those nearing retirement age (50–65 age cohort) do not plan for retirement and only 9% of those in their late thirties and forties declare undertaking some kind of planning behaviour. Also, in line with other studies, men are more likely to report planning activities than women (see Table 4): 11.4% of males report planning activities, while only 7.8% of women do.
Distribution of responses to planning questions by key demographic attributes in the EPS survey (%)
Note: Table presents the proportion of respondent's answering ‘yes’ to planning question ‘Have you ever tried to figure out how much your household would need to save for retirement?. Sample includes individuals who are non-retired, older than 25 years old and below the legal retirement (60 years for women and 65 for men). This yields a sample of 11,141 respondents.
We find a positive association between education and planning, and the differences among the groups are quite significant. As Table 4 shows, 93% of those with less than high school education reported no planning activities, while this figure drops to 85% for those with a tertiary professional degree. Low planning activities are also registered across the work status spectrum, with those in employment slightly more likely to plan than the rest. Members of a pension plan exhibit higher planning rates than those who remain outside the mandatory DC system.
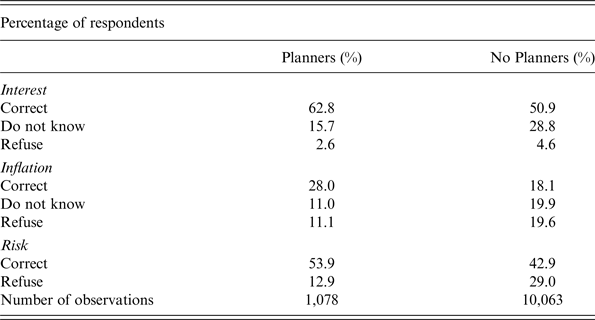
When we look at the association between planning and literacy (Table 5), we find that those engaged in planning activities have higher scores on the literacy questions. We tested significance in mean differences of ‘correct’ and ‘do not know’ or ‘refuse to answer’, and we find that planners are significantly more likely to answer questions correctly and also less likely to refuse to answer or state they do not know the answer. This points towards a strong positive correlation between financial literacy and retirement planning. Based on these findings, the next section presents a multivariate analysis of this relationship.
Financial literacy and Retirement Planning (%)
Note: Table presents relative frequency of responses to the three financial literacy question by whether respondent is a planner or not. Sample includes individuals who are non-retired, older than 25 years old and below the legal retirement (60 years for women and 65 for men). This yields a sample of 11,141 respondents.
5 Retirement planning and financial literacy: is there a relationship?
A preliminary data inspection (see Table 5) suggests a positive correlation between financial literacy and retirement planning, in this section, we look at whether this relationship still holds in a multivariate setting.
For modelling purposes and to allow comparability with the prevailing literature, we pool all planners into one single category and define a dummy variable that takes the value of one if the respondent is a simple, serious, or successful planner. We then use this as the dependent variable in a probit model.
Considering the comparability with the FLat World Project, we use three measures for financial literacy. The first is a dummy variable equal to one if the respondent gives a correct answer to the three financial literacy questions. The second adds up the number of correct responses, and the third includes dummy variables indicating correct responses for each financial literacy question and allows us to examine which concept is more important in explaining retirement planning. We also include controls for age, education, gender, marital status, income, and main activity.
As in the previous section, we restrict the sample to respondents below the legal retirement age in the 2009 EPS (60 for women and 65 for men) and non-retired (because interpreting answers to planning is unclear for retired individuals). This yields a total number of responses of 11,141.
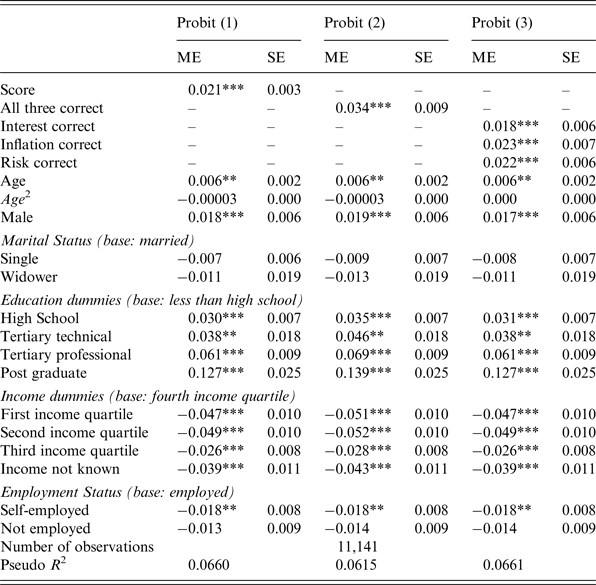
Results from a probit specification of retirement planning on socioeconomic controls and financial literacy for this subsample can be found in Table 6. These results confirm the expected positive relationship between financial literacy and retirement planning. The estimated coefficient suggests that one extra correct answer can increase the probability of planning for retirement by around two percentage points (see column 1 in Table 6). Answering all the questions correctly has a slightly stronger influence over the probability of planning (marginal effect of around three percentage points – see column 3 in Table 6). Though these figures seem small, we must consider that the average predicted probability of being a planner in our sample is around 10%. Therefore, an increment of two percentage points implies an increase of around 20% in the probability of being a planner. This is in line with those of Bucher-Koenen and Lusardi (Reference Bucher-Koenen and Lusardi2011) who find that, in an Ordinary least squares (OLS) setting, answering one additional question correctly can increase the probability of planning by four percentage points. Alessie et al. (Reference Alessie, Van Rooij and Lusardi2011) find a stronger influence as they report that one additional correct response can increase the probability of planning by 10 percentage points. The fifth column of Table 6 shows that knowing about inflation and risk has a slightly stronger influence on the probability of being a planner than understanding of compound interest.
Retirement planning and financial literacy: marginal effects after Probit
ME, marginal effects; SE, standard errors.
Legend: *p < 0.1; **p < 0.05; ***p < 0.01.
Note: Sample consists of 11,141 respondents under the legal retirement age (65 for men and 60 for women). Married category includes those married and living as married.
We also show that as people become older, they are more likely to plan for retirement. Men, couples, and the better-educated are also more prone to think about retirement and to make plans. As expected, those in higher income quartiles also show a higher planning propensity. With regard to employment status, the self-employed are less likely to plan for retirement than employees.
One potential concern with the specification of this binary model is that it assumes that simple, serious, and successful planners are a homogeneous group and can be pooled together into one single category. To test the sensitivity of results to this assumption, we fit multinomial logit models using as the dependent variable a categorical variable that can take on four different values (one for each category of planners). The results for our variables of interest do not differ significantly from that of the probit model.Footnote 21
Nevertheless, we cannot yet interpret this relationship as causal. As noted by Alessie et al. (Reference Alessie, Van Rooij and Lusardi2011) and Lusardi and Mitchell (Reference Lusardi and Mitchell2011b), the literacy variable may be endogenous (financial literacy levels may increase as people engage in planning activities), and/or could proxy unobservables such as interest or ability biasing our results. The next section addresses these issues by exploiting the longitudinal nature of the data.
6 Panel estimation results
In an effort to address the endogeneity problem mentioned previously, and to control for unobservables that could be biasing our results, this section exploits the panel nature of our dataset by merging the 2006 and 2009 waves of the EPS.
With regard to the reverse causality problem, Alessie et al. (Reference Alessie, Van Rooij and Lusardi2011) suggest that the amount of time and effort respondents are currently devoting to retirement planning should not affect financial literacy scores obtained years before; therefore, in the presence of longitudinal data, relating past levels of financial literacy to current levels of retirement planning emerges as a plausible way to address the endogeneity issue. By combining the 2006 and 2008 waves, we can also control for individual fixed effects and tackle the problem of omitted variables.
Both waves of the survey include the same set of questions on financial literacy and retirement planning. The attrition rate over this period is of around 13% of the sample and a χ 2 test indicates that we cannot reject the hypothesis that attrition is random as there are no significant differences in retirement planning between those who participated in both waves of the survey and those who only took part in the 2006 one. When we restrict the sample to include only those non-retired, over 25 years of age, and below the legal retirement age (60 for women and 65 for men), we end up with a sample of 13,869 unique respondents who participated in the 2006, 2009 or in both waves.Footnote 22
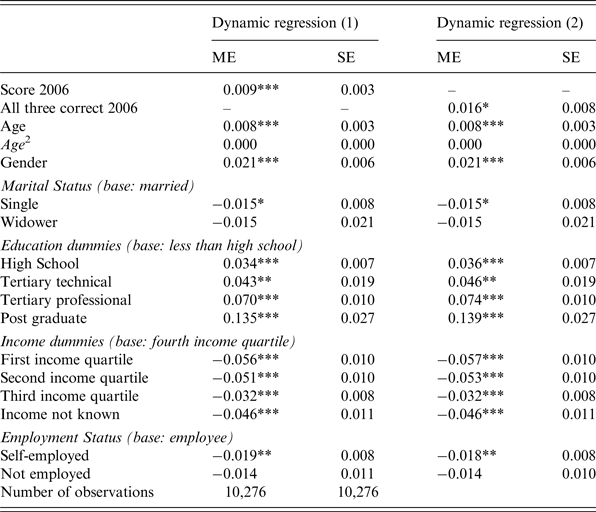
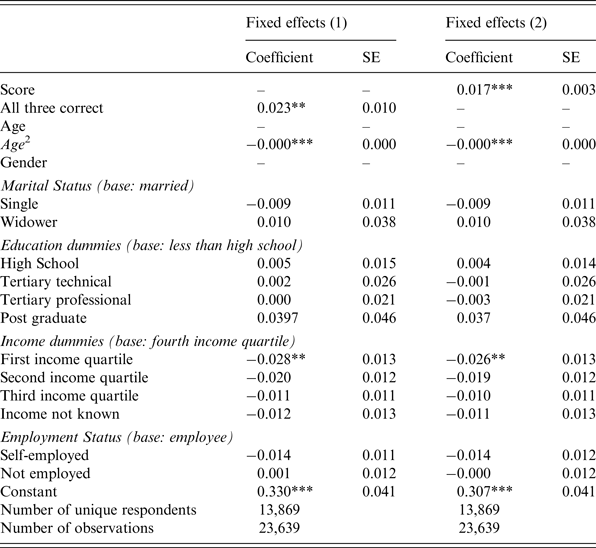
Tables 7 and 8 presents the results for a dynamic regression (that uses individual financial literacy scores obtained in the 2006 wave of the survey) and fixed effects model, respectively. In both models, we control for a sizeable number of background characteristics as we did in Section 5.
Dynamic regression: marginal effects after probit with 2006 literacy scores
ME, Marginal effects; SE, standard errors.
Legend: *p < 0.1; **p < 0.05; ***p < 0.01.
Note: Married category includes those married and living as married.
Retirement planning and financial literacy: fixed-effects regression
SE, Standard Errors.
Legend: *p < 0.1; **p < 0.05; ***p < 0.01.
Note: Married category includes those married and living as married.
The dynamic regressions confirm the positive relationship between financial literacy and planning and now allow us to suggest a causal relationship that goes from literacy to planning. With respect to the magnitudes of the effect, the estimated coefficients are smaller than in our previous models, but they are still highly significant. Estimated marginal effects for the score variable is 0.009 and for the dummy variable of all correct responses is 0.016 (see Table 7). These coefficients are around half of those found with 2009 literacy scores. With respect to the influence of the rest of the demographic and income variables on retirement planning, results are quite similar to those described for the model with 2009 literacy variables in both specifications.
In the fixed effect model (see Table 8), we find that for both measures of financial literacy, the ‘within estimate’ is positive and statistically significant, showing that even after controlling for individual unobserved heterogeneity financial literacy still has an impact on retirement planning. With respect to the magnitude of the estimated coefficients, they are slightly lower than those found in the pooled probit model.
Finally, one limitation of our study relies on the inability to address potential measurement error issues in our financial literacy variable. As pointed out by Alessie et al. (Reference Alessie, Van Rooij and Lusardi2011), financial literacy is difficult to measure and categorical financial literacy variables are likely to include classification errors. Measurement errors could introduce a downward bias in the estimated financial literacy coefficients. This downwards bias is normally exacerbated in fixed-effect regressions and can be explaining the differences in magnitudes of the estimates coefficients on the probit and fixed effects models. The literature has dealt with this issue by instrumenting financial literacy but, unfortunately, we were not able to find suitable instruments to implement this approach in Chile.Footnote 23
7 Conclusion and policy implications
Policymakers around the world are becoming more aware of the importance of financial literacy for enhancing savings and retirement preparedness. G20 leaders have recently endorsed the OECD/International Network of Financial Education High-level Principles on National Strategies for Financial Education. Chile in 2008 setup a special fund, called the Pension Education Fund, intended to finance programmes and activities enhancing pension and financial education across the population. The FLat world project collected research in eight countries to measure and report the levels of financial literacy and its relationship with retirement planning. All of these efforts highlight the increasing concern over the development of national strategies for financial and pension literacy.
This study contributes to this growing literature by analysing the relationship between higher levels of financial literacy and retirement planning and preparedness, using data for Chile. The relevance of retirement planning and financial literacy in Chile is possibly greater than in other economies, considering its rapidly ageing population and reliance on a mature DC pension system whose outcomes rest heavily on individual choices. As this system continues to expand and mature, the need for individuals to prepare for retirement is also likely to grow.
Using data from the latest wave of the EPS survey, we show that financial literacy and retirement planning are extremely low in Chile. Still, we estimate a positive and significant relationship between financial literacy and self-reported measures of retirement planning. In addition, exploiting the panel component of the survey, we show with some confidence that financial literacy has a positive impact over retirement planning. Efforts to enhance retirement planning in the Chilean population should consider programmes to enhance financial literacy levels of the population.
Appendix
Summary statistics