I. INTRODUCTION
Manganese additions can increase the strength of unalloyed aluminum without impairing its chemical resistance.Reference Martienssen and Warlimont1 They can also be used as a corrector for iron in Al–Cu, Al–Mg, Al–Mg–Si, and Al–Zn–Mg alloys.Reference Mondolfo2 When the Mn content is below its maximum solubility in the Al-rich phase, Al–Mn alloys possess good mechanical and forming properties and corrosion resistance, which allow them in a wide variety of applications in engineering, transportation, chemical, building, food handling, etc.Reference Bahadur3 However, with a higher Mn content, brittle Al6Mn intermetallic compound is usually formed and impairs the workability of the alloys. This damage effect should be closely related to its distribution, shape, and crystallographic features. Therefore, it is of interest and significance to study these microstructural aspects. To obtain the Al6Mn compound, one of the ways is solidifying hypereutectic Al–Mn alloy.
Recently, electromagnetic fields have been widely used in the materials processing as they can induce some quite interesting phenomena and affect the materials properties.Reference Masahashi, Matsuo and Watanabe4–Reference Cheng, Zhao and Xu7 Indubitably, they are also involved in the solidification process of metallic alloys and have exhibited large influences on the crystallization behaviors of crystals. When the applied magnetic field is relatively low (e.g., <1 T), its effect is mainly correlated with the induced Lorentz force in the melt. With this force, the melt is stirred or suppressed so that the heat and mass transfer and thus the final macro- and microstructures can be changed.Reference Vives8,Reference Vives9 However, when the magnetic field is strengthened, other than the Lorentz force, nonignorable magnetization force and even thermoelectric magnetic force acting on the nonmagnetic crystals can be induced. With these forces, the distribution, shape, alignment, orientation, interface stability, etc. of the crystals can be remarkably modified.Reference Liu, Wang, Zhang, Gao, Li and He10–Reference Wang, Wang, Wang, Li, Nakajima and He18 Considering these abundant modification effects, the application of a high magnetic field during the solidification of hypereutectic Al–Mn alloy is of potential interest. Kang et al.Reference Kang, Li, Su, Liu, Guo and Fu19 studied the three-dimensional morphology of primary Al6Mn intermetallic compound in directionally solidified Al–3at.%Mn alloy and found that it tends to form octahedron bounded by eight {011} and {101} planes, which are determined based on the analysis of the crystal structure. Luo et al.Reference Luo, Guo, Yan and Li20 investigated the effect of high magnetic field on the morphology of the primary Al6Mn crystals and found that the field can induce regular alignment and aggregation of these crystals. With an x-ray diffraction examination, they also concluded that c-axis (i.e., <001>) tends to orient parallel to the magnetic field. Despite their excellent work, some more information regarding the Al6Mn compound may still remain to be further discovered by advanced characterization techniques.
In such context, hypereutectic Al–Mn alloy was prepared and solidified to form Al6Mn phase without and with a high magnetic field in the present work. The effects of high magnetic field on the distribution, shape, and crystallographic features of the primary Al6Mn phase were carefully studied. To more precisely characterize the crystallographic features, electron backscattered diffraction (EBSD) technique was used to obtain the orientation data of the primary Al6Mn crystals. On the basis of the measured data, the surfaces binding the crystals were analyzed. As a consequence, different from the above-mentioned findings, {110} planes and <100> direction are determined as the side surfaces and the field-preferred direction, respectively. In addition, for the field-induced agglomerate-like Al6Mn crystals, it is clearly clarified that they result from a bifurcation effect rather than the interactivity among the magnetized crystals proposed by Luo et al.Reference Luo, Guo, Yan and Li20
II. EXPERIMENTAL
The Al–3.25wt%Mn alloy used in this study was prepared by melting high-purity aluminum (99.95 wt%) and manganese (99.98 wt%) in an induction furnace. After magnetic stirring and holding at 800 °C for 30 min, a further mechanical stirring is applied to homogenize the composition of the alloy in the whole melt and then the melt was poured into a high-purity water-cooled copper crucible to solidify quickly. The as-cast billet was machined into several small rods (9 mm in diameter and 30 mm in length). Each rod was then put into a high-purity cylindrical corundum crucible (10 mm in inner diameter and 60 mm in height) for subsequent solidification experiment. The experimental setup has been introduced elsewhere.Reference Li, Zhang, Esling, Jiang, Zhao, Zuo and Cui13 In the present work, the rods were placed in center of the furnace where a maximum axial magnetic flux density of 12 T could be produced. After the magnetic flux density reached the set value (0, 7, or 12 T) and the pressure in the furnace 5 × 10⁻³ Pa, the rod was heated up to 800 °C by an electric heater at a rate of 5 °C/min and held at this temperature for 40 min to make them completely melted and then cooled to room temperature at a rate of 10 °C/min. Finally, a solidified ingot (about 10 mm in diameter and 24 mm in length) was obtained.
Specimens were cut longitudinally [parallel to the FD (field direction)] or transversely (perpendicular to the FD) from the ingots for further examination. The macro- and microstructures of the specimens were observed with a Leica DMR optical microscope. Individual orientation measurements of the primary Al6Mn phase were performed at manually chosen points through acquiring and indexing the EBSD Kikuchi patterns with a JOEL JSM 6500 FE-SEM (field-emission scanning electron microscopy), equipped with HKL CHANNEL 5 software (Oxford Instruments, Abingdon, Oxfordshire, UK) after an electrolytic polishing [700 mL ethanol, 120 mL distilled water, 100 mL 2-butoxyethanol, and 80 mL perchloric acid (68%); 40 V; 5 s]. To obtain statistical crystallographic orientation data, the specimens are polished for four times. Each time corresponds to an EBSD measurement on different primary Al6Mn crystals. At least 250 Al6Mn crystals are measured on each of the specimens.
The magnetic field preferred direction of the primary Al6Mn phase is determined first by transforming the FD vector in the sample coordinate system to its equivalent vector in the crystal coordinate system with the measured orientation of the crystals and then the statistically representative crystalline direction close to the transformed FD vector is determined as the field preferred direction. The faceted Al6Mn-matrix interfaces are identified by trace analysis and calculated with the indirect two-trace method.Reference Zhang, Esling, Zhao and Zuo21
III. RESULTS
A. Morphology
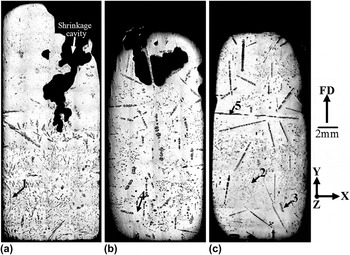
Figure 1 shows the macrostructures in the longitudinal sections of the specimens with different magnetic flux densities [the black pores in the upper sides of (a) and (b) are shrinkage cavities]. It can be observed that without the field, the primary Al6Mn crystals (gray) mainly reveal two sorts of forms—dispersed long bars and dots (further microstructural investigation indicates that they both are needle-like in three dimension) [Fig. 1(a)]. When the field is applied, additional agglomerate-like crystals appear [Figs. 1(b) and 1(c)]. Among these “agglomerates,” quite some of those in the central regions of the specimens tend to preferentially extend in the FD, whereas others with one of their ends close to the peripheral parts (including both the lateral sides and bottoms) show some obvious deviations [here it should be specially mentioned that the crystal arrowed by No. 5 in Fig. 1(c) is a single needle rather than an agglomerate]. Moreover, the distribution of the primary crystals is also affected by the field. They are mainly concentrated in the lower part of the specimen without the field but distributed homogeneously through the specimens with the field.
Macrostructures in the longitudinal sections of the specimens with magnetic flux densities of (a) 0, (b) 7, and (c) 12 T, respectively. FD denotes the magnetic field direction. Axes X, Y, and Z are the defined three-dimensional coordinate system (Y is parallel to FD). The black pores in the upper sides of (a) and (b) are shrinkage cavities.

To clearly reveal the morphologies of the primary Al6Mn crystals, Fig. 2 shows the microstructures corresponding to the arrowed positions 1–4 in Fig. 1, respectively. From the longitudinal cuts of the needles in Fig. 2(a), it can be observed that the needles preferentially grow along a certain crystal direction (as arrowed in the figure). However, the cross-cuts of the needles reveal rhombic forms (as enclosed by the circular frame close to the upper side). When the magnetic field is applied, these “rhombuses” reveal a tendency to align with two opposite sharp tips toward the respective +FD and −FD [“+” and “−” in (b) denote the field parallel and antiparallel direction, respectively], as schematically illustrated in Fig. 2(b). Figure 2(c) displays a typical agglomerate-like crystal consisting of some needles. Further observation indicates that it actually results from a “bifurcation effect.” As shown in the zoomed image [below Fig. 2(c)], needle 1 bifurcates and then grows into needle 2. Analogously, the bifurcation of needle 2 grows into needle 3. Thus, one needle extends in a zigzag pattern to form an agglomerate-like crystal. When these agglomerate-like crystals are crossly cut by the observation plane, chain-like forms consisting of some rhombic crystals will appear [Fig. 2(d)]. In addition, it should also be noted that without and with the field, some of the primary crystals show a hopper form.
Microstructures corresponding to the arrowed positions 1 (a), 2 (b), 3 (c), and 4 (d) in Fig. 1, respectively. In (a), the arrows indicate the preferential crystal growth directions of the needle-like phase and the inset is the <001> pole figure corresponding to the crystal located at the left side. The rhombic frame and double arrows in (b) illustrate the alignment of the crystals, i.e., with two opposite sharp tips toward the +FD and −FD, respectively (“+” and “−” represent the field parallel and antiparallel directions, respectively). The arrow in (c) shows the <100> extension direction of the agglomerate-like crystal, and 1, 2, 3 in the zoomed image corresponding to the rectangular frame denote the bifurcated needles. The arrows in (d) indicate the <100> extension directions of the chain-like crystals J and K, which will be discussed later.

B. Crystallographic features
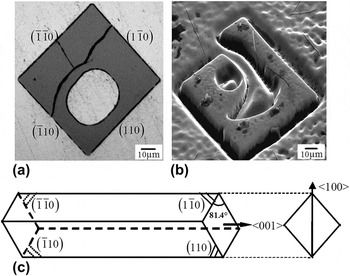
It has been mentioned above that the primary Al6Mn crystals are needle-like. Other than this, most of them also share some other common crystallographic growth features. Figure 3(a) shows the cross-section of a typical primary Al6Mn crystal (perpendicular to Z-axis), which is in a favorable orientation with respect to the observation plane. The regular shape and straight interface traces of the crystal suggest that it exposes faceted planes to the Al matrix. Al6Mn-matrix interface calculation indicates that the side surfaces binding this crystal correspond approximately to the low-index {110} planes (within a deviation of ±5°). Crystallographic analyses on the longitudinal cut of the primary crystals indicate that their preferential growth direction is close to <001> [to demonstrate this, a <001> direction pole figure corresponding to the crystal located at the left side of Fig. 2(a) is given as an inset]. Considering the orthorhombic crystal structure (space group: Cmcm; a = 0.75551 nm, b = 0.64994 nm, and c = 0.88724 nm)Reference Kang, Li, Su, Liu, Guo and Fu19 of Al6Mn, it can be presumed that the needle-like primary Al6Mn crystal is actually in the form of a quadrangular prism in three dimension, as illustrated schematically in Fig. 3(c). This is further evidenced by the SEM image of an Al6Mn crystal in a deep etch pit [Fig. 3(b)]. For the agglomerates or “chains,” crystallographic examination shows that all the needles possess almost the same orientations (within a deviation of less than ±2°) that can be considered as monocrystal and each needle has the preceding crystallographic features. Furthermore, they tend to extend along <100>, as illustrated in Figs. 2(c) and 2(d). This also suggests that the bifurcation initializes from the sharp edges [intersection between  $\left( {\bar 1\bar 10} \right)$&
 $\left( {1\bar 10} \right)$ and/or
 $\left( {\bar 110} \right)$ &
 $\left( {110} \right)$] of the quadrangular prism.
(a) Cross-cut of a typical primary Al6Mn crystal with rhombic shape; (b) SEM image of a Al6Mn crystal in a deep etch pit; (c) schematic form of a primary Al6Mn crystal in three-dimension.

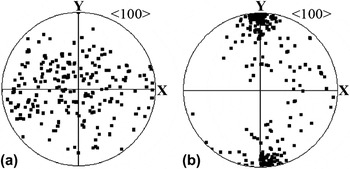
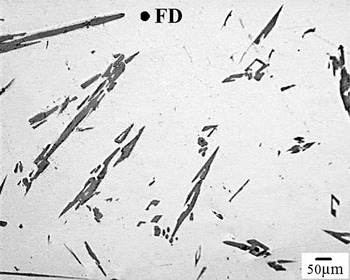
Statistical examination shows that the externally applied magnetic field has little effect on the preceding crystallographic growth features of the dispersed primary crystals. However, it demonstrates clear effects on their orientations: the low-index direction <100> (i.e., a-axis) of these crystals tends to appear in the FD. To visualize this result, the <100> direction pole figures corresponding to some dispersed primary crystals in the longitudinal sections of the specimens without and with the 12 T field are displayed in Figs. 4(a) and 4(b), respectively. It can be observed that without the field, the <100> directions are distributed randomly in the sample coordinate system, whereas with the field, they are mainly concentrated in the FD, suggesting that <100> is the magnetic field-preferred direction of the primary Al6Mn phase. This conclusion is different from that given in Ref. Reference Luo, Guo, Yan and Li20, where <001> is regarded as the field-preferred direction with x-ray diffraction examination (considering that the orientation data of the eutectic Al6Mn phase will be involved in the x-ray diffraction examination, it is believed that the EBSD measurement result on the statistically individual primary Al6Mn crystals in the present work is more reliable). Based on this orientation analysis and the above-mentioned quadrangular prism shape, it can be presumed that with the field, the primary crystals in the transverse sections of the specimen should mainly reveal such a distribution: with their long axes randomly aligned. This has been observed with the microscope [Fig. 5]. For the agglomerates or chains, it is found that only those with the extension direction toward the FD have their <100> parallel to the FD [e.g., chain-like crystal J in Fig. 2(d)], whereas others deviate with their <100> from the FD [e.g., chain-like crystal K in Fig. 2(d)].
<100> direction pole figures corresponding to some dispersed primary Al6Mn crystals in the longitudinal sections of the specimens (a) without and (b) with the 12 T magnetic field, respectively.

Microstructure in the transverse section of the specimen with the 12 T magnetic field.

IV. DISCUSSION
A. Distribution and shape
According to the Al–Mn phase diagram, Al6Mn phase is crystallized primarily from the melt when the temperature drops below the liquidus line (694 °C) during the solidification process of hypereutectic Al–3.25wt%Mn alloy. As the density of the crystallized primary Al6Mn crystals (3090–3270 kg/m3)Reference Mondolfo2 is much higher than that of the liquid aluminum (2372 kg/m3 at 677 °C),Reference Assael, Kakosimos, Banish, Brillo, Egry, Brooks, Quested, Mills, Nagashima, Sato and Wakeham22 they will descend to the lower part of the specimen under the effect of gravity force [Fig. 1(a)]. However, when they fall in the presence of the magnetic field,Reference Jin, Ren, Ren, Deng, Zhong and Yu17 magnetic viscosity resistance force related to the Lorentz force will be induced and tend to prevent their descent [Figs. 1(b) and 1(c)]. This force has also been shown great effectiveness in levitating the primary Al3Fe and Al3Ni phases.Reference Li, Zhang, Esling, Jiang, Zhao, Zuo and Cui13,Reference Wang, Wang, Wang, Li, Nakajima and He18
From the crystallographic investigation results, it has been found that the primary Al6Mn crystals are clearly characterized by an anisotropic crystal growth. Such a character should be mainly determined by its anisotropic crystal structure.Reference Kang, Li, Su, Liu, Guo and Fu19,Reference Prywer23,Reference Prywer24 However, the bifurcation and the final agglomerate- or chain-like shapes induced by the magnetic field should be related to the growth instability at the sharp edges of the quadrangular prisms. In the absence of the magnetic field, natural convections (such as buoyant, surface tension, and thermocapillary convections) exist. Besides, the descendant of the primary crystals can also induce strong melt flows. In such a case, the mass transport is dominated by convections as the convective velocity (≈10−6 m/s) is much greater than the diffusion velocity (≈10−7 m/s).Reference Inatomi25,Reference Kassemi, Barsi, Alexander and Banish26 However, when the magnetic field is applied, these convections will be effectively suppressed.Reference Matthiesen, Wargo, Motakef, Carlson, Nakos and Witt27 Thus, the solute redistribution is dominated by diffusion. So far, numerous experimental and computational findings have shown that both the concentration and concentration gradient in the corner regions of a crystal are much higher than those at the centers of the facets in diffusion-controlled growth and thereby the corners are more instable than the central facets.Reference Berg28–Reference Xiao, Alexander and Rosenberger31 It has also been pointed out that the differences increase as the growing crystal takes on a more open and branched morphology. Based on the theoretical analysis and the simulation results on various growth patterns of crystals in Ref. Reference Xiao, Alexander and Rosenberger31, it is easy to deduce the solute concentration distribution (iso-concentration lines) around a growing Al6Mn crystal (cross-section) in the present work, as shown schematically in Fig. 6. The concentration is progressively increased from the crystal to the deep melt, and the more closely spaced lines represent higher concentration gradient. As can be seen from the iso-concentration lines, the values of the concentrations and concentration gradients at the crystal should be in the following order: A and A′ corners > B and B′ corners > central regions of the surfaces. According to the analysis by Flemings,Reference Flemings32 when the diffusion undercooling at the centers of the facets becomes large enough during the crystal growth, the flat facets tend to break down. This breakdown most probably occurs in such a way in which the corners grow outward due to the high concentration and concentration gradient. Hence, in the present work, the sharp edges at A and/or A′ corners of the Al6Mn crystals obviously should preferentially break down and thus lead to an outward growth along the <100> direction, as indicated in Fig. 6. Subsequently, once the growth conditions are appropriate, the edge protrusion may form a new bifurcated needle connected to the initial one. In such a repeated manner, a single needle finally extends to an agglomerate. This formation mechanism is completely different from that given in Ref. Reference Luo, Guo, Yan and Li20, which attributes the “aggregation” to the interactivity among the magnetized crystals to minimize the magnetization energy. Now let us go back to the situation in the absence of the magnetic field. Due to the convective flushing, it is difficult to create a sufficient solute concentration and concentration gradient near the edges of the crystals to induce an edge breakdown. However, whether with the magnetic field or not, this concentration and concentration gradient may be high enough to induce a preferential growth of the edges (the central surfaces are depressed) along the <001> direction, as indicated in Fig. 6. As a result, a hopper form appears in some of the primary Al6Mn crystals.
Schematic description of the solute concentration distribution (iso-concentration lines) around a growing primary Al6Mn crystal (cross-section). The concentration is progressively increased from the crystal to the deep melt. The more closely spaced lines represent higher concentration gradient. The values of the concentrations and concentration gradients around the crystal are in the following order: A and A′ corners > B and B′ corners > central regions of the surfaces.

Additionally, in the aforementioned morphological features, it has also been presented that the primary Al6Mn crystals show a needle-like form. This may arise from that at the end of the crystal, the growth of the side facets is replaced by that of four other intersecting surfaces, which meet at a point and finally form a pyramid. This has been shown by Kang et al.Reference Kang, Li, Su, Liu, Guo and Fu19
B. Alignment and orientation
In the results, it has been shown that the primary Al6Mn crystals tend to orient with their <100> in the FD when the magnetic field is applied. This should be intimately related to the magnetocrystalline anisotropy of the Al6Mn phase. It is known that magnetization energy will reach the minimum when the crystallographic direction of the paramagnetic crystals with the maximum magnetic susceptibility rotates to the FD.Reference Asai, Sassa and Tahashi33,Reference Sugiyama, Tahashi, Sassa and Asai34 In the present work, <100> obviously corresponds to this direction. Here, it should be clarified that the driving force for the rotation arises from the magnetic torque. However, once the crystal starts to rotate by this torque, two other preventing torques induced by Lorentz force and viscosity resistance force will also be generated simultaneously.Reference Sugiyama, Tahashi, Sassa and Asai34 If the magnetic flux density is not strong enough, the rotation will be suppressed. The alignment of the dispersed primary crystals in the present work [Fig. 2(b)] indicates that these preventing torques are overcome by the magnetic torque when the 12-T field is applied.
When the primary Al6Mn crystals are oriented with the <100> parallel to the field, their preferential growth direction <001> will turn to the direction perpendicular to the field. Accordingly, the rhombic cross-sections of the dispersed primary Al6Mn crystals will have their sharp tips toward the +FD and −FD [Fig. 2(b)], respectively. For the agglomerate- or chain-like crystals, crystallographically they should also tend to orient with the <100> in the FD to minimize the magnetization energy. However, as aforementioned, only those in the central regions of the specimens reveal such a tendency, whereas others with one of their ends close to the peripheral parts show some clear deviations. It is known that liquid metal solidifies inward from the crucible wall. This suggests a higher cooling rate and thus a larger viscosity in the peripheral region than that in the center. The larger viscosity means a stronger viscosity resistance force acting on the rotating Al6Mn crystals. Furthermore, the crucible wall may also act as a favorable site for the inhomogeneous nucleation. The crystals nucleating from the wall may be fixed to the wall. Hence, the field-induced magnetic torque may be suppressed by the viscosity resistance force and/or the connection. Thus, from the beginning of the precipitation, the primary Al6Mn crystals probably deviate with the <100> from the FD. When the crystals grow into the subsequent bifurcation and extension stage, the amount of the primary crystals is also remarkably raised. The increased amount may indicate an unavoidable interaction among the crystals. All of these have detrimental effects on their rotations with <100> to the FD. As a consequence, those primary Al6Mn crystals with one of their ends close to the peripheral region show some clear deviations.
V. CONCLUSIONS
Hypereutectic Al–3.25wt%Mn is solidified whether with a high magnetic field or not in the present work. With a morphological and crystallographic investigation on the primary Al6Mn crystals, it is found that
(1) Without the field, the primary Al6Mn crystals are mainly located in the lower part of the specimen, whereas with the field, they tend to be distributed homogenously through the specimen. This “levitation” effect arises from the induced magnetic viscosity resistance force;
(2) Without the field, the primary Al6Mn crystals are needle-like, whereas with the field, some additional agglomerate- or chain-like crystals appear. In three dimension, the needles are in the form of a quadrangular prism laterally bound by {110} and preferentially grow along <001>. The appearance of agglomerates or chains results from a “bifurcation effect” related to the suppression of convections by the magnetic field and thus the breakdown at the sharp edges of the quadrangular prisms;
(3) With the field, the primary Al6Mn crystals show an orientation tendency with the <100> parallel to the FD, but the agglomerates or chains with one of their ends close to the peripheral parts have some deviations. The tendency should result from the field-induced magnetic torque due to the magnetocrystalline anisotropy of the Al6Mn phase. The deviations of the agglomerates or chains originate from the high viscosity resistance force, the connection to crucible wall, and the possible interaction among the crystals.
ACKNOWLEDGMENTS
This work was supported by the National Natural Science Foundation of China (Grant No. 51201029), the China Postdoctoral Science Foundation (Grant No. 2012M520637), and National Basic Research Program of China (Grant No. 2012CB619506).