
1. Introduction
Detonation propulsion, e.g. a rotating detonation engine, has great potential because of its high thermal efficiency and simple structure (Wolanski Reference Wolanski2013). Efficient detonation initiation is critical to materializing this technology with a compact engine structure and reliable operation. Typically, detonative combustion can be ignited by indirect and direct initiation. For the latter, a detonation can be initiated when the deposited energy is sufficiently high (Mazaheri Reference Mazaheri1997), e.g. through a spark gap (Matsui & Lee Reference Matsui and Lee1976) or detonating cord (Higgins, Radulescu & Lee Reference Higgins, Radulescu and Lee1998). However, due to extremely short space and time scales, detailed detonation initiation and development are difficult to capture experimentally (Radulescu et al. Reference Radulescu, Higgins, Murray and Lee2003), and hence our understanding about the underlying mechanism is still rather limited.
It is well known that a critical energy Ec exists to directly initiate a detonation wave in a detonable mixture (Zhang & Bai Reference Zhang and Bai2014). Depending on the deposited energy Es, three regimes are identified: supercritical  $({E_s} > {E_c})$, critical
 $({E_s} \approx {E_c})$ and subcritical
 $({E_s} < {E_c})$ regimes (Ng & Lee Reference Ng and Lee2003). Zeldovich (Reference Zeldovich1956) proposed a theoretical model to determine the critical energy Ec, where Ec varies exponentially with the induction length. However, due to a series of simplifications involved, the criterion is applicable for stable detonation in which the induction length is relatively small. After that, several prediction models were developed, e.g. by Lee, Knystautas & Guirao (Reference Lee, Knystautas and Guirao1982), Zhang, Ng & Lee (Reference Zhang, Ng and Lee2012) and Ng (Reference Ng2005), in which an average delay in ignition is applied. The critical energy predicted by these models is in good agreement with the experimental data since well-estimated detonation parameters are incorporated, such as the detonation cell size and critical tube diameter. However, the detonation front is intrinsically unstable and exhibits a complex triple-point structure, which plays a key role in the direct detonation initiation (Shen & Parsani Reference Shen and Parsani2017).
Taking detonation curvature and unsteadiness into account, Kasimov & Stewart (Reference Kasimov and Stewart2004) establish a prediction model as  $\bar{\textbf{{D}}} - \textbf{{D}} - \kappa $ (
 $\bar{\textbf{{D}}}$ is detonation wave acceleration, D the detonation speed and κ the curvature), using single-step chemistry. Their model was improved by Soury & Mazaheri (Reference Soury and Mazaheri2009), who incorporated detailed chemical kinetics and predicted better relations between Ec and the equivalence ratio. However, the model works for limited mixture composition due to the complex chemical reaction process and multi-dimensional effects during direct initiation (Zhang & Bai Reference Zhang and Bai2014). Furthermore, some details, including time-dependent detonation structure variations and the effects of unburned pockets on the direct initiation process, cannot be elucidated by these models.
Different from planar detonations, the curvature plays an important role in cylindrical and spherical detonations. He (Reference He1996), Eckett, Quirk & Shepherd (Reference Eckett, Quirk and Shepherd2000), Watt & Sharpe (Reference Watt and Sharpe2004, Reference Watt and Sharpe2005) and Han et al. (Reference Han, Kong, Gao and Law2017) demonstrated the destabilizing effect of global curvature on detonation waves, and larger curvature would aggravate these effects. For instance, He (Reference He1996) found that a maximum curvature is defined by the nonlinear curvature effect, beyond which a self-sustaining detonation cannot be obtained. Eckett et al. (Reference Eckett, Quirk and Shepherd2000) pointed out that the unsteadiness in the induction zone is responsible for failure of detonation initiation. Watt & Sharpe (Reference Watt and Sharpe2004, Reference Watt and Sharpe2005) showed that the pulsation amplitude arising from the curvature varies with the radius with which the detonation is first generated. Considering cellular stability, Han et al. (Reference Han, Kong, Gao and Law2017) found that the detonation structure evolves following three stages, i.e. no cell, growing cells and diverging cells. They also analysed the weakening effect of unburned pockets on the average detonation speed as the detonation cell increases (hence curvature decreases).
Parametric studies further our understanding of the direct initiation mechanism (Bradley et al. Reference Bradley, Morley, Gu and Emerson2002; Qi & Chen Reference Qi and Chen2017; Dai, Chen & Gan Reference Dai, Chen and Gan2019; Gao, Dai & Chen Reference Gao, Dai and Chen2020; Su, Dai & Chen Reference Su, Dai and Chen2021; Sun, Tian & Chen Reference Sun, Tian and Chen2023). For instance, Bradley et al. (Reference Bradley, Morley, Gu and Emerson2002) propose a peninsula-shaped detonation regime in a two non-dimensional parameter ξ–ε diagram for H2 + CO + air mixtures with various equivalence ratios. Differently, Gao et al. (Reference Gao, Dai and Chen2020) find other regimes, i.e. C shape and rhino-horn shape for H2 + air mixtures by changing the initial pressure, temperature and equivalence ratio. Moreover, Chen and his coworkers conduct simulations focusing on multiple parameters, i.e. temperature perturbation (Qi & Chen Reference Qi and Chen2017), CO2 dilution (Dai et al. Reference Dai, Chen and Gan2019), a kinetic model (Su et al. Reference Su, Dai and Chen2021) and ozone addition (Sun et al. Reference Sun, Tian and Chen2023) and further demonstrate their respective effects on the detonation initiation regimes for extended mixtures.
Most previous work on direct initiation is focused on one-dimensional problems, where only longitudinal pulsating instability is incorporated (Eckett et al. Reference Eckett, Quirk and Shepherd2000; Bradley et al. Reference Bradley, Morley, Gu and Emerson2002; Ng & Lee Reference Ng and Lee2003; Watt & Sharpe Reference Watt and Sharpe2004; Watt & Sharpe Reference Watt and Sharpe2005; Han et al. Reference Han, Kong, Gao and Law2017; Qi & Chen Reference Qi and Chen2017; Dai et al. Reference Dai, Chen and Gan2019; Gao et al. Reference Gao, Dai and Chen2020; Su et al. Reference Su, Dai and Chen2021; Sun et al. Reference Sun, Tian and Chen2023). Nonetheless, in realistic situations, multi-dimensional cellular instability should be considered. Shen & Parsani (Reference Shen and Parsani2017, Reference Shen and Parsani2019) study the effects of multi-dimensional instabilities on the direct initiation by comparing the phenomena from one- and two-dimensional simulations. Their results show that the one-dimensional configuration becomes invalid for unstable detonations. They also emphasize the important role of strong transverse waves from multi-dimensional instabilities in the failure and initiation processes of detonation. Moreover, Han, Kong & Law (Reference Han, Kong and Law2018) examine the effects of the activation energies of chemical kinetics on detonation initiation. They find that the continuous propagation of cellular detonation with higher activation energies exhibit a stronger dependence on regeneration of the transverse wave. Furthermore, Jiang et al. (Reference Jiang, Han, Wang and Zhang2009) identify four mechanisms of the cell diverging in cylindrical detonation expansion based on two-dimensional simulations. This provides a deeper insight into the relation between flow instability and generating/diminishing transverse waves in different patterns. Besides, Asahara et al. (Reference Asahara, Hayashi, Yamada and Tsuboi2012) further show the detailed Mach configuration and generation of sub-transverse waves during the cell diverging process.
Past work on direct detonation initiation is mostly concentrated on uniform mixtures. In practice, non-uniform mixtures widely exist in real-world applications, e.g. due to the insufficient mixing of fuel and oxidizer, which significantly affects the detonation initiation and development. Previous numerical works mainly focus on the detonation development in mixtures with gradient in tubes (Boeck, Berger & Sattelmayer Reference Boeck, Berger and Sattelmayer2016; Han, Wang & Law Reference Han, Wang and Law2019; Lu, Kaplan & Oran Reference Lu, Kaplan and Oran2023). Direct initiation in non-uniform mixtures in free space may be more complicated, including the curvature effects, which, to the best of our knowledge, is still lacking. Furthermore, the effects of hotspot properties (e.g. reactive, or non-reactive) on the mechanisms of detonation initiation have not been well understood. In the current study, we aim to examine the effects of hotspot properties and mixture composition gradient on direct detonation initiation. Two-dimensional simulations with a detailed chemical mechanism will be conducted. The manuscript is organized as follows: § 2 presents the governing equation and numerical method, whilst the results and discussion are detailed in §§ 3 and 4, respectively, followed by § 5 with conclusions.
2. Mathematical and physical models
2.1. Numerical method
The Navier–Stokes equations of mass, momentum, energy and species mass fractions are solved for compressible reacting flows, with the solver RYrhoCentralFoam (Zhao, Cleary & Zhang Reference Zhao, Cleary and Zhang2021). The accuracies of RYrhoCentralFoam in detonation simulations have been extensively validated (Huang et al. Reference Huang, Zhao, Xu, Li and Zhang2021), and it has been used for various detonation problems (Huang & Zhang Reference Huang and Zhang2020; Huang, Cleary & Zhang Reference Huang, Cleary and Zhang2020; Xu, Zhao & Zhang Reference Xu, Zhao and Zhang2021). The details on code validation for cylindrical detonation are given in the supplementary material available at https://doi.org/10.1017/jfm.2023.512. A second-order implicit backward method is employed for temporal discretization, and the time step is 1 × 10⁻⁹ s. A Riemann-solver-free MUSCL (Monotone Upstream-centered Schemes for Conservation Laws) scheme (Kurganov, Noelle & Petrova Reference Kurganov, Noelle and Petrova2001) with van Leer limiter is employed to calculate the convective fluxes in the momentum equations. The total variation diminishing scheme is used for the convection terms in the energy and species equations, whilst a second-order central differencing scheme is adopted for the diffusion terms in the equations of momentum, energy and species mass fractions (Greenshields et al. Reference Greenshields, Weller, Gasparini and Reese2010; Huang et al. Reference Huang, Zhao, Xu, Li and Zhang2021). A detailed hydrogen mechanism is applied, with 13 species and 27 reactions (Burke et al. Reference Burke, Chaos, Ju, Dryer and Klippenstein2012). The chemical source term is integrated with an implicit Euler method.
2.2. Physical problem and numerical implementation
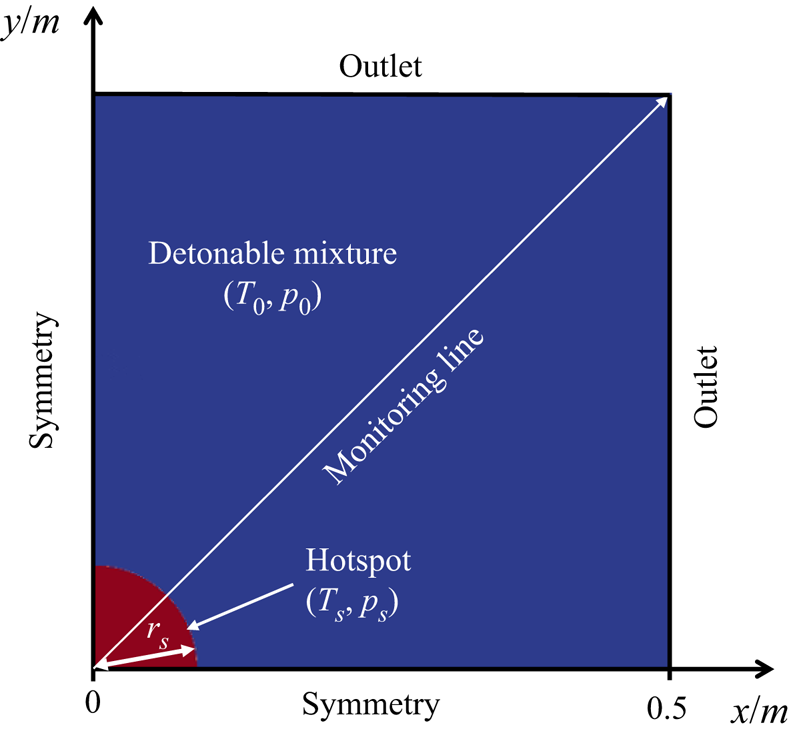
The expanding cylindrical detonation has the intrinsic characteristic of cellular instability, which plays an important role in initiation of transverse waves (Han et al. Reference Han, Kong, Gao and Law2017; Shen & Parsani Reference Shen and Parsani2017). In this work, two-dimensional simulations (see figure 1) are conducted to capture the detonation frontal instability and dynamic behaviours. Due to the geometrical symmetry, a quarter area of the domain is simulated, and the domain is 0.5 × 0.5 m2 (see figure 1). The x and y axes are aligned with the symmetry boundaries, and the radius is  $R = \sqrt {({x^2} + {y^2})} $. For two outlets, a wave-transmissive condition is enforced for the pressure, and a zero-gradient condition for all rest quantities.
Schematic of the computational domain and boundary condition. Hotspot size not to scale.

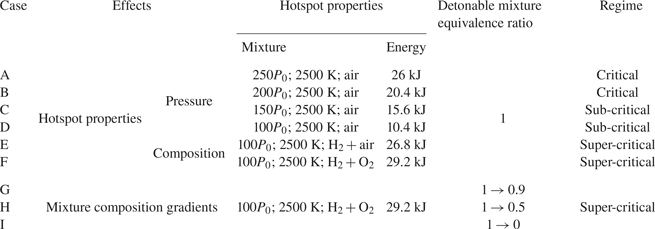
The domain consists of two parts, as illustrated in figure 1. The first part is the circular hotspot with high temperature and pressure, (Ts, ps), to mimic a localized ignition, e.g. resulting from additional energy deposition or shock focusing. The radius is fixed to be rs = 0.02 m in the simulations. The energy deposited in the hotspot is also clarified (Lee Reference Lee1984), as listed in table 1. In this sense, the amount of energy deposited in the hotspot is large enough to create a significant thermochemical response leading to a strong blast wave in the reactive mixtures, resembling the classical instantaneous energy deposition to a point (Regele et al. Reference Regele, Kassoy, Aslani and Vasilyev2016). Varying the hotspot size (Lee & Ramamurthi Reference Lee and Ramamurthi1976; Mazaheri Reference Mazaheri1997) or thermodynamic perturbation addition near the hotspot (Qi & Chen Reference Qi and Chen2017) may affect the detonation initiation (an effect of pressure perturbation near the hotspot is shown in § D of the supplementary document), but we will not study it in this paper. Both non-reactive (the hotspot composition is air) and reactive (H2 + O2 or H2 + air) hotspots are considered.
Details of simulated cases.

The second part, beyond the hotspot, is filled with quiescent detonable gas, i.e. H2 + O2 + N2 mixtures. The initial pressure is p 0 = 20 265 Pa and the initial temperature is T 0 = 300 K. Both uniform and varying composition of the detonable mixture will be studied. For the former, the composition of the gaseous mixture is H2:O2:N2 = 0.0282:0.2255:0.7463 by mass. For the latter, a linear change of the equivalence ratio along the radial direction will be considered to examine its effects on detonation initiation and subsequent development.
Uniform 62.5 μm Cartesian cells are adopted to discretize the domain in figure 1, and the total mesh number is approximately 64 million. The half-reaction length from the theoretical Zel'dovich–von Neumann–Döring structure is approximately l 1/2 = 1 mm, calculated by the shock and detonation toolbox (Shepherd Reference Shepherd2021), and hence the foregoing mesh size corresponds to approximately 16 pts/l 1/2 for a Chapman–Jouguet (CJ) detonation. The mesh sensitivity test is shown in § A of the supplementary document, and the results show that mesh convergence can be obtained when the mesh resolution of 16 pts/l 1/2 is employed.
2.3. Simulation case
Parametric studies are performed and nine cases, i.e. A–I, are selected for discussion in this paper (see details in table 1). Specifically, case A–F have different hotspot parameters, whereas case F–I have different composition gradients in the detonable gas. When the air is filled in the hotspot, the critical regime dominates for relatively high p 0 (e.g. A and B), whereas the sub-critical regime dominates for low p 0 (e.g. C and D). Moreover, a super-critical regime is observed with reactive hotspots (e.g. E and F). To study the mixture composition gradients, a reactive hotspot with H2 + O2 (same as F) is selected to ensure successful initiation. Three equivalence ratio gradients are considered. Specifically, the equivalence ratio in the vicinity of the hotspot (the radius R = 0.02 m) is fixed to be 1, which decreases linearly to a certain value (e.g. 0.5, see table 1) at the outer edge (R = 0.5 m). For easy reference, we use an arrow to indicate the radial equivalence ratio (ER) change, e.g. 1 → 0.9 in case G.
3. Results
3.1. Effects of hotspot properties
In this section, we will study the effects of hotspot pressure and gas composition on the detonation initiation and development in a uniform detonable gas.
3.1.1. Hotspot pressure effects
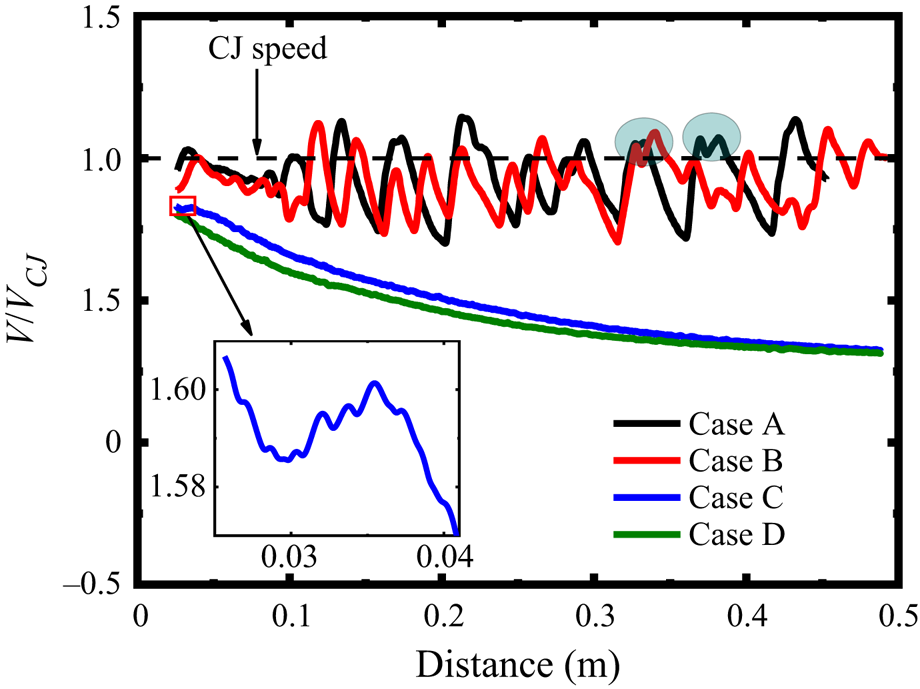
Figure 2 shows the leading shock speed versus the radius with different hotspot pressures, i.e. ps = 250p 0, 200p 0, 150p 0, 100p 0. They are case A–D, and the hotspot is filled with air. The shock speed is estimated along the radial monitoring line (see figure 1). The detonation is successfully initiated only when ps ≥ 200p 0. Under relatively low hotspot pressures, the shock from the hotspot decelerates quickly and the detonation initiation fails. For instance, with ps = 150p 0, the shock speed increases from 0.03 to 0.035 m after an initial drop (see the inset of figure 2). This is because intense reactions are triggered to release energy intensifying the shock. However, due to fast shock decay, the reaction front (RF) fails to coherently couple with the leading shock front (SF). Therefore, the latter degrades to a blast wave with a speed of around 0.3VCJ, corresponding to the sub-critical regime (Ng & Lee Reference Ng and Lee2003).
Change of the leading shock speed with radial distance when different hotspot pressures are considered (cases A−D).

With ps = 200p 0 and 250p 0, the shock from the ignition spot steepens into an overdriven detonation, due to the strengthening effects from the shocked mixture. The detonation gradually decays to a freely propagating detonation around 0.1 m. This can be categorized into the critical regime. The average propagation speed is slightly lower than the CJ speed, which is caused by the curvature effects (Ng & Lee Reference Ng and Lee2003).
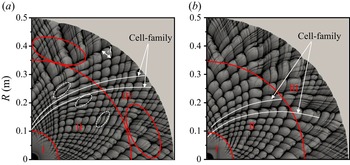
Figure 3 shows the detonation cell evolutions recorded from the peak pressure trajectories in cases A and B. For cylindrical detonations, the cell size λ is defined from the azimuthal direction (roughly perpendicular to the detonation propagation direction) (Lee Reference Lee1984). For both cases, the detonation cell experiences three stages as the front curvature decreases: no cell (I), growing cells (II) and diverging cells (III), as annotated in figure 3. This is consistent with the observation by Han et al (Reference Han, Kong, Gao and Law2017). However, the detonation cell growth is not quantified in their study, and the detailed divergence process and mechanism still remain to be revealed. In the diverging cells stage, new cells are generated from the enlarged ones. Therefore, some small fluctuations of the shock speed along the monitoring line are superimposed on the original periodic fluctuations, leading to double peaks, see the circles in figure 2. Besides, the detonation cell evolution before the cell divergence stage (III) is featured by a series of cell families. The results show that the number of detonation cells keeps almost constant as the cells grow. As such, the detonation cell increases linearly with the distance. Besides, higher hotspot pressure generates more cell families, corresponding to a globally smaller cell size. The calculated cell-family numbers in cases A and B are approximately 17 and 12, respectively. This is justifiable because a large hotspot pressure results in a high overdrive degree of the newly generated detonation wave. Besides, at R > 3.5 m, the cell begins to diverge in both cases. The divergence happens only in locally larger cells in case A (see red circles), but in a larger domain in case B with a greater growth rate.
Detonation cell evolutions with different hotspot pressures: (a) case A, ps = 250p 0; (b) case B, ps = 200p 0. Stage I: no cell; II: cell growing; III: cell diverging.

3.1.2. Hotspot composition effects
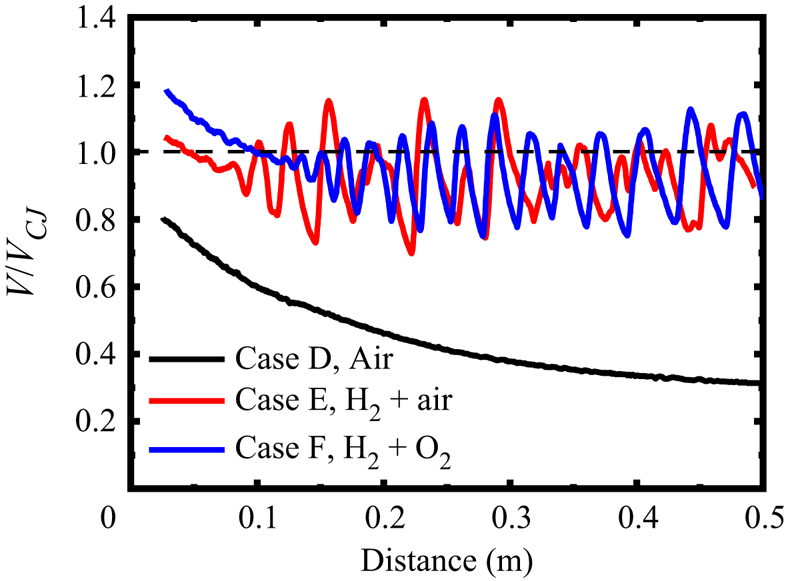
Here, we will further examine the influences of hotspot composition on detonation initiation and development. Figure 4 shows the shock speed evolutions when two reactive hotspots are considered, i.e. stoichiometric H2 + air and H2 + O2 mixtures. They are cases E and F, respectively. The result with air hotspot (i.e. case D) is included for comparison. The hotspot pressure is 100p 0. Different from the observation in § 3.1.1, an overdriven detonation is directly initiated and then decays to CJ detonation in both cases E and F, which corresponds to the super-critical regime (Ng & Lee Reference Ng and Lee2003). As the overdrive degree decays, the periodic fluctuations of the shock speed occur earlier in case E, indicating an earlier onset of detonation cellularization. Furthermore, the speed fluctuation in case E exhibits more irregularity, especially at larger radii (hence smaller curvature).
Change of the leading shock speed with radial distance in cases D−F. ps = 100p 0. Dotted horizontal line: CJ speed.

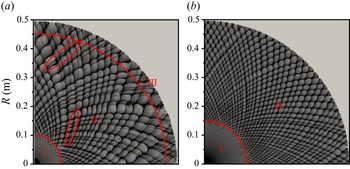
Figure 5 shows the cell evolutions in cases E and F. In general, the cells in case F (H2 + O2) are smaller and more uniform. Only two stages appear, i.e. no cell (I) and growing cell (II). Even at the maximum radius in our simulation, the cell is still too small to diverge. Furthermore, in case E (H2 + air), some relatively small cells merge with the adjacent larger ones at the second stage, see the red circles in figure 5(a). This phenomenon will be further discussed in § 4.2. Moreover, cell divergence occurs at R = 0.45–0.5 m. The cell inhomogeneity and diverging behaviour lead to irregular shock speed fluctuations in figure 4. The cell-family number in E and F are 18 and 31, respectively. Consequently, the cell in F grows more slowly and its maximum cell size reaches approximately 27 mm, slightly smaller than the theoretical value, 28.9 mm (Ng, Ju & Lee Reference Ng, Ju and Lee2007). In this sense, the detonation can still propagate in a self-sustaining fashion without new cell generation. Combined with figure 3, it can be found that there exists a range within which cell divergence is more likely to take place, and in § 4.2 we will further study this range.
Detonation cell evolutions with different hotspot compositions: (a) case E: stoichiometric H2 + air mixture; (b) case F: stoichiometric H2 + O2 mixture. Stage I: no cell; II: cell growing; III: cell diverging.

3.2. Effects of composition gradient in the detonable mixture
In this section, we will study detonation initiation in H2 + air mixtures with a spatially varying equivalence ratio. Specifically, the ER in the vicinity of the hotspot is 1, and then decreases linearly to 0.9, 0.5 and 0 at R = 0.5 m in cases G, H and I, respectively. A hotspot (100p 0, 2500 K) with a stoichiometric H2 + O2 mixture is employed, the same as that in case F.
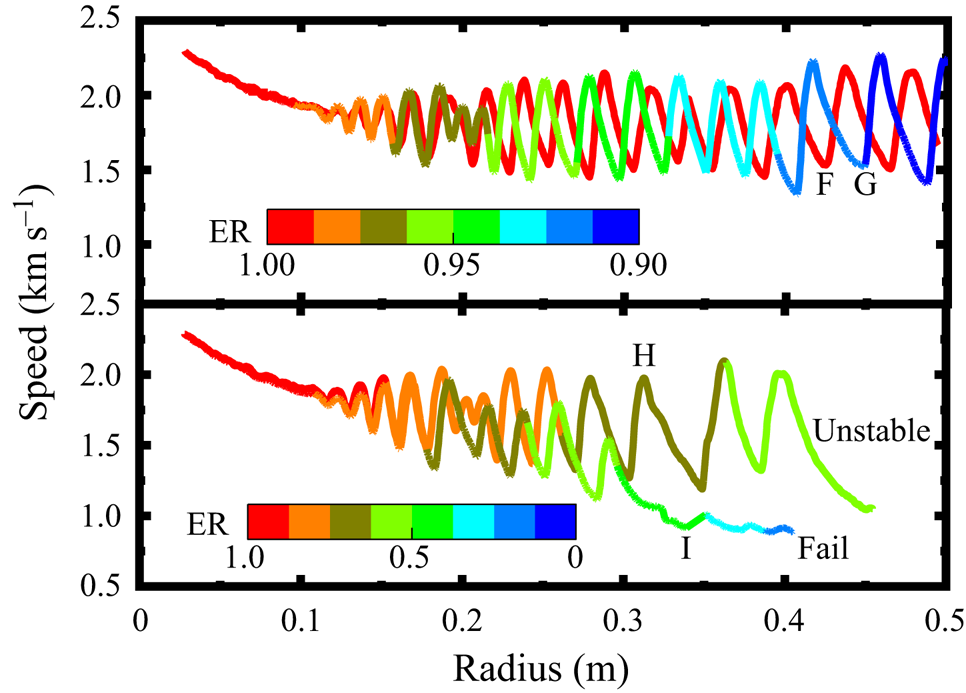
Figure 6 shows the variations of the leading shock speed in cases F–H along the monitoring line. Since the reactive hotspot (H2 + O2) is employed, overdriven detonations are directly triggered by it in all cases. Generally, their shock speeds are close before 0.1 m, due to the near-stoichiometric ERs. Beyond that, significant differences appear when the multi-headed detonations start to develop, featured by various speed fluctuations. Among them, continuous detonation propagation happens only in cases F (uniform, φ: 1 → 1) and G (φ: 1 → 0.9). The average shock speed during the cellular detonation stage (R = 0.12–0.5 m) in G is 1756 m s−1, slightly lower than that in F (1768 m s−1) since the mixture reactivity decreases slightly in the former case (see § C of the supplementary document). Moreover, in cases H and I, the overdriven detonation gradually decouples when it runs outwardly. Specifically, in case H (φ: 1 → 0.5), when the shock propagates across R = 0.3 m (the local ER is φ = 0.71), the period of speed fluctuation increases significantly, indicating a more unstable detonation front. In case I (φ: 1 → 0), the detonation wave quickly decouples across R = 0.3 m (φ = 0.42) with a shock speed below 900 m s−1.
Change of the leading shock speed with radial distance in cases F−I. The profiles are coloured by the local equivalence ratio.

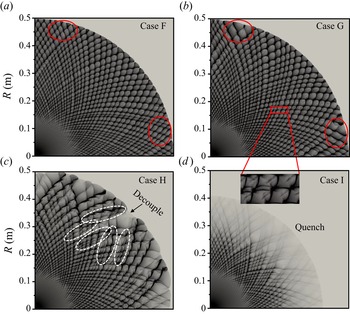
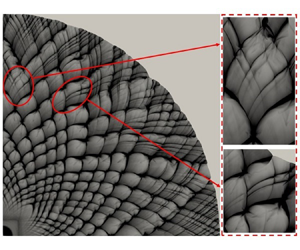
Figure 7 shows the detonation cell evolutions in cases F–I. Almost uniform cells appear at approximately 0.15 m and grow until 0.5 m in both F and G, except for locally larger cells, as annotated by the red circles in figures 7(a) and 7(b). This phenomenon is attributed to the cell-family differences (i.e. 31 for F, 27 for G) and cell coalescence (see the inset in figure 7), which are caused by the drop of mixture reactivity with the decrease of ER in case G, especially at larger radii (see § C of the supplementary document).
Detonation cell evolution with different mixture composition gradients in cases F–I.

Increased composition gradient in cases H and I leads to a remarkable change of the detonation cell distribution, as shown in figures 7(c) and 7(d). In case H (φ: 1 → 0.5), the cells grow steadily from R = 0.15 to 0.3 m and remain diamond shaped. Beyond that, they become irregular, and some cells grow faster and then merge with the adjacent smaller cells. As the detonation propagates across R = 0.25 m (φ = 0.75), irregular cells grow as the reactivity of mixtures drops significantly (see § C of the supplementary document). Therefore, apart from the curvature decrease, which leads to the increase of the detonation cell size, the cell coalescence induced by the ER variation plays a more important role in the oversized cell generation. This oversized cell further causes the local detonation quenching. At around R = 0.5 m (φ = 0.5), the detonation becomes very unstable and detonative combustion is even quenched at most of the front. In case I (φ: 1 → 0), the detonation cells appear at around R = 0.13 m and grow slightly until 0.3 m, like the rest of the cases in figure 7. However, detonation extinction happens beyond R = 0.3 m (φ = 0.42) due to a dramatic drop of mixture reactivity (see § C of the supplementary document), with quickly faded peak pressure trajectories in figure 7(d).
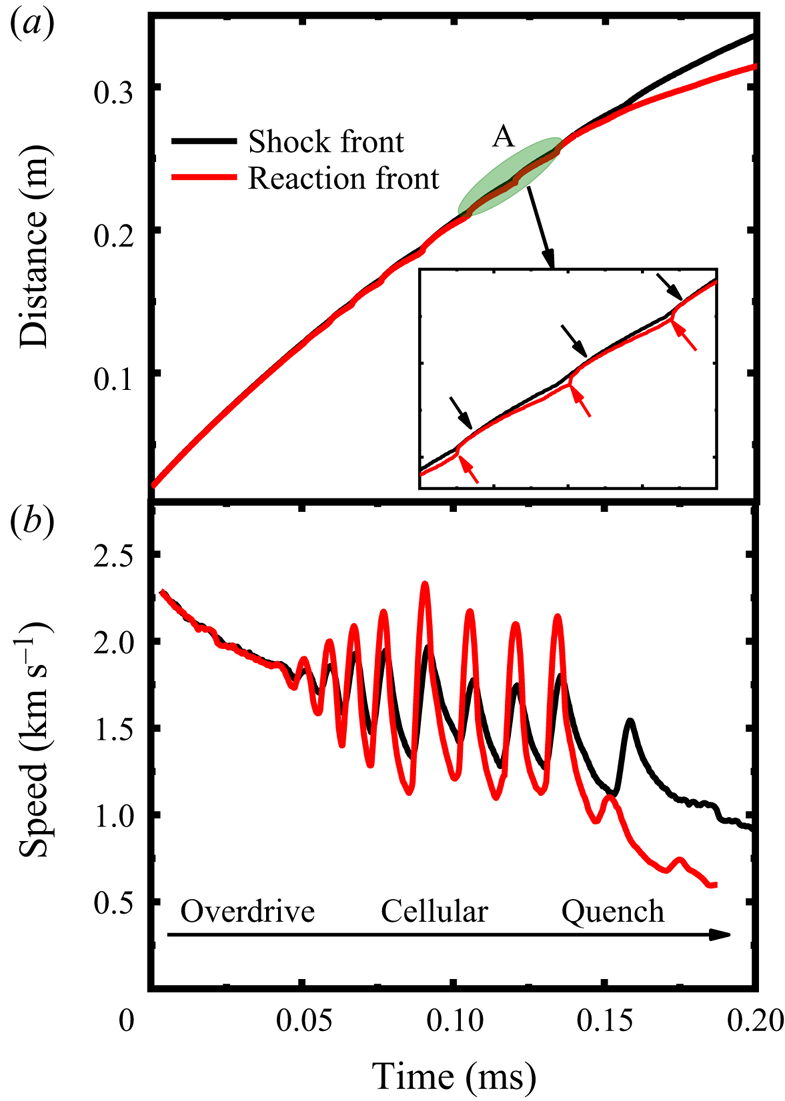
Figure 8 shows the time evolutions of the shock speed and SF/RF position along the monitoring line in case I. Three stages can be identified: overdriven detonation (0–0.05 ms), cellular detonation (0.5–0.13 ms) and detonation quenching (0.13–0.2 ms). At the cellular detonation stage, the shock speed experiences periodic variations with an increasing time interval. The inset in figure 8(a) provides the change of SF/RF in the cellular detonation stage. The red arrows indicate the abrupt acceleration of the RF, whereas the black ones point to the generation of the Mach stem (MS). From figure 8(b), the speeds of both fronts fluctuate after 0.05 ms and the periodic variations of the SF speed are delayed relative to that of the RF, manifesting an intrinsic characteristic of unstable cellular detonation. From 0.13 ms, the RF speed continuously decreases and is lower than that of the SF, which indicates the decoupling of SF and RF.
Time history of (a) SF and RF position and (b) propagation speed along the monitoring line in case I.

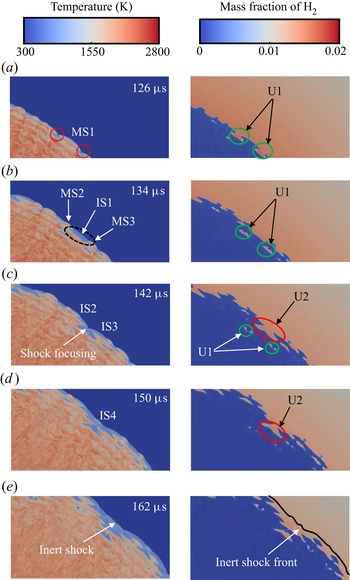
Figure 9 shows the distributions of temperature and hydrogen mass fraction at different instants during the detonation extinction process in case I. From 126–134 μs, the Mach stem, MS1, gradually attenuates and evolves to an incident shock, IS1, with the unburned pocket 1 (U1) left behind, which weakens the SF intensity. Meanwhile, a longer induction zone is formed behind IS1. Two detonation bubbles are generated from the local explosion induced by shock focusing (Lee Reference Lee2008) (see the red circle at 126 μs), which evolves into the MS2 and MS3 (see 134 μs). Due to the increased induction length, the new ISs collide with each other, leading to weaker focusing energy (see 142 μs). Therefore, another larger unburned pocket (U2) is generated, which further reduces the local heat release. Another new IS4 develops from the focusing and propagates outwardly; however, the reaction cannot be triggered by this weak focusing, e.g. at 150 μs. Consequently, the detonation quenches and further degenerates into an inert shock wave at 162 μs. Meanwhile, when the RF and SF are fully decoupled (at 162 μs), considerable unburned H2 exists behind the shock, and the low temperature can be found between the SF and RF.
Time sequence of temperature and hydrogen mass fraction in case I.

4. Discussion
4.1. Hotspot evolution and its relevance to detonation initiation
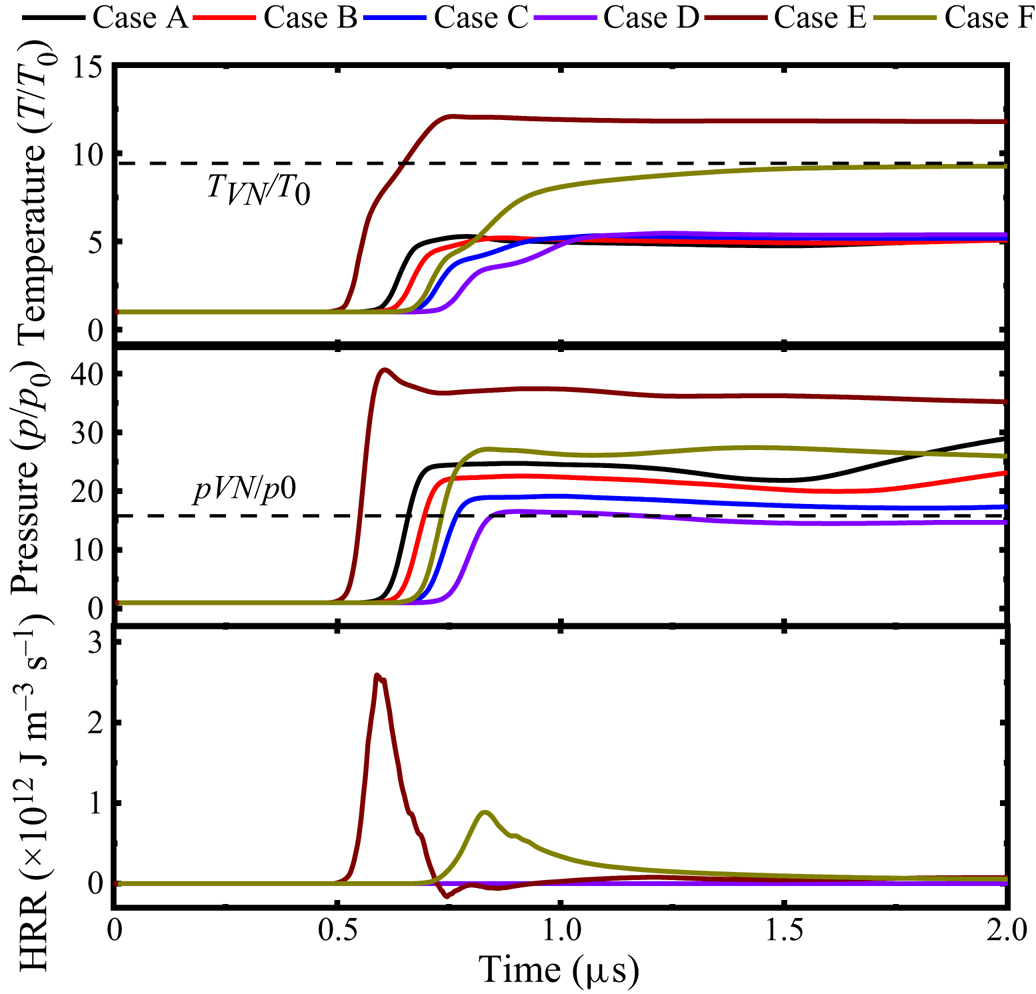
Hotspot evolution and its relevance to detonation initiation will be discussed here based on cases A–F. Figure 10 shows the time history of temperature, pressure and heat release rate (HRR), from a probe of R = 21 mm, i.e. 1 mm off the hotspot vicinity along the monitoring line. It is shown that intense chemical reactions take place in two reactive hotspots (i.e. cases E and F) with the maximum pressure and temperature higher than the corresponding von Neumann values. This indicates that the detonations are initiated directly from the hotspot. Note that the detonation in case E manifests a higher overdrive degree (f = 1.41) than that in F (f = 1.09) due to higher oxygen concentration (Short & Stewart Reference Short and Stewart1999). As the overdriven detonation expands outwardly, the probe (i.e. already in the post-detonation area) temperature and pressure decrease gradually towards a constant value, whereas the HRR is reduced to almost zero.
Evolutions of (a) temperature, (b) pressure and (c) HRR from the probe (R = 21 mm). The von Neumann states are from the detonable gas condition (H2 + air mixture).

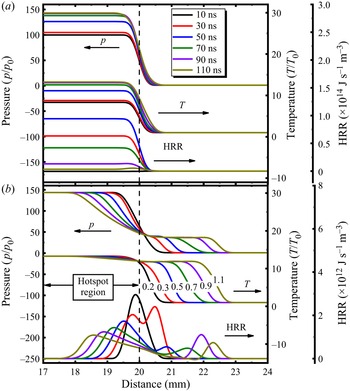
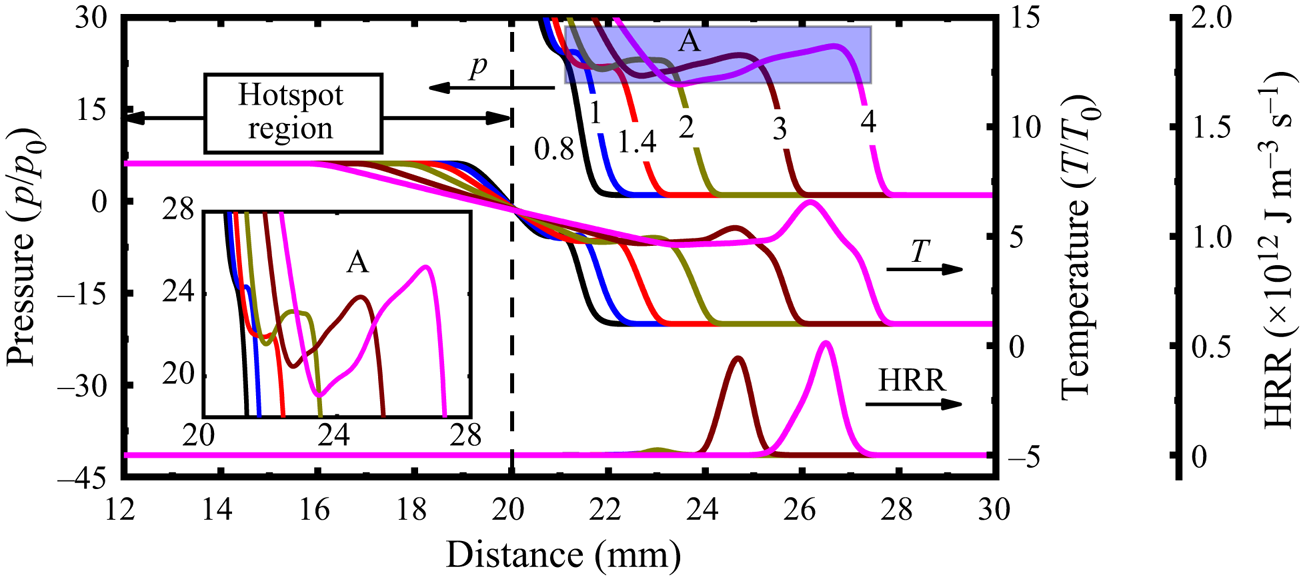
Figure 11(a) shows the evolutions of the reactive hotspot along the monitoring line from 10 to 110 ns in case F (H2 + O2 hotspot, ps = 150p 0). The reader should be reminded that, due to one-dimensional nature of early shock/detonation structures, the results in figure 11 do not exhibit azimuthal variations. Homogeneous isochoric reactions occur inside the spot, leading to quickly increased pressure and temperature. The HRR peaks at approximately 41.5 ns, and then quickly decreases to low values at around 110 ns. Meanwhile, the hotspot pressure and temperature remain unchanged from 90 to 110 ns, indicating the completion of chemical reactions in the hotspot. During this period, the premixture outside the hotspot remains intact; see figure 11(a). The hotspot reaction leads to increased pressure and temperature gradients at the hotspot vicinity, which play an important role in initiating a detonation (Gu, Emerson & Bradley Reference Gu, Emerson and Bradley2003).
Changes of pressure, temperature and HRR in the hotspot at (a) 10–110 ns and (b) 0.2–1.1 µs in case F. Time stamps in (b) are in microseconds.

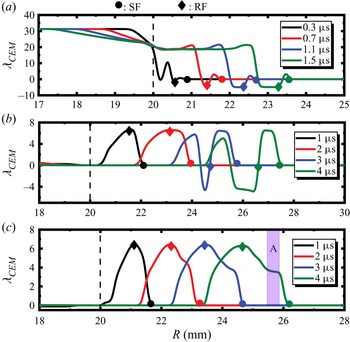
Plotted in figure 11(b) are the state evolutions at the hotspot vicinity after 0.2 μs. Apparently, an outwardly propagating SF (the shock pressure is around 40p 0) emanating from the hotspot vicinity can be observed. It arrives at the probe at around 0.5 μs, resulting in a pronounced pressure rise, as shown in figure 10. An RF trails behind the shock, burning the compressed H2 + air mixture, featured by high HRR. Their mutual reinforcement quickly initiates a developing detonation, as found from the subsequent instants (0.7–1.1 μs) in figure 11(b). Furthermore, the corresponding evolutions of λCEM, a chemically explosive mode (Lu et al. Reference Lu, Yoo, Chen and Law2010; Goussis et al. Reference Goussis, Hong, Najm, Paolucci and Valorani2021), along the monitoring line are shown in figure 14(a). Note that the chemical explosive mode (CEM) is a chemical property of local gaseous mixture and characterizes the chemical explosion propensity of the shocked gas, and hence has been extensively employed in transient detonation problems (Xu et al. Reference Xu, Zhao and Zhang2021; Guo et al. Reference Guo, Xu, Li and Zhang2022; Jin et al. Reference Jin, Xu, Zheng and Zhang2023). The value of λCEM corresponds to the reciprocal time scale of the chemical explosion. Finite λCEM exists near the hotspot vicinity, as shown in figure 14(a), manifesting the locally strong reactivity, which induces the immediate onset of detonation. Besides, there is a secondary inwardly propagating RF in the spot in figure 11(b). This may be attributed to chemical reactions as the local temperature drops due to thermal diffusion (see figure 11b). In addition, the hotspot evolution in case E is generally like that in F, but the shock arrives at the probe around 0.2 μs later, due to a slower speed.
Differently, for non-reactive hotspots in cases A–D, we can see from figure 10 that, although the maximum pressure exceeds the von Neumann values, their maximum temperatures are much lower than the respective von Neumann values. Furthermore, their peak HRRs that occur downstream of the hotspot are almost four orders of magnitude smaller than those in E and F. All these indicate that only shock compression occurs there and detonation has not developed yet. As shown in § 3, detonations are ultimately initiated in cases A and B. Therefore, it is interesting to further investigate how they are generated with a shock from the hotspot.
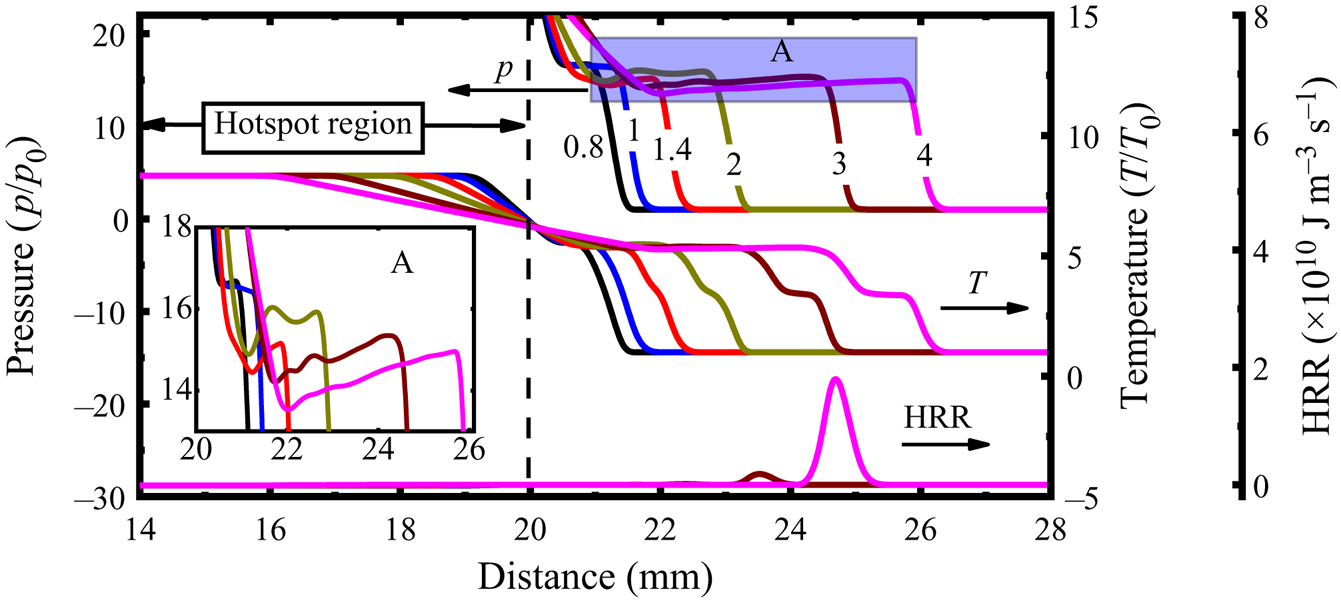
We first look at case A, and the corresponding hotspot evolutions along the monitoring line from 0.8 to 2 μs are shown in figure 12. Note that the pressure inside the spot is maintained at the initial value, i.e. 250p 0, since no reactions happen therein (not displayed in figure 12). At larger radii, e.g. at R = 21–28 mm, the pressure peak first deceases and then increases, see the inset of figure 12. This is because the leading shock, generated at the hotspot vicinity, decays as it travels outwardly (see the HRR profiles, 0.8–1.4 μs). The peak pressure at 1.4 μs is around 22p 0, 1.4 times the von Neumann value, whilst the peak HRR reaches around 1.5 × 10⁹ J m−3 s−1 (not shown in figure 12). Subsequently, the reactions start in the shocked mixture (2–3 mm off the hotspot) at approximately 2 μs, and the peak HRR increases to around 5 × 10¹¹ J m−3 s−1 at 3–4 μs. This indicates the formation of a shock-induced auto-igniting RF and its acceleration behind the leading SF (Gu et al. Reference Gu, Emerson and Bradley2003). As the RF couples to the leading SF, the detonation is initiated. In this case, λCEM keeps zero close to the hotspot (see figure 14b), increases immediately behind the SF and peaks at the RF from 1 to 2 μs. As the autoignition wave approaches the SF, the distribution of λCEM shows double peaks at 3–4 μs and the λCEM rises dramatically behind the SF. This detonation initiation fashion differs from those in cases E and F, where the unburned mixture is directly ignited by the detonation from the hotspot. As such, it can be expected that detonation initiation beyond the hotspot is more affected by reactivity of the detonable mixture, besides the hotspot itself. The hotspot evolution in case B is like that in A, but with a delayed detonation initiation. The shock wave arrives at the probe 0.02 μs later than that in case A, see figure 10.
Changes of pressure, temperature and HRR near the hotspot at 0.8–2 μs in case A. Time stamps in microseconds.

Figure 13 shows the hotspot evolution along the monitoring line in case D. Similar to case A, the pressure peak drops initially (0.8–1.4 μs) and then increase (2 μs). However, it drops again from 2 to 4 μs; see the inset in figure 13. This is because, although the reaction contributes to the shock amplification, the peak pressure remains only 14–16p 0, close to the von Neumann value (15.1p 0) (Shepherd Reference Shepherd2021). Furthermore, the thermally neutral zone is continuously lengthened from 2 to 4 μs. The auto-ignition RF is also ignited like case A. Nonetheless, the RF cannot synchronize with the leading SF, eventually failing to initiate the detonation. Different from case A, the distribution of CEM shows one single peak at 3–4 μs in case D (see figure 14c), and an obvious plateau appears during the rise of the λCEM (see A region in figure 14c) at 4 μs due to the decoupling of the RF and SF. Actually, during the later propagation of the shock, no detonation development (e.g. deflagration-to-detonation transition) is found. In another detonation failure case, C, hotspot evolution is generally similar to that in case D.
Changes of pressure, temperature and HRR in the hotspot at 0.8–4 μs in case D. Time stamps in microseconds.

Evolutions of the chemical explosion mode along the monitoring line during the hotspot development. (a) Case F, (b) case A, (c) case D. Dotted vertical lines: hotspot vicinity.

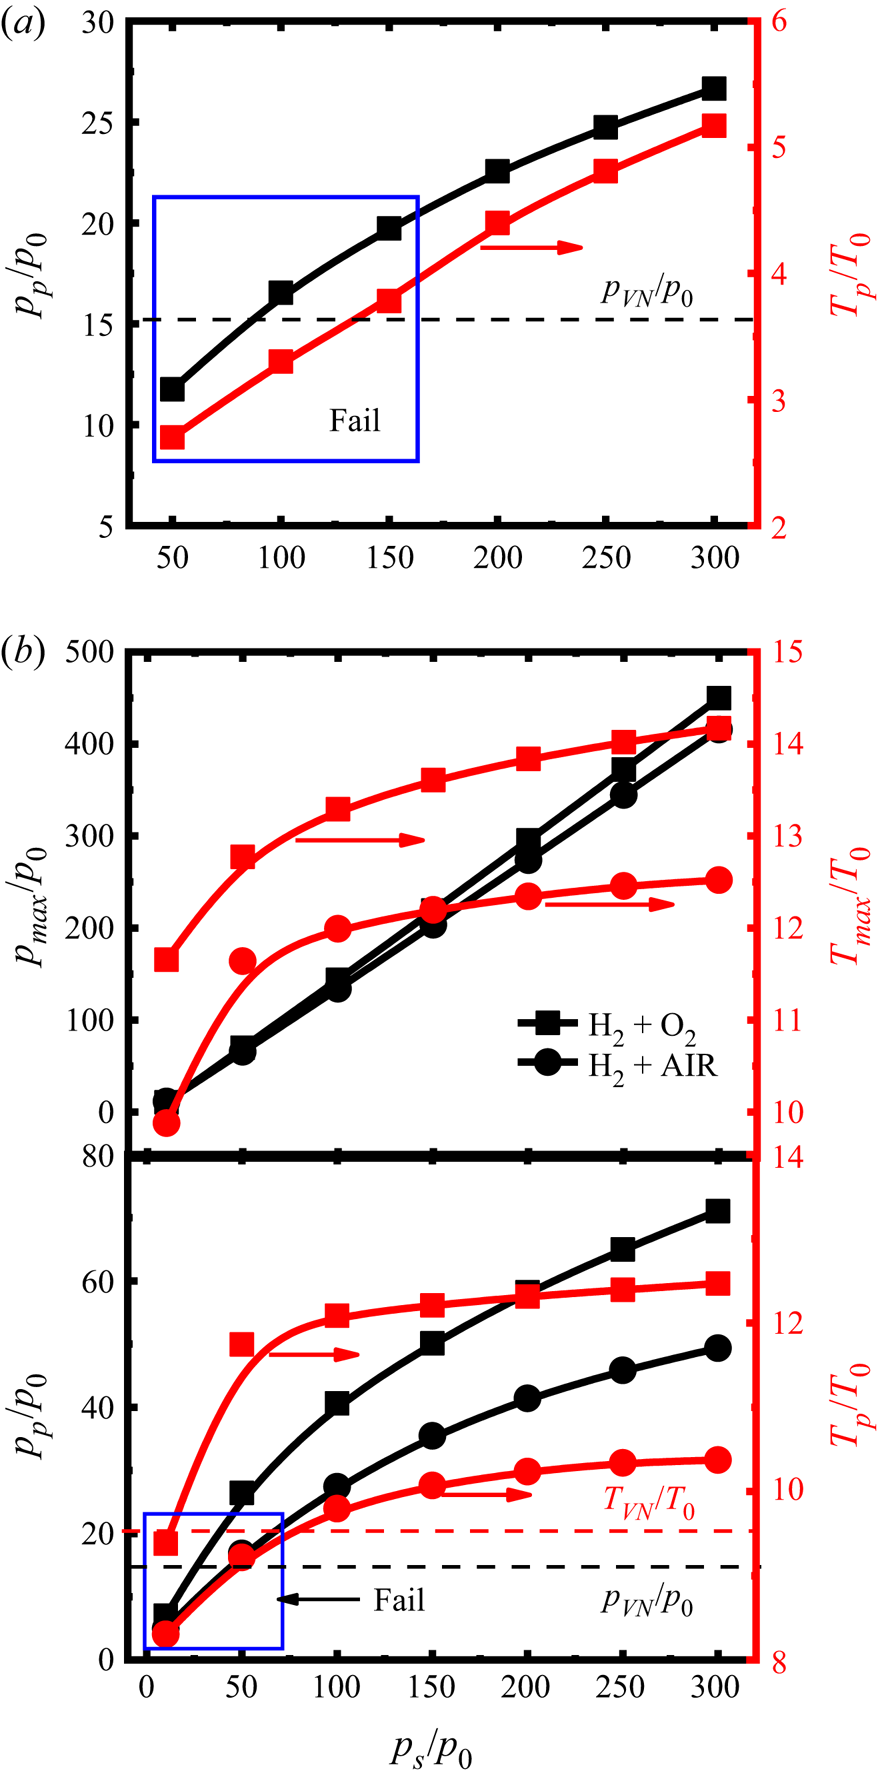
To generalize the hotspot effects, we conduct a series of simulations by changing the hotspot pressure for both non-reactive (i.e. air) and reactive (i.e. H2 + O2 and H2 + air) hotspots. Figure 15 shows the probe pressure (pp) and temperature (Tp) as functions of the hotspot pressure (ps) at the probe (R = 21 mm). Since the isochoric reactions first take place inside the spot for reactive hotspots (i.e. H2 + O2, H2 + air), we also present the maximum pressure (pmax/p 0) and temperature (Tmax/T 0) when the reactions are completed in the hotspot.
Change of pressure and temperature at the probe (R = 21 mm) with different hotspot pressures: (a) non-reactive hotspot and (b) reactive hotspot.

Generally, detonations are not initiated directly from all non-reactive hotspots regardless of their pressure; see the probe temperature in figure 15(a). When the hotspot pressure is ps = 50–300p 0, the detonation can be initiated somewhere beyond the hotspot only when ps ≥ 200p 0. Moreover, detonation initiation depends on whether the shock is strong enough to ignite the detonable mixture followed. For the studied cases, the peak probe pressure should be at least 1.5 times the von Neumann pressure for successful initiation. It is seen from figure 15(a) that the probe pressure pp increases monotonically with ps, but with a decreasing slope, whilst the probe temperature Tp increases almost linearly with ps. The detonation cannot be initiated beyond the hotspot when ps decreases to ≤150p 0. Although the probe pressure for ps =100p 0 or 150p 0 slightly exceeds the von Neumann spike, the RF is too weak and eventually the detonation initiation is not successful (marked as ‘Fail’ in figure 15a).
For the reactive hotspot cases in figure 15(b), the detonation can be directly initiated due to the significant gradient of thermochemical states at the spot vicinity under appropriate ps (i.e. ps ≥ 50p 0 for H2 + O2 hotspot and ps ≥ 100p 0 for H2 + air hotspot). No detonations can be initiated when the hotspot pressure decreases to 10p 0 for the H2 + O2 hotspots and ≤50p 0 for the H2 + air hotspots (annotated with ‘Fail’ in figure 15b). Based on the current simulations, detonation initiation by the shock beyond the reactive hotspot is not observed.
As the hotspot pressure increases, the peak hotspot pressure pmax due to the isochoric reactions increases linearly (see figure 15b). However, the peak hotspot temperature increases dramatically when ps ≤ 150p 0; beyond that, it grows slowly when the hotspot pressure further increases. This is because the chemical equilibrium moves towards the exothermic reaction direction and gradually approaches the limit. Furthermore, both probe pressure pp and temperature Tp monotonically increase with the initial pressure of the reactive hotspots, and the growth rate decreases with the hotspot pressure. This is similar to what is seen from the non-reactive hotspots in figure 15(a).
4.2. Detonation cell diverging and coalescence
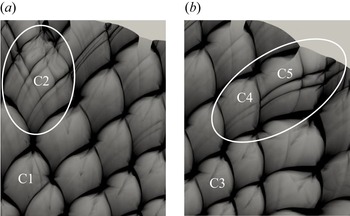
As the cellular instability increases to a certain threshold value as the detonation propagates outwardly, additional transverse waves would be generated to match the growing surface of the detonation for self-sustaining propagation (Jiang et al. Reference Jiang, Han, Wang and Zhang2009; Han et al. Reference Han, Kong, Gao and Law2017). In this section, we will discuss two patterns of cell divergence observed from case B (see figure 3b): abrupt and gradual divergence, respectively, in figures 16(a) and 16(b). In the abrupt pattern, as the cell C1 grows and develops into C2 after the next triple point is generated, the secondary peak pressure is elevated in C2, signifying the formation of new cells in it. Nonetheless, for the gradual pattern, relatively weak pressure waves are generated in C4. With the shock interaction between C4 and C5, the forgoing weak pressure becomes stronger in C5, and eventually new secondary cells are generated in C5. The growth rate of cell size from C1 to C2 is 50 %, much higher than that (9 %) from C3 to C4. This difference is responsible for various cell diverging patterns and the details will be presented in figures 17 and 18.
Detonation cell diverging in case B: (a) abrupt pattern and (b) gradual pattern.

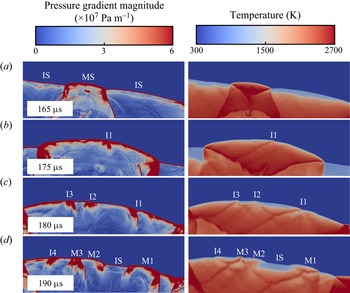
Evolution of abrupt cell divergence: pressure gradient magnitude (left column) and temperature (right column).

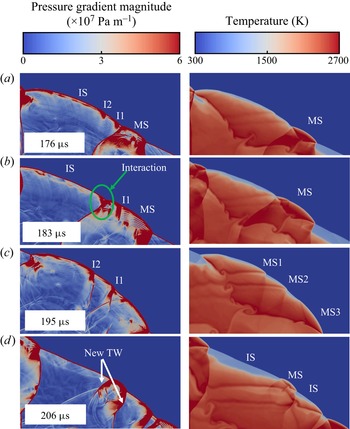
Evolution of gradual cell divergence: pressure gradient magnitude (left column) and temperature (right column).

Figure 17 shows the pressure gradient magnitude and temperature distributions during the abruptly diverging transient. The MS from the triple point is smooth initially (e.g. at 165 μs). Its velocity is higher than the adjacent ISs. As the curved MS propagates outwardly, its surface significantly increases, leading to decreasing number of cells per unit area of the detonation front. Consequently, instability 1 (I1 in figure 17b) occurs along the MS, leading to front wrinkling (Shen & Parsani Reference Shen and Parsani2017). Moreover, the temperature near I1 is higher than that of the surrounding (see 175 μs), corresponding to higher local reactivity. The shock near I1 propagates with a greater speed, causing a convex front. The transverse wave originating from I1 propagates circumferentially and interacts with IS, further intensifying I1, see 180 μs. Other instabilities, e.g. I2 and I3, appear due to the similar mechanism. As the MS decays, a thin gap is generated between the leading SF and RF, and the temperature therein is lower (see 180 μs), indicating the increased induction time. The mixtures near the instabilities are more explosive, eventually resulting in an RF. The RF then couples to the SF, and new MSs are developed, e.g. at 190 μs; MS1-3 originates from I1-3, respectively. Meanwhile, new instability I4 is generated due to increased detonation surface. The detonation front is divided into several sections, with staggered MS and IS.
Evolution of the gradually diverging pattern is detailed in figure 18. The occurrence of instabilities is like those in the abrupt pattern, but they are too weak to induce new cells when the detonation expands. Instead, the instability amplification during the interactions between two adjacent shocks plays an important role in the divergence process. In figure 18, the instabilities I1 and I2 only occur along the IS at 176 μs. As the adjacent MS expands, it collides with the neighbouring shock; I1 is obviously intensified after collision with the transverse wave of the MS; see 183 μs. This also induces the wrinkled MS. Besides, the interaction between two opposite transverse waves originating from I2 and MS, respectively, can be observed, as marked by the green circle in figure 18(b). After the instability amplification from IS to the adjacent MS, the subsequent diverging behaviour is like that from the abrupt pattern. At 195 μs, new hotspots evolve from the instability, generating new MSs. Finally, new cellular features, including MS, IS and transverse wave (TW), appear at 206 μs.
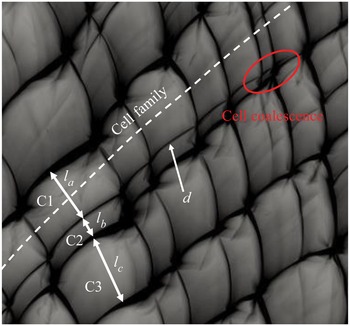
Another phenomenon worthy of discussion at the cell-growth stage is cell coalescence. In contrast to the diverging behaviours, the cell coalescence always takes place where the initial irregular cell pattern dominates, which subsequently generates larger local cells. Figure 19 shows a detailed coalescence process in case E, as demonstrated in figure 5(a). To better illustrate the underpinning mechanism, a relative cell size (i.e. cell thickness in this work) perpendicular to the cell-family direction is introduced, denoted by la–lc in figure 19. The cell thickness of C2 is only around a third of C1 or C3, giving a high instability as the detonation propagates outwardly. Furthermore, as C1 and C3 grow along the cell family, C2 further decreases until ultimate disappearance.
Distributions of the peak pressure trajectories in a cell coalescence process in figure 5(a).

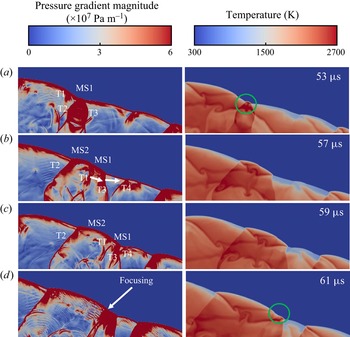
Figure 20 shows the cell coalescence transient, using the pressure gradient magnitude and temperature distributions at successive instants. At 53 μs, MS1 is generated with intense chemical reactions accompanied by two strong transverse waves, T2 and T3. Meanwhile, a relatively weak transverse wave T1 propagates towards T2. After the collision between T1 and T2, MS2 is generated near MS1, and its speed is larger than that of MS1. As such, two adjacent MSs (MS1 and MS2) form a large MS along with three TWs, among which T1 and T3 propagate in the same direction. The trajectory of T1 can be found in figure 19 (see d). As the detonation evolves, T1 gradually approaches T3. As T1 coalesces with T3 and further collides with T4 (see 59–61 μs, figure 20), a new hotspot is generated with local high reactivity (see the circled region, 61 μs), accompanied by the disappearance of T3.
Evolution of the cell coalescence in figure 19: pressure gradient magnitude (left column) and temperature (right column).

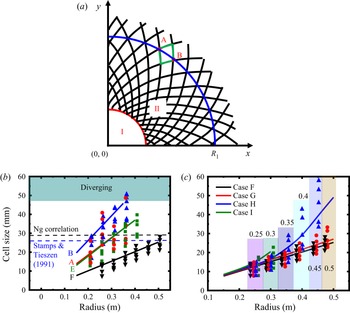
To quantify the cell variations as the detonation wave propagates outwardly, in figure 21 we show the calculated cell size from uniform and non-uniform detonable mixtures. Here, the cell size is approximated by the radial distance between A and B along the arc R 1, as shown in figure 21(a). The fitted line is plotted by the proportional relation between a certain arc and the number of cell families, as shown in figures 21(b) and 21(c). The cell-family number remains constant before diverging in cases A, B and F (see figures 3 and 5b), and decreases due to cell coalescence for cases E and G−I. (see figures 5a and 7). Consequently, the fitted lines feature constant, for cases A, B, F, and increasing slopes for cases E and G−I, see figures 21(b) and 21(c). Note that they are obtained from the cell-growth stage in all cases. The theoretical cell size with the Ng correlation (Ng et al. Reference Ng, Ju and Lee2007) and the experimental data by Stamps & Tieszen (Reference Stamps and Tieszen1991) are also presented for reference in the uniform case.
Detonation cell size for different hotspot properties: (a) schematic of cell estimation; (b) change of detonation cell size along the radial distance in cases A, B, E and F; (c) change of detonation cell size along the radial distance in cases F–I. Black dashed line: theoretical data from Ng correlation (Ng et al. Reference Ng, Ju and Lee2007). Blue dashed line: experimental data with initial pressure of 0.25 atm (Stamps & Tieszen Reference Stamps and Tieszen1991). Number above the histogram: radius of the arc where the cell samples are obtained.

Generally, the cell-growth rate decreases (hence cell-family number increases) with hotspot pressure for non-reactive hotspots A and B. This can be ascribed to higher detonation strength in case A as the cellular detonation initially forms. Besides, a lower cell-growth rate of case F can be found from figure 21(b) due to higher overdrive. For cases A, B and E, the detonation cell starts to diverge when the cell size approaches a certain value. It can be inferred from figure 21(b) that this threshold is a value greater than the corresponding theoretical and experimental cell sizes, under which condition the detonation propagates at a relatively stable state (Lee Reference Lee1984). When the cylindrical detonation expands, the collisions between adjacent transverse waves become difficult due to increased spacing. Accordingly, the cellular instability significantly increases, especially as the average cell size continuously grows beyond the characteristic cell size. This enhanced instability leads to generation of new transverse waves to sustain detonation propagation (Jiang et al. Reference Jiang, Han, Wang and Zhang2009). In the studied cases, the threshold value is 1.4–2 times the characteristic cell size under the same mixture condition. It is worth noting that a real three-dimensional detonation structure is very complex, involving irregularity and inhomogeneity of the detonation cell (Pintgen et al. Reference Pintgen, Eckett, Austin and Shepherd2003; Crane et al. Reference Crane, Lipkowicz, Shi, Wlokas, Kempf and Wang2023), which may lead to greater fluctuations of the threshold than that in the current simulations. For case F, the sizes of cell samples at various radii are closer to the fitted line due to the more uniform distribution. Furthermore, the maximum cell size is well below the corresponding theoretical and experimental values, and thus it remains at the cell-growth stage even at larger radius, see figure 5(b).
In contrast to the uniform mixture cases, only cell coalescence happens in the non-uniform cases. In these cases, the cell size dramatically increases as the ER decreases to match the increased half-reaction length, which makes the detonation more unstable. For better illustration, we put the cell samples horizontally adjacent for different cases at the same radii, as annotated by the columns in figure 21(c). Generally, the detonation cell evolutions are similar between cases F (φ = 1) and G (φ = 1 → 0.9) due to close mixture reactivities. For case H (φ: 1 → 0.5), the cell-growth rate increases considerably across 0.3 m. Meanwhile, the cell sizes become more scattered when R = 0.3–0.5 m, due to cell coalescences, see figure 7(c). For case I (φ: 1 → 0), the maximum cell size reaches approximately 22 mm at R = 0.3 m (corresponding to φ = 0.42), where the detonation extinction happens.
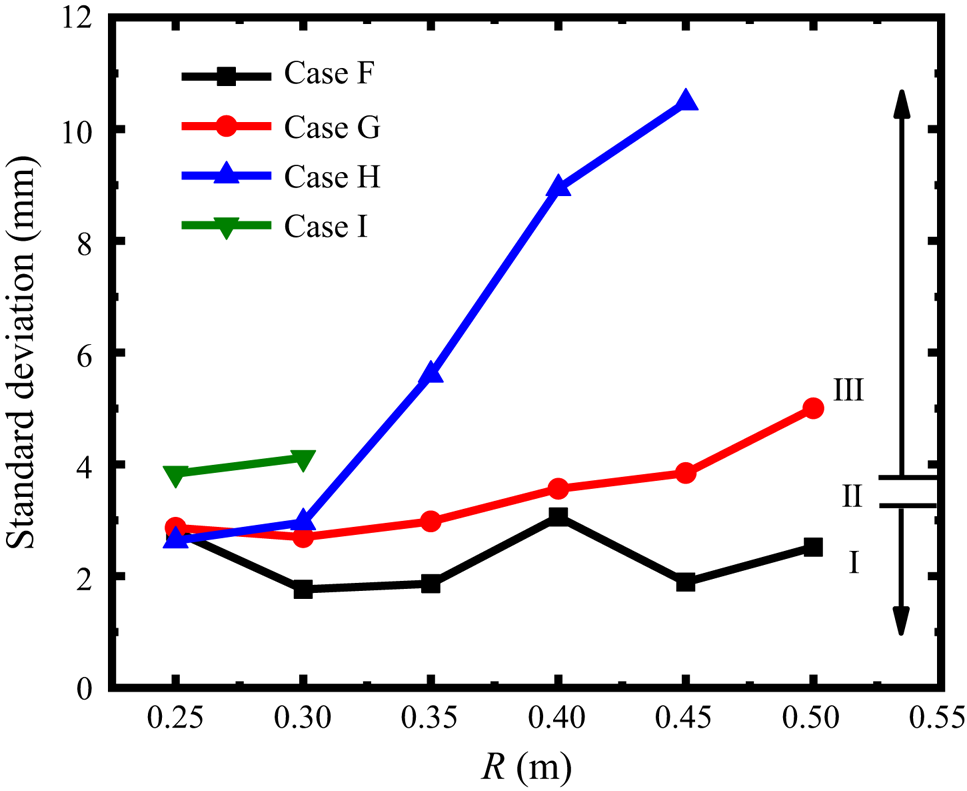
In addition, the detonation instabilities lead to the irregularity of the detonation cell for a certain mixture composition (Radulescu et al. Reference Radulescu, Sharpe, Lee, Kiyanda, Higgins and Hanson2005). Here, we quantify the instability for a mixture composition by evaluating the detonation cell irregularity (Zhao et al. Reference Zhao, Lee, Lee and Zhang2016). Since the mixture composition is uniform stoichiometric H2 + air mixtures in the hotspot property study, we examine the four mixtures with different ER gradients, i.e. 1 → 1 (case F: uniform), 1 → 0.9 (case G: weak decrease), 1 → 0.5 (case H: middle decrease) and 1 → 0 (case I: sharp decrease), which covers all the mixture compositions used in this work.
Figure 22 compares the standard deviation (SD) of the cell size at different radii (thus different ER) in cases F–I. Note that lack of data in case I and H is due to the localized detonation extinction. According to the categorization of mixture stability (Zhao et al. Reference Zhao, Lee, Lee and Zhang2016), a mixture is considered stable if SD falls in 1.7–3.3 (region I) and unstable if SD exceeds 3.7 (region III), between them, weakly unstable mixtures exist (region II). Generally, the SD in case F (uniform) shows an obviously stable behaviour. Instability increases as the ER decreases, see cases G–I. The mixture remains stable or weakly unstable from ER = 1–0.91 (corresponding to R = 0.02–0.45 m in case G). Once the SD approaches the upper limit of weakly unstable state, a sharp rise appears due to a much larger variation of shock-induced ignition delays (Gamezo et al. Reference Gamezo, Vasiliev, Khokhlov and Oran2000), as shown in cases G (R = 0.45–0.5 m) and H (R = 0.3–0.45 m), indicating a dramatic increase of the mixture instability.
The SD of the cell size at different radii in cases F−I. Region I: stable; II: weakly unstable; III: unstable.

4.3. Hydrodynamic structure
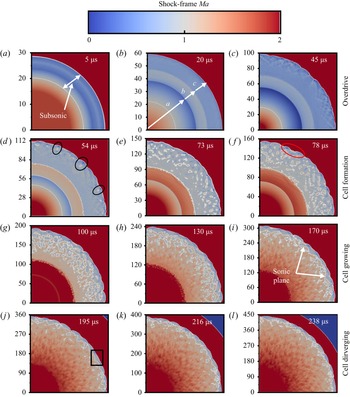
We will further discuss the hydrodynamic thickness variations in expanding cylindrical detonations. The hydrodynamic thickness is the distance between the sonic plane and the SF (Lee & Radulescu Reference Lee and Radulescu2005). In case B, a self-sustaining diverging detonation is generated. Figure 23 shows the time sequence of shock-frame Mach number in this case. They are from four stages, i.e. overdrive (5–45 μs), cell formation (54–78 μs), growth (100–170 μs) and divergence stages (195–238 μs).
Changes of shock-frame Mach number in case B. Axis label in millimetres. White line: Ma = 1 isolines.

At 5 μs, an overdriven detonation propagates outwardly from the hotspot, and behind it a sub-sonic region exists. This subsonic region is further elongated radially at 20–45 μs, which makes the detonation more susceptible to rarefaction effects from its behind. At 20 μs, the flow field behind the detonation is separated into three regions, marked by a, b and c. Specifically, in region a, the dissipation of the hotspot happens, and the gradually reduced Mach number Ma is ascribed to the increasing flow speed. Regions b and c are the burned zones of the deflagration and detonation, respectively. All three regions increase as the detonation expands. Consequently, the transverse disturbance, which is intensified by the curvature, renders the detonation cellularized at 45 μs (Han et al. Reference Han, Kong, Gao and Law2017).
At 54 μs, the detonation cellularization becomes more pronounced, accompanied by some scattered supersonic pockets behind the detonation wave. The effect of the expansion waves on the detonation front varies at different circumferential positions. Since the expansion waves cannot penetrate the supersonic pocket to attenuate the detonation (Weber & Olivier Reference Weber and Olivier2003), the local detonation fronts ahead of the supersonic pockets show higher speed, as shown in the circled regions. Meanwhile, there is an increased Mach number behind the leading shock due to the decreased flow speed at 54–78 μs. Especially, a supersonic ring is generated from the subsonic region b with two extra sonic lines. At 78 μs, more small supersonic zones are generated behind the detonation front, indicating the enhancement of the hydrodynamic fluctuations. This fluctuation applied to the expansion wave further influences the local detonation intensity, and eventually promotes the formation of the triple-point structure of the detonation front; see the red circles at 78 μs.
At the cell-growth stage (100–170 μs), the localized supersonic pockets gradually coalesce with each other, and are extended to the entire subsonic zone. At 170 μs, a relatively clear sonic region appears immediately behind the SF. Furthermore, the hydrodynamic thickness becomes constant over time, indicating the formation of the freely propagating cylindrical detonation. It is reported in Radulescu et al. (Reference Radulescu, Sharpe, Law and Lee2007) that the mechanical and thermal fluctuations decay from a large magnitude (6 %–10 %) close to the SF to a negligible intensity (0.5 %–1 %) at the sonic surface. Therefore, the disturbance behind the sonic plane has little effects on the detonation front, and the detonation evolution is only governed by the available energy release and product expansion between the sonic plane and leading shock (Lee & Radulescu Reference Lee and Radulescu2005).
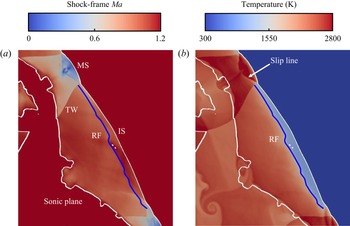
At the cell divergence stage (195–238 μs), the subsonic zone only appears between the leading shock and sonic plane as a ‘sawtooth’ pattern. This is due to the combined effects of transverse wave, IS and MS (Radulescu et al. Reference Radulescu, Sharpe, Law and Lee2007). Figures 24(a) and 24(b) shows the enlarged Mach number contour (the Ma range adjusted to 0–1.2) and the temperature distribution from the box in figure 23( j). In the subsonic zone, the Mach number is nearly constant behind the IS, except for the induction zone where the Mach number is higher due to lower temperature, as shown in figure 24(b). However, behind the MS, the Mach number increases towards the sonic plane. This is because rapid reactions take place immediately after the MS, which dramatically raises the local temperature and flow speed. A distinct Ma discontinuity exists at the interface of post-MS and post-IS products due to the transverse waves. Owning to the different expansions of post-MS and post-IS products, the sonic plane is convex behind the MS, and concave behind the IS, which leads to the ‘sawtooth’ pattern of the sonic plane.
Contours of (a) shock-frame Mach number and (b) temperature from the box in figure 23( j). White line: Ma = 1. Blue line: RF.

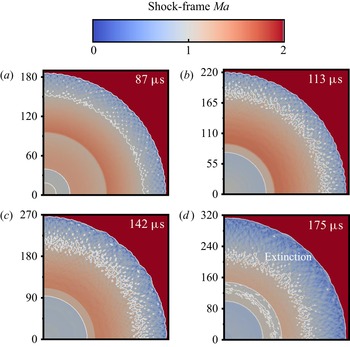
Figure 25 shows the time sequence of the Mach number in case I, in which the detonation is ultimately quenched as the equivalence ratio approaches zero. Overall, the shock Mach number gradually decreases when it runs outwardly. At 87 μs, an overdriven detonation with small cells is generated. As a result, the subsonic region behind the leading shock is relatively long (approximately 30 mm). From 113 to 142 μs, plenty of supersonic pockets occur in the subsonic region just like 73–78 μs in figure 23. However, generation and coalescence of the supersonic spot do not make the subsonic region shrink; instead, the subsonic region is further elongated due to the weakened shock intensity at 142 μs. Further downstream the detonation decays to an inert shock with relatively smooth front at 175 μs.
Changes of shock-frame Mach number with time in case I. Axis label in millimetres. White line: Ma = 1 isolines.

5. Conclusions
Two-dimensional cylindrical detonation direct initiations in hydrogen/air mixtures are computationally studied. The effects of hotspot property and mixture composition gradient on detonation initiation are investigated. The main conclusions are summarized as below.
(i) For non-reactive hotspots, initiation fails for low hotspot pressure (ps = 100p 0 or 150p 0) and the critical regime dominates for high hotspot pressure (ps = 200p 0 or 250p 0), in which three stages, i.e. no cell, growing cell and diverging cell, occur successively. Supercritical regime dominates for both reactive hotspots (H2 + O2 or H2 + air, ps = 100p 0). Detonation is directly initiated from the reactive hotspot, whilst it is initiated somewhere beyond the non-reactive hotspot through the coupling of the leading shock and RF.
(ii) The detonation cell size increases almost linearly with the radius at the cell-growth stage, which implies that the cell-family number of the cellular detonation determines the growth rate of cell size in a cylindrical detonation. Furthermore, cell divergence only occurs when the local cell size exceeds the characteristic cell size of a certain value.
(iii) Two cell diverging patterns are identified, i.e. abrupt and gradual patterns. The abrupt divergence is attributed to the generation and intensification of the instability as the cell grows, whilst the gradual divergence is mainly caused by the instability amplification during the interactions between two adjacent shocks. Besides, the cell coalescence occurs if many irregular cells initially form and the cell with smaller cell thickness merges with the bigger one as the detonation expands. As such, the cell-family number is reduced and the local cells grow faster, which leads to an earlier divergence behaviour.
(iv) As the mixture ER decreases linearly from unity at the hotspot vicinity to a certain value at R = 0.5 m, the detonation experiences self-sustained propagation, highly unstable propagation (with local extinction) and global extinction with ER: 1 → 0.9, 1 → 0.5 and 1 → 0, respectively. In particular, highly unstable detonation arises from multiple cell coalescences, and detonation extinction occurs where the induction time is highly lengthened and unburned pockets occur.
(v) Hydrodynamic structure analysis is also conducted for both uniform and non-uniform mixtures. For a self-sustaining detonation case (air hotspot, ps = 200p 0), the hydrodynamic thickness first increases at the overdrive stage, then decreases as the detonation cells are generated and eventually reaches almost a constant at the cell divergence stage in which the sonic plane exhibits a ‘sawtooth’ pattern. This is ascribed to the different expansions of post-MS and post-IS products. For the detonation extinction case (φ: 1 → 0), the hydrodynamic thickness continuously increases from the overdriven state to extinction and no ‘sawtooth’ sonic plane occurs since no self-sustaining detonation is generated.
Supplementary material
Supplementary materials are available at https://doi.org/10.1017/jfm.2023.512.
Acknowledgements
This work used the computational resources of the National Supercomputing Centre, Singapore (https://www.nscc.sg/).
Funding
X.J. is supported by The China Scholarship Council.
Declaration of interests
The authors report no conflict of interest.