Implications
The permanent front teeth in cattle develop in a sequential order. Historically, this developmental pattern has provided a recognised means of estimating age for agricultural and food safety purposes. For this study, information was obtained from a substantial database of abattoir records and analysed in a powerful new way to provide a tool for estimating age, and to give a more detailed and comprehensive explanation of the relationship between the stage of permanent tooth development and age, sex and breed in the study animals. The differences between the major dairy and beef breeds and between native and continental beef breeds farmed in Britain are also demonstrated.
Introduction
Examining the teeth of cattle as a means of estimating age is an established procedure that has been in use for many centuries. It has been used for supporting age for sale, eligibility for show classes, eligibility for subsidy payment and most recently as a means of supporting documented age for bovine spongiform encephalopathy controls in abattoirs when the restriction on processing cattle over 30 months of age for human consumption was in place.
The most commonly used and documented method of determining age is by studying the development of the anterior teeth, which comprise three pairs of incisors and one pair of canines. These are present in the lower jaw only, the opposing surface of the upper jaw being formed by a keratinised dental pad. Anatomically, the canine teeth are indistinguishable from the incisors, and thus are generally referred to as the fourth pair of incisors. Collectively, these teeth are often referred to as the permanent anterior (PA) teeth. A set of eight deciduous anterior teeth are present soon after birth of the calf and these are replaced by the PA teeth, which emerge from the centre outwards in chronological order. The order of emergence is the centrals (first pair), followed by the medials (second pair), laterals (third pair) and finally the corners (fourth pair). Mean ages for emergence of each pair have been published by a number of authors and are summarized in a paper by Lawrence et al. (Reference Lawrence, Whatley, Montgomery and Perino2001). Andrews (Reference Andrews1975) in a large cross-sectional study found the mean ages to be ∼22.5 months for the first pair, 27.5 months for the second, 37 months for the third and 44 months for the fourth. A number of previous studies have also looked at the effect of breed and sex on anterior tooth development with variable results, these studies being carried out on the most common breeds in use at the time, mainly Friesian, Ayrshire, Jersey, Aberdeen Angus, Hereford and Dairy Shorthorn.
Changes have taken place in cattle farming within the United Kingdom over the last 30 years. These include the establishment of the popular continental beef breeds such as the Charolais, Simmental and Limousin, the widespread use of Holstein breeding in dairy units, and changes in feeding and management systems with intensification in both the beef and dairy industry. Yet no further large-scale studies have been carried out into the relationship between age and stage of PA tooth development during this period.
The current study aimed to address this by analysing records of PA tooth development with age in a large population of British cattle representative of current breeds and farming systems across a wide geographical area. The effects of sex and breed, and their interaction, on the age of tooth development were also assessed.
The study involved a cross-sectional method and employed an ordered category response statistical model to analyse a large set of data gathered from animals slaughtered over a 1-year period from 2007 to 2008. The relationship between stage of PA tooth development (i.e. the number of PA teeth present) and age was studied and the data set tested also for any differential effect between the sexes. Commonly represented breeds, registered as pure-breds, were further sub-classified and the model used to study the comparative age, breed and sex inter-relationships on stage of tooth development between dairy breeds and beef breeds and also to compare native beef breeds with continental beef breeds.
Material and methods
Data collection
Data were collected from cattle slaughtered at a large commercial abattoir in South West England. As the majority of cattle slaughtered commercially were under 3 years of age, it was necessary to use a very large data set across the period from June 2007 to July 2008 to provide a sufficiently large number of animals to represent the later stages of dentition for statistical analysis. Approximately 63 000 records were analysed for cattle ranging in age from 1 to 12 years. The registered identity, date of birth, breed and sex of each animal was routinely scanned from the official passport onto the abattoir database (Hellenic systems) on arrival in the lairage and a unique kill number for each animal on the day allocated after reconciling the ear tag and passport details. Official passports are issued following the legal requirement for registration within 1 month of birth and as such should have a high degree of reliability.
Following slaughter, each animal was examined by experienced meat hygiene service (MHS) technicians for the number of PA teeth present and to verify the ear tag identity with the passport. These details were recorded manually on an MHS record sheet (AID 5/1). Note that the presence of an individual tooth or pair could include any degree of tooth growth from emergence to being fully developed and in wear. Records for the study period were copied from the abattoir database onto CD and a commercial data entry company (Data Image, Banwell) engaged to transfer the dentition details from the manual records onto the original database created from the scanned passports. The data entry was checked and validated by reference to both the ear tag and kill number/kill date sequence.
Data analyses
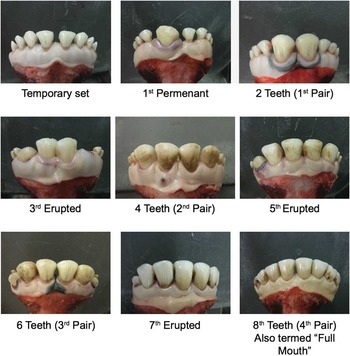
The teeth emerge in sequence in four pairs but slightly led by one of the pair, thus animals can have 0 (no teeth emerged) increasing in increments of 1, to 8 (all four pairs present). Figure 1 shows examples of each dentition stage from 0 to 8.
Photographs of defleshed lower jaws demonstrating the dentition stages in maturing cattle.

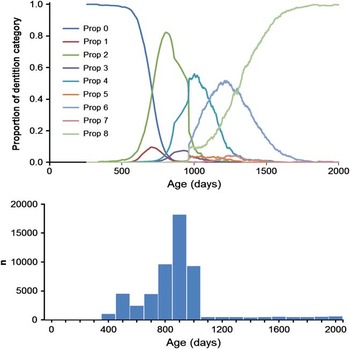
The number of animals slaughtered commercially falls away dramatically after about 1000 days of age, creating a ‘truncated’ effect in the data. There was also a very specific age period at which young bulls were slaughtered, which added to the uneven distribution of the data. The study data could not, therefore, be considered a random sample of ages from a ‘natural’ population (see also the histogram as part of Figure 2, described below). Thus, the approach adopted by previous studies to investigate the relationship between dentition stage and age, assuming a random sample from a ‘natural’ population, could not be adopted here. Previous studies have reported mean ages and ranges for each dentition stage (Andrews, Reference Andrews1975; Brooks and Hodges, Reference Brooks and Hodges1979; Weiner and Forster, Reference Weiner and Forster1982). In the present study, the relationship between dentition stage and age was investigated using an ordered category response model as implemented within the statistics program MLwiN 2.24 (Rasbash et al., Reference Rasbash, Browne, Healy, Cameron and Charlton2010). The data are also presented graphically. To overcome the problem of the uneven distribution of ages, figures were produced by binning the data by age, to the nearest day, and then calculating the proportion of cattle of each dentition stage present in each bin. As the data become sparse at the level of day at certain ages, a kernel smoothing technique was used to help smooth the data.
The upper graph shows the proportion of cattle within each of the nine dentition stage categories present within the data at ages below 2000 days. The figure is based upon the full data set (n = 63 298) and points on the x-axis are accurate to 1 day, with a uniform kernel smooth of ±50 days about each day. The lower graph shows a histogram of the age distribution of cattle from the total data set, but truncated at 2000 days of age (truncated n = 54 527), with x-axis matched against the upper graph to show the data density contributing to the estimates above.

Eighteen animal records were excluded from the analyses as being obviously misreported. For the formal statistical analysis, only the paired dentition stages were retained (0, 2, 4, 6 and 8) as the numbers of animals within each of the intermediate stages (1, 3, 5 and 7) were relatively low. These intermediate stages are included on the graphical representations as they were of value in comparing with emergence ages in previous studies because of the short lead time before the second of the corresponding pair emerge. The complete data set was analysed using the ordered category response model to produce two models, one to give an overall estimate of the relationship between age and stage of dentition, regardless of sex (Model 1), and a further model to estimate the relationship between age and sex and stage of dentition (Model 2). The ordered category response models produce a series of logistic regression equations, which identify the probability of membership of one dentition category or the next. By solving each equation for the age at which there is a probability of transition of P = 0.5, age bands were produced delineating which dentition stage was most likely to be present within each band. A probability of 0.5 was chosen as the ‘natural’ transition point as it is the point at which there is an equal probability of being within either category.
Four further ordered category response models were produced using a reduced data set containing only the pure-bred animals (excluding cross breeds), with associated tables of ages of transitions, to investigate the relationship between dentition and type of animal (dairy/beef), age and sex (Model 3); beef breed, age and sex (Model 4); dairy breed, age and sex (Model 5); and origin of beef animal (native/continental), age and sex (Model 6). For the analysis by dairy breeds, all types of Friesian and Holstein animals were considered as a single category. When fitting models all main effects and both higher order polynomial terms for age and all possible interactions were tested and only included if significant (Wald test).
Results
The cleaned data set consisted of 63 298 records of individual animals. After removal of the animals with dentition stages 1, 3, 5 and 7, this was reduced to 59 967. The upper graph in Figure 2 shows a summary for the whole data set of the proportion of cattle within each of the nine dentition stage categories at any age, in days, within the range of 0 to 2000 days. It is clear from the graph that the intermediate stages (1, 3, 5 and 7) were relatively transitory and as such, relatively few animals in the intermediate stages were identified. The occurrence of later stages were spread out over longer periods of time than the earlier stages, and it can also be seen that the emergence of the first permanent teeth takes place only after at least 500 days and that by ∼1800 days all cattle presented with dentition stage 8. The lower graph in Figure 2 shows the age distribution of this data set trimmed to include only animals <2000 days of age and matched to the x-axis of the graph above. The discrepancy between the number of animals slaughtered over and under 30-month (912 days) old is apparent.
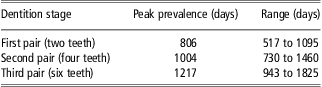
Table 1 presents the age at which the first, second and third pairs of PA teeth were most prevalent (the analysis is limited to these stages as there is no stage to precede 0 and no stage to follow 8). These values are estimated from a simple inspection of Figure 2.
The apparent age at peak prevalence of each stage of paired teeth in the data set as a whole together with the range of age in which each dentition stage was found
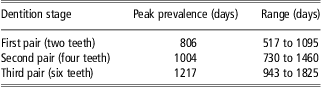
Estimates are simply by inspection of Figure 2.
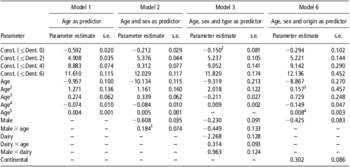
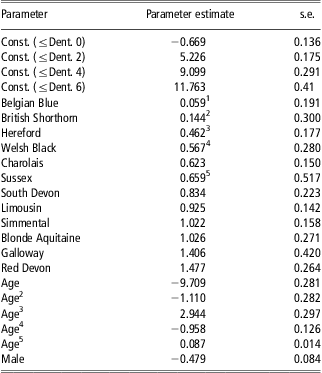
The parameter estimates and standard errors from the ordered category response models of the complete data set are shown in Table 2 as Models 1 and 2. Note that the unit of age used in models is years and that the variable ‘age’ has been centred about 2 years of age. This was necessary to allow the statistical software to work with reasonably scaled numbers, and it means that the parameter estimates for age should be read in terms of an offset from 2 years of age. The statistical significance of each term can be calculated by dividing the parameter estimate by its standard error and referring the result to a table of Z-scores. Thus, approximately, if the quotient is >2 then P-value will be <0.05. It can be seen from Model 1 in Table 2 that age was fitted as a quintic function and that in Model 2, again based upon the total data set, with both age and sex as predictors, there was a significant difference between sexes in the age at which the dentition stages progressed.
The parameter estimates from the ordered category response models 1, 2, 3 and 6

All estimates are statistically significant (P < 0.005) except where indicated by superscript.
Models 1 and 2 – the parameter estimates from the two ordered category response models, which used the entire data set of animals to predict transitions between dentition stages 0, 2, 4, 6 and 8 (n = 59 967). Model 1 used age alone as a predictor. Model 2 used both age and sex as predictors.
Model 3 – the parameter estimates from Model 3 in which the data are reduced to pure-breeds only (n = 22 984), showing significant two-way interaction effects between type of animal (dairy/beef), sex and age on dentition stage transitions.
Model 6 – the parameter estimates of Model 6, in which the data are reduced to pure beef breeds (n = 5052), demonstrating sex, age and origin (native/continental) differences in the transition between dentition stages. The sex × origin interaction was not significant and so was not included in the final model.
Note that age estimates in all models are scaled as years and are centred about 2 years of age.
1P = 0.013, 2P = 0.064, 3P = 0.731, 4P = 0.008.
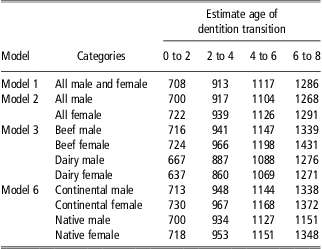
In Table 3, Model 1, the predicted ages in days at which the probability of transition from one stage to the next was equal to 0.5 are identified. By reference to Figure 2, this may be seen as approximately where the two lines for a dentition stage intersect. It can be seen from Table 3, Model 2 that, overall, teeth emerged earlier in the males than females and that this difference was approximately constant across all the dentition stages.
The estimates from Models 1, 2, 3 and 6 of the cross-over points of age, in days, of equal probability of membership of consecutive even numbered dentition categories
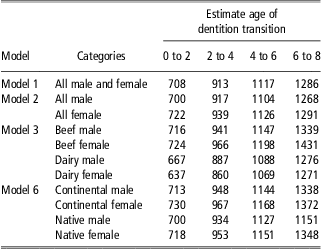
The difference between males and females at transition from Table 3, Model 2 is 22 days for zero to two teeth, 22 days for two to four teeth, 22 days for four to six teeth and 23 days for six to eight teeth.
The data were then reduced to pure breeds of dentition stages 0, 2, 4, 6 and 8 only and an ordered category response model fitted to test for a difference between dairy and beef-type animals and between the sexes. This data set comprised records for 17 755 dairy-type animals and 5229 beef-type animals. The parameter estimates from the model are shown in Table 2 as Model 3. In this model, age was fitted as up to a quartic term. As earlier, and now throughout all models below, ‘age’ was scaled in years and centred about 2 years of age. It can be seen from Table 2, Model 3 that there were significant differences between the types of cattle and sex and that all sex, type, age, two-way interactions are included in the model. Table 3, Model 3 identifies the predicted age in days at which the probability of transition from one stage to another was equal to 0.5, and it can be seen that dairy-type cattle moved through the dentition stages at a younger age than beef-type and that beef-type males’ dentition progressed more quickly than females. However, in the dairy-type cattle, the females progressed more rapidly than the males, but there was a trend for the difference between the sexes to diminish with increasing dentition stage. The raw data for male and female animals of both types are shown graphically in Supplementary Figures S1(beef) and S2 (dairy) together with histograms illustrating the density of the data for each sex/type up to 2000 days of age. The histograms in Supplementary Figure S1 demonstrates the dramatic reduction in sample size for beef animals of over 30 months of age and the histograms in Supplementary Figure S2 shows the paucity in numbers of dairy female animals under 800 days of age and the reduced sample size for dairy males of over 30 months of age.
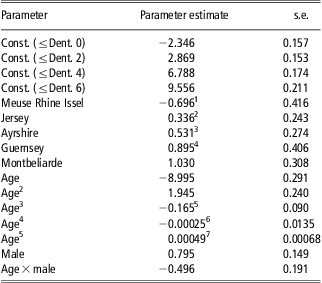
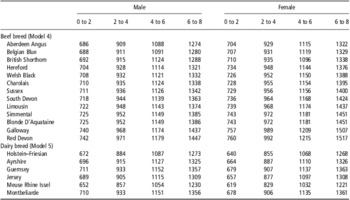
The data set of pure breeds with dentition stages 0, 2, 4, 6 and 8 was split by type of animal, beef or dairy, and these two data sets analysed separately. An ordered category response model was fitted to each to investigate the effects of age, sex and breed. Only pure-bred animals were considered. The parameter estimates from the model for the beef pure breeds (Model 4) are shown in Table 4 and for the dairy pure breeds (Model 5) in Table 5. The model in Table 4 used Aberdeen Angus as the base breed (i.e. the model parameters without any other breed fitted is for Aberdeen Angus) and the model in Table 5 used Friesian/Holstein Friesian as the base breed. Note that the significances of the parameter estimates indicate that some breeds were not significantly different from the base breeds or some other breeds. In the model of beef breeds, age was fitted as a quintic term and sex and breed as only main effects. In the dairy breed model, age was fitted as a quintic term, with a higher order interaction term of sex × age, but no interaction terms involving breed. Note that a quintic term was not significant, however, it was fitted to conform with the preceding models. Table 6 identifies the age in days at which the probability of transition from one stage to the next was equal to 0.5 for either sex of the beef breeds and the dairy breeds. As in the model of cattle type by sex (Model 3), Table 6 shows that within breeds, generally, dairy-type cattle moved through the dentition stages at a younger age than beef-type and that beef-type males’ dentition progressed more quickly than females. Again, the model showed that dairy-type females progressed more rapidly than the males, but that as dentition stage increased this difference diminished. For the transition from dentition stage 6 to 8 for the dairy breeds some of the breed estimates appear to show the order of the sexes reversed. However, this is probably simply due to the reduced size of the data set for the higher dentition stages.
The parameter estimates from the ordered category response Model 4
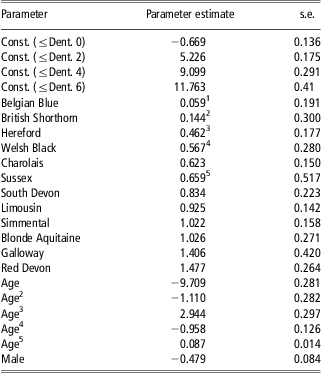
All estimates are statistically significant (P < 0.005) except where indicated by superscript.
The data are reduced to pure beef breeds of under 3000 days of age (n = 4974), demonstrating age, sex and breed differences in the predicted age of transition between the dentition stages.
The base breed, associated with the constant in the model, is Aberdeen Angus.
1P = 0.757, 2P = 0.631, 3P = 0.009, 4P = 0.043, 5P = 0.202.
The parameter estimates from Model 5
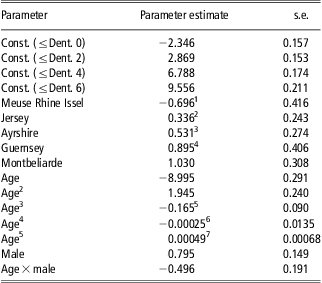
All estimates are statistically significant (P < 0.005) except where indicated by superscript.
The data are reduced to pure dairy breeds (n = 17 755), demonstrating age, sex and breed differences and an age by sex interaction in the predicted age of transition between the dentition stages. Non-significant higher order terms for age have been retained for conformity with the other models.
The base breed, associated with the constant in the model, is Holstein Friesian.
1P = 0.094, 2P = 0.167, 3P = 0.053, 4P = 0.028, 5P = 0.067, 6P = 0.985, 7P = 0.471.
The estimates from Models 4 and 5 of the cross-over points of age, in days, of equal probability of membership of consecutive even numbered dentition categories

Lastly, an ordered category response model was fitted to the data set of pure beef breeds of dentition stages 0, 2, 4, 6 and 8 to investigate any overall differences between the native beef breeds (Aberdeen Angus, British Shorthorn, Galloway, Hereford, Red Devon, South Devon, Sussex and Welsh Black) and the continental breeds (Belgian Blue, Blonde d'Aquitaine, Charolais, Limousin and Simmental). The parameter estimates from this model (Model 6) are presented in Table 2 and it can be seen that there was a significant difference in the age of progression of dentition between the beef breeds of different origin. Table 3 identifies the age in days at which the probability of transition from one dentition stage to the next was equal to 0.5 for either sex of the native beef and continental beef breeds (Model 6). It can be seen from Table 3 that the males of either origin progressed more rapidly through the stages than females and that the native beef breeds progressed more rapidly than the continental breeds.
Discussion
The data from the animals presented for analysis in this study are likely to be representative of many large UK abattoirs slaughtering both ‘under 30 month’ and ‘over 30 month’ cattle during the period when brain stem testing of all cattle over 30 months (912 days) was in place and it also reflects the differential in type and sex of animals slaughtered across the age range. The development of certain stages of dentition, particularly the second and third pair of PA teeth can be seen to fall mainly within the age range of 30 to 48 months (912 to 1460 days), the period after which the majority of animals reared as fat stock have been sent for slaughter and before the majority of breeding animals from both beef and dairy herds are culled. This has been a constraint in previous studies where analysis of sex and breed interaction has been limited to the first stage of dental development or to relatively few animals presented at the four and six tooth stage. The large data set available and range of breeds presented in this study has enabled a more extensive analysis to be undertaken beyond the early stages of development despite the obvious truncation effect occurring between 30 and 36 months.
The nature and purpose of the current study required that the cross-sectional method was used, whereby each animal is examined on only one occasion. The longitudinal method, which involves examining the same group or groups of animals on a regular basis over a period of time, has also been used (Brooks and Hodges, Reference Brooks and Hodges1979; Weiner and Forster, Reference Weiner and Forster1982). However, a study by Andrews (Reference Andrews1974) comparing both methods in Friesian cattle found no statistical difference in the relationship between age and anterior tooth development when using either method.
It is acknowledged that the data will inevitably include a proportion of animals whose registered date of birth is significantly different from their actual age. One reason found during official eligibility checks at the abattoir was an element of fraudulent misidentification, possibly due in part to the price differential between ‘under 30 month’ and ‘over 30 month’ animals, which was in place at the time of the study and this effect is a potential cause of the unusual ‘bump’ seen in the curve for the proportion of animals in dentition stages 6 and 8 at around 30 months of age (Figure 2). Registration errors could be expected to be less likely to be seen in pure-bred than in crossbred animals because of breed society registration requirements at birth, a view supported by the more normal shape of curves for six and eight tooth stages seen on the graphs in Supplementary Figures S1 and S2. An initial analysis of the data for eight tooth animals occurring under 36 months of age showed some block presentations and numbers regressing rather than progressing between 30 and 36 months, further suggesting misrepresentation as the cause of the unexpectedly early appearance of this stage. However, as the proportion of these animals was relatively small, the data were not pared other than the exclusion of a small number of very obviously erroneous recordings.
The results of the study underpin previous work in demonstrating a number of factors that occur during development of the PA teeth in the bovine. The orderly sequence of development is illustrated in Figure 2 as is the relatively short time that the intermediate stages (1, 3, 5, 7) are present before emergence of the second of the respective pairs thus accounting for the low numbers of intermediates recorded. There is considerable overlap of age at which each stage is presented and an increase in the age range as successive pairs develop, which is in agreement with previous authors (Andrews, Reference Andrews1975; Weiner and Forster, Reference Weiner and Forster1982). The age range from emergence of the first pair to full development of the fourth pair (also known as a full mouth) is shown as 500 to 1800 days, which is also consistent with previous studies (Andrews, Reference Andrews1974; Andrews, Reference Andrews1975; Brooks and Hodges, Reference Brooks and Hodges1979; Graham and Price, Reference Graham and Price1982).
The period between the first and second of a pair emerging has been cited as ∼2 to 3 weeks (Brooks and Hodges, Reference Brooks and Hodges1979) and the period from first emergence from the gum to full tooth development up to 6 weeks (Weiner and Forster, Reference Weiner and Forster1982) so that generally the second of the pair will be present by the time the corresponding intermediate is half up. Although the recording system did not differentiate between stages of emergence, this narrow timeframe in which the intermediates are present does provide a point for comparison. The peak incidence for first and third teeth can be seen in Figure 2 as ∼700 days (23 months) and 915 days (30 months), respectively, which suggests that emergence of the corresponding pair is occurring at similar ages to that found by Brooks and Hodges (Reference Brooks and Hodges1979) and Weiner and Forster (Reference Weiner and Forster1982), and later than that found by Andrews (Reference Andrews1975). The peaks for the fifth and seventh teeth are more difficult to interpret given the relatively small numbers and much wider range. The approximate age range for presence of each pair shows two teeth as 500 to 1100 days; four teeth as 750 to 1460 days; and six teeth as 930 to 1800 days. The interval between emergence of each pair has been previously shown to be ∼6 to7 months (Andrews, Reference Andrews1975; Weiner and Forster, Reference Weiner and Forster1982), so that following full development of a pair there will be a period of several months before the appearance of the next pair. In this study, the peak incidence for the presence of two, four and six teeth (including all stages from emergence to being in wear) is shown as ∼800 days (26.5 months); 1000 days (33 months) and 1215 days (40 months), respectively. Values for two, four and six teeth only are shown as there is no minimum for zero teeth and no maximum for eight teeth.
The second model, testing whether there was an influence of sex on the age at which tooth development occurred across the whole data set, showed a significant effect at all stages of development. The finding that, overall, males develop the first pair earlier than females is in agreement with Andrews and Wedderburn (Reference Andrews and Wedderburn1977) and shows that the sex effect, although small (∼22 days) is present throughout the period of anterior tooth development. The further analysis in which only those animals registered as pure-bred were included, to study breed effect, showed that this trend was consistent for all beef breeds represented. Interestingly, in contrast to beef animals, dairy females matured before dairy males. However, the magnitude of the difference between dairy females and males diminished at the later stages. This reverse trend in the dairy-type is masked in the larger data set. If this reversal of sex differences is real, we hypothesise that it may be a result of a focus on selection of female traits within dairy breeds and a focus on male traits within beef breeds.
For the analysis of breeds and types, only animals registered as pure-bred were included. Although this significantly reduced the data set, it was necessary in order to eliminate, as far as possible, interaction effects as a result of mixed breeding and to enable breeds to be reasonably reliably categorised into those likely to be reared under more traditional suckler (late weaning) beef systems and those under early weaning, group fed dairy systems. The histograms in Supplementary Figures S1 and S2, showing the data distribution by age for the subset categories, illustrate the relatively small numbers of pure-bred beef animals, both male and female, and pure-bred dairy males occurring soon after the 30-month stage, while the number of dairy females increases, represented by the progressively increasing numbers of dairy cows culled after this age. There is a spike in the numbers of dairy males at around 500 days representing a specific market for bull beef at this age.
For the breed comparison, the statistical modelling required a reference beef and dairy breed. Aberdeen Angus and Friesian, respectively, were chosen as representative of traditional breeds. There was little difference found in the initial statistical analysis between animals registered as British Friesian and Holstein/Holstein Friesian, and as there is also likely to be considerable cross-registration between these, it was considered valid to group these together.
Previous studies have compared Aberdeen Angus, Hereford and Friesian (Andrews and Wedderburn, Reference Andrews and Wedderburn1977); Aberdeen Angus and Hereford (Tulloh, Reference Tulloh1962); Friesian, Dairy Shorthorn and Hereford (Brooks and Hodges, Reference Brooks and Hodges1979); Friesian, Jersey and Ayrshire breeds (Weiner and Forster, Reference Weiner and Forster1982) and Shorthorn and Brahman × British (Dodt and O'Rourke, Reference Dodt and O'Rourke1988).
The breeds most commonly represented within the pure-bred analysis (over 1000 animals per breed) were for dairy: Friesian/Holstein and for beef: Limousin, Charolais and Simmental. Less commonly (numbers in hundreds) were Channel Island and Ayrshire dairy breeds and Aberdeen Angus, Hereford, Belgian Blue, South Devon, Red Devon and Blonde Aquitaine beef breeds. The remaining breeds were included as being present in numbers over 50. The smaller numbers representing these breeds will mean that the parameter and thus age estimates from the models will be less reliable. The breeds most commonly represented in this study very closely match the breed profile recorded at the time by Great Britain's Cattle Tracing System database, operated by the British Cattle Movement Service (English Beef and Lamb Executive (EBLEX), 2007) and reflects the changed breed popularity since the studies carried out in the 1970s and 1980s as well as a small element of geographical bias towards the southern half of England and Wales. The model comparing development of PA teeth between beef and dairy-bred animals showed a significant effect across all stages with earlier development in the dairy-type. Table 3, Model 3 shows the intervals between the types, averaged for the sexes, as ranging from 8 to 12 weeks, although this should be interpreted with caution as the data at the later stages became sparse and may be unduly influenced in the model by the relatively high numbers of dairy females as can be seen by comparing Supplementary Figures S1 and S2.
The statistical modelling that took account of numbers within each breed, as well as transition points, showed that in the pure beef breeds, there was no statistical difference between Belgian Blue, British Shorthorn and Sussex compared with Aberdeen Angus. Welsh Black and Herefords were statistically different, showing later development than Aberdeen Angus across all stages although with Herefords to a lesser degree than that found by Andrews and Wedderburn (Reference Andrews and Wedderburn1977) who demonstrated that Herefords showed a delay in emergence of the first pair of ∼7.5 weeks compared with Angus and Friesians. Tulloh (Reference Tulloh1962) showed a similar effect between Australian Herefords and Aberdeen Angus at the second tooth stage. Simmentals, Limousins and Blonde Aquitaine all showed similar delayed development of between 6 and 8 weeks across the first three stages. A much longer delay is seen at the 4th stage but again this should be interpreted with caution due to the sparsity of data at this age, although Dodt and O'Rourke (Reference Dodt and O'Rourke1988) found the delay in emergence with Brahman cross compared with Shorthorn to progressively increase with the later stages. Significant but slightly lower differences were also seen in the Charolais and South Devon breeds. Red Devons and Galloway showed the longest delays of all the breeds with between 12 and 16 weeks delay across the first three stages.
When looked at as collective groupings of continental and native breeds, there was a small but significant effect, which was consistent across all stages of development, with transition between the stages occurring between 2 and 3 weeks later in the continental category. The consistent sex effect is also more in line with the larger data set showing females developing later than males by ∼3 weeks for both groupings.
For the dairy breeds, the Friesian/Holsteins (the reference dairy breed) showed similar age of transition for males across the stages as Aberdeen Angus males (the reference beef breed). The reverse sex effect described earlier, however, gave rise to a much larger differential for the females between the reference breeds. Within the dairy category, Ayrshires and Guernseys showed a marginally significant delay in development when compared with Friesians, Ayshires showing between 3 and 7 weeks difference as the dentition stages progressed and Guernseys slightly longer. The difference between the Jersey breed and Friesians was not, however, statistically significant. Montbeliarde, despite relatively low numbers, did show a significant effect with similar delays to that seen in the Guernseys. There was no significant difference seen with the Meuse Rhine Issel breed.
This delayed effect was also shown in a longitudinal study of dairy breeds by Weiner and Forster (Reference Weiner and Forster1982) who found both Ayrshires and Jerseys to erupt the first pair 4 weeks after Friesians, although the effect was not consistent across all dentition stages.
Although this study has looked at sex and breed as well as age as the main variables on PA tooth development, there are likely to be other factors in addition to heritability that influence development. Brooks and Hodges (Reference Brooks and Hodges1979) showed malnutrition, when present in the first few months of life, as having a retarding effect of up to 10 weeks and Weiner and Forster (Reference Weiner and Forster1982) also found season of birth to have an effect; autumn-born calves erupting teeth up to a month earlier than spring-born.
It appears from this study that, despite the changes in the popularity of certain breeds over the last few decades and changes in systems of husbandry, the overall effects on anterior tooth development have been small, although the results suggest a trend towards a slight delay in development across the first three pairs. The fourth pair is seen to develop earlier than previously reported but for reasons previously discussed, this may not be a reliable finding. Breed (including collective types) and sex are shown to have an influence on development and should be considered in age estimation using PA teeth.
Finally, it is worth noting in the context of the study that the breed profile presented here will show further movement over time as a result of changes in market demand. There has been, for example, increased popularity in traditional breeds such as Aberdeen Angus and Red Devon since the data for the study were collected.
Acknowledgements
The authors gratefully acknowledge the following: Miss Elizabeth Peach who carried out a detailed student extra-mural project, with the help of Mr John Fishwick and Dr David Brodbelt of the Royal Veterinary College, which formed the pilot for this wider scale study. They are most grateful also to EBLEX for providing funds to enable transcription of a large part of the data set into an electronic format.