


INTRODUCTION
In April 1899, Sam Hose was accused of murdering his employer and raping his employer’s wife. Local papers published salacious accounts of the killing and offered rewards for Hose’s capture. When Hose was captured, special trains were chartered to bring hundreds of people to his lynching in Newnan, Georgia. Despite the pleas of former-Governor William Atkinson to respect the rule of law, the crowd of hundreds jeered as Hose was tortured, his appendages severed, and burned alive. Spectators scrambled to gather souvenirs—including pieces of his body. No one was even arrested (Arnold Reference Arnold2009). Hose’s murder, while unusual, was one of many “spectacle” lynchings, in which large crowds watched victims burned or tortured to death.
The particularly gruesome nature of the killing elicited horror and outrage from Northern newspapers, but Southern papers railed against Northern hypocrisy and defended the lynching, if not the method. Papers nationwide assumed Hose’s guilt, portrayed the victim’s crimes as the cause of the lynching, and otherwise accepted the mob’s account of the events. The New York Times ran the headline: “NEGRO BURNED AT A TREE/PAID THE PENALTY OF HIS CRIMES AT HANDS OF A MOB/TORTURED WITH ALMOST FIENDISH CRUELTY.”
In 1934 in Florida, Claude Neal was accused of raping and murdering the daughter of his employer. After his arrest, the police moved Neal to another county to obstruct the lynch mob. Local newspapers called for restraint. The lynchers worked at night and used back roads to avoid police checkpoints. Neal was tortured, flesh was cut from his body, and hot irons were used to burn him. While some local press defended the lynching, newspapers across the country decried the killing and censured the police and elected officials for failing to act. The governor received hundreds of telegrams condemning his inaction. The public outrage fueled renewed efforts to pass federal anti-lynching legislation (McGovern Reference McGovern1982).
The juxtaposition of these events raises a fundamental question: How did lynching come to be seen as an atrocity? And more generally: how do public responses to violence move from acceptance to opprobrium? Following from his dictum that the modern state holds the “monopoly of the legitimate use of physical force,” Weber defines politics as contestation over this “sole source of the ‘right’ to use violence” (Weber Reference Weber, Gerth and Wright Mills1946). From this perspective, asking how does the legitimacy of violence change is a vital question for any science of politics.
Yet this question is rarely addressed directly in the study of violence or political science. This is not because conflicts over the legitimacy of violence are settled. The scope of private violence forbidden or permitted by the state was and remains hotly contested. Domestic violence, once considered the prerogative of male heads of households, is now criminal. State limits on private violence figure centrally in contemporary debates over “Stand Your Ground” laws, gun control, and the privatization of state coercive powers such as prisons, bail bondsmen, and security contractors. The same holds for violence perpetrated by the state. The expansion of civil liberties such as due process and free speech came about through opposition to arbitrary violence by the state (Francis Reference Francis2014). Today, debates over legitimacy of the death penalty, police use of force—lethal and non-lethal—mandatory sentencing, and military actions outside of war are live and the stakes are high.
I argue that violence is generally legitimated locally by powerful actors that benefit from it directly or indirectly. The expansion of publicity of violence along the dimensions of “reach”—geographic scope—and “inclusivity”—access to public debate by the powerless—can upend a system that legitimates violence. Greater reach of publicity undermines the ability of local elites to control the “facts” of the case and to suppress critics as well as bring news of the events to distant audiences that do not share in the culture of violence. Greater inclusivity allows victims of violence to challenge the hegemony of perpetrators by articulating counternarratives about the violence.
Building on historical work by Brundage (Reference Brundage1993), Dowd Hall (Reference Dowd Hall1993), Bernstein (Reference Bernstein2006), Waldrep (Reference Waldrep2009), and Campney (Reference Campney2013), I develop and test this argument through the case of lynching in the United States. With new technology and growing interest, news of lynching reached a national—and sometimes international—audience. The traditional local justifications of lynching failed to persuade new, far-flung audiences, and the national media wrested control over lynching narratives from local communities that had hitherto legitimized their actions. At the same time, the existence of a national media market allowed African American activists to escape coerced silence in lynching communities to publicly refute the arguments and narratives voiced by lynching apologists. The resulting public scrutiny brought scandal and ignominy to towns, counties, and states in which lynchings occurred. Fearful of the costs to their reputations, local politicians and business leaders worked to suppress lynching.
I substantiate this argument with historical evidence and statistical analyses of novel data on press coverage and railroad networks. I compile data on issues from several thousand newspapers—ranging from rural weeklies to big-city dailies—between 1880 and 1940. Searches of more than nine million issues for keywords and phrases corresponding to justifications and denunciations of lynching capture spatial and temporal variation in discourse about lynching across the breadth of the media landscape. I pair this with new data on railway networks in the nineteenth century and data on lynchings nationwide.
Using these data, I test key implications of my argument. I find that lynchings occurring in places with greater integration in and shorter travel times due to rail networks received greater and more geographically dispersed coverage in the nation’s newspapers. Consistent with my claim that increased publicity created opportunities for criticism, I find that distant press coverage of lynchings was more critical. Finally, in analyses of county-year panel data, I find that increased risk of publicity was related to a decrease in the incidence of lynching. This is consonant with the historical record that shows business leaders, politicians, and police were concerned about avoiding the costs to their reputations incurred by lynchings (Brundage Reference Brundage1993) and with evidence that communities that embraced the “New South” actively prevented lynchings (Beck, Tolnay, and Bailey Reference Beck, Tolnay and Bailey2016).
In what follows, I first theorize how violence is legitimated and how increasing publicity can disrupt this legitimation. Next, I describe the history of lynching in the United States and provide qualitative evidence that the expanding reach and inclusivity of publicity transformed the public acceptability of lynching. I then develop four observable implications of this argument and describe and report the results of statistical tests for each of them. I conclude by discussing how the argument I develop here extends beyond lynching.
THEORY
Legitimation of Violence
Violence is legitimated within localities when it is perpetrated by or benefits powerful local elites and stakeholders, because these conditions give perpetrators the motive and opportunity to legitimate their actions. Black (Reference Black1983), Pinker (Reference Pinker2011), and Fiske and Rai (Reference Fiske and Rai2015) argue that the vast majority of violence perpetrated by people is “moral”—subjectively evaluated by perpetrators as morally correct. From this perspective, Fiske and Rai (Reference Fiske and Rai2015) propose a relational models theory (RMT) of violence in which perpetrators of violence seek to create, transform, restore, or end morally charged relationships with others, in line with what the perpetrators think they ought to be. Thus, violent actions always puts people into roles: perpetrators, victims, and usually some “others”—or audience—whose relationships with perpetrators and victims are modified or affected.
While most perpetrators of violence understand their actions to be legitimate, it is not necessarily true that this conviction is reciprocated by victims or audiences. Fiske and Rai argue that “moral” violence is only successful in its aims when it is consonant with local cultural guidelines or understandings, what they call preos. Failure to comport with local norms could lead “moral” violence to elicit a backlash or retribution; as Black (Reference Black1983) rightly points out, much “moral violence” is treated as crime or transgression by the society or state in which it occurs. So while most perpetrators are motivated to legitimize violence and most victims have an interest in condemning violence, what are the motives of the more numerous audience? And how do perpetrators of violence ensure that their actions are not treated as criminal or transgressive?
While audiences have a variety of motives when evaluating violence, they may end up supporting or failing to condemn violence perpetrated by powerful local actors for two reasons. First, from the perspective of Fiske and Rai (Reference Fiske and Rai2015), violence may be perpetrated to establish or confirm relationships between the perpetrator and local audiences (both establishing the perpetrator and audiences’ unity as a group and/or status in a hierarchy over the victim). When the perpetrators are powerful, it may be more desirable or necessary for local audiences to accept the moral claims made by perpetrators in order to preserve their relationship. By contrast, it may be far easier to dismiss or reject the moral claims behind violence made by people who lack local power, since relationships with those perpetrators are less valuable. Second, psychological research on system justification theory also suggests that people are more likely to defend a social practice when it is part of the social system to which their fate is tied (Jost and Andrews Reference Jost and Andrews2011). Thus, even when audiences may not have direct relationships with perpetrators, they may be unwilling to denounce violence when doing so challenges the order in which they live.
The power of local actors also determines their capability to legitimize violence through diagnostic framing—identifying phenomena as problems or ideals for which violence might be a solution or means to achieve—and prognostic framing—identifying violence as the appropriate means to address the problem—and deny this capability to others (Snow and Benford Reference Snow, Benford, Klandermans, Kriesi and Tarrow1988). This is because power gives actors greater access to the institutions through which public legitimation can be accomplished and the ability to deny this access to others. For example, powerful local actors are more likely to be or know members of local institutions such as government, organized religion, and businesses. Powerful actors can use access to these institutions as a mouthpiece or bully pulpit to publicly endorse or denounce violence. Perhaps most importantly, the powerful have greater access to or control over media institutions; this makes it possible for them to disseminate their message via print, radio, television, or the internet. Even in the absence of modern media, local potentates have opportunities to influence and orchestrate public holidays, ceremonies, and rituals in order to legitimate violence. At the same time, local elites may have more tools of coercion that can be used to exclude their opponents from public debate. While this coercion might take a variety of forms, in the extreme, this is manifest in the shuttering of media outlets, violence against journalists or leaders of the opposition, and the use of violence to suppress protests.
The idea that powerful actors can shape cultural discourse is not new. And while it is true that “the weak” may subversively reject hegemonic discourses (Scott Reference Scott1990; Wedeen Reference Wedeen2015), the effects of framing can be substantial especially in the absence of counterarguments (Chong and Druckman Reference Chong and Druckman2013; DellaVigna and Kaplan Reference DellaVigna and Kaplan2007). And “hidden transcripts” notwithstanding, public discourses are likely to exclude the voices of the weak.
For these reasons, in the absence of external interventions, local legitimation of violence will most likely reflect the discourses of the powerful. Thus, violence is most likely to be legitimated when powerful local actors are motivated to do so, because they are the perpetrators or have valued relationships with them. In this scenario, it is also likely that audiences would support violence, because to do otherwise might jeopardize materially or morally valued relationships with the perpetrators. Under these conditions, the dynamic of public legitimation can become self-reinforcing. Once powerful supporters of violence actively legitimize violence and suppress dissenting views, the only public narratives about the violence will serve to justify it. In this way, even the “facts” concerning incidents of violence are determined by the perpetrators and are arranged to fit a narrative that justifies their actions.
In the absence of countervailing claims, local audiences may be persuaded to believe the justifications for violence or to at least defer to the perpetrators. And without a challenge, violence can be routinized; in the long term, these audiences may come to see violence as part of the status quo and come to value benefits and privileges produced by the violence. This would in turn increase the costs for members of the audience or victims to come out publicly against violence, further limiting the public availability of discourses against violence. As long as politics remain local, this state affairs can be hard to change.
Publicity
How can the cycle of local justification of violence and silencing critics be broken? Approaching this question from different directions, Fiske and Rai (Reference Fiske and Rai2015) and Keck and Sikkink (Reference Keck and Sikkink1998) both suggest ways this might happen through what they, respectively, call metarelational models and the “boomerang” processes of mobilization. Synthesizing these and other approaches, I argue that a key underlying mechanism by which justifications for violence might be disrupted is the introduction of new forms of publicity: the expansion of the geographic reach of publicity and its inclusivity. By the “reach” of publicity, I mean the geographic area in which news of an event is reported. By “inclusivity,” I mean the degree to which public discussions of an event include or exclude different accounts and perspectives.
Expanding both the reach and inclusivity of publicity about violence disrupts the local legitimation of violence discussed above. There are two, complementary ways this can happen. First, when news of violence reaches new, distant audiences, they are likely to be critical. Unlike locals, outsiders’ ways of life are not deeply linked to the violence, they are unlikely to have important strategic or ethical obligations to perpetrators, and so they are prone to find justifications for violence unfamiliar and unpersuasive (see, e.g., Acharya Reference Acharya2004; Townes Reference Townes2012). When new audiences weigh in, public de-legitimation of violence will reach the site of the violence and locals can do little to stem the tide of condemnation. It is possible, however, that new audiences are not intrinsically motivated to condemn the violence due to disinterest or because, lacking other accounts, they are initially persuaded by justifications given by perpetrators. In these cases, publicity may challenge local legitimation of violence in a second way that closely parallels the “boomerang” pattern of influence in transnational activist networks identified by Keck and Sikkink (Reference Keck and Sikkink1998). Increased reach and inclusivity permit victims and their allies to join the public debate and condemn violence from new venues. Far from the coercion imposed by local perpetrators, they can articulate arguments against violence and provide counternarratives that contradict and discredit the stories used to justify violence. This directly challenges the local legitimation of violence and may ultimately persuade distant audiences to join in public criticism of violence.
Not only can publicity create opportunities for challenging local frames justifying violence, new forms of publicity also transform the reputational costs associated with legitimating and de-legitimating violence. When news of violence is strictly local, denouncing it could endanger one’s reputation and cost business and interpersonal relationships. Both the meaning of violence and the range of actors which can impose reputational costs are fundamentally transformed by the expansion of publicity (Kalyvas Reference Kalyvas2003; Schattschneider Reference Schattschneider1960). As Fiske and Rai contend, when the number and importance of relationships jeopardized by violence increases, that violence declines. And more generally, they posit that, because most relationships are non-violent, simply increasing the number of relationships will increase the number of relationships potentially jeopardized by violence, making violence (and public support for it) more costly (Fiske and Rai Reference Fiske and Rai2015, 272–3). If extra-local discourses about violence are broadly critical, then any local reputation costs to denouncing violence might be offset by relationships with people further away, because potentially valuable extra-local relationships could be lost by publicly backing violence. Increasing the reach and inclusivity of publicity simultaneously proliferates the number of relationships and makes it more likely that violence would jeopardize them. Under these conditions, even people who think violence is justified may shy away from defending the practice as the costs of doing so increase.
In sum, expanding publicity disrupts the cycle of local legitimation. With greater reach and inclusivity of publicity, local perpetrators cannot silence victims or critics of violence and lose control over both diagnostic and prognostic frames for violence. When new, external criticism reaches a locality, violence is no longer normalized, and instead support for it may be costly, leading some locals to condemn violence. In the extreme, expanded reach and inclusivity of publicity—and the resulting public opposition to violence—could also reduce the actual incidence of violence. This is because perpetrators and bystanders could be swept up in a costly scandal should violence occur. Scandals occur when an alleged or actual transgression of social norms is revealed to the public. Recent research suggests that scandals occur under conditions of high publicity, in highly saturated media environments, when everyone knows that everyone else knows about a transgression (Adut Reference Adut2009). Increased inclusivity means that violence is more likely to be seen as transgressive and increased reach leads to widespread awareness of the violence. Once scandals start, they can be contagious, bringing shame or dishonor not only to perpetrators, but also to people and institutions that failed to intervene and stop violence. The possible damage to reputations may motivate locals to denounce the violence and even to take concrete steps to stop it (Adut Reference Adut2009; Appiah Reference Appiah2010).
LYNCHING IN THE UNITED STATES
Lynching is the extralegal use of lethal force to punish some alleged crime or violation of custom or tradition and it differs from simple vigilantism in that it is perpetrated by a group of people. While definitions changed and have been contested over time, lynchings are distinguished from pogroms and riots in that individuals are targeted because they are specifically culpable due to their actions and distinct from murders because they enforce a putative “justice” or “tradition” (Senechal de la Roche Reference Senechal de la Roche2001; Waldrep Reference Waldrep2002).
Between 1880 and 1940, more than 3,500 Americans were killed at the hands of lynch mobs nationwide (Seguin Reference Seguin2016), and between 1890 and 1910, states in the former Confederacy averaged nearly one hundred lynchings annually (Tolnay and Beck Reference Tolnay and Beck1995).Footnote 1 The vast majority of victims were African American, but Mexicans, Chinese, Native Americans, Italians, and other whites were also lynched. African American victims were often atypically marginal or prominent within their communities (Bailey and Tolnay Reference Bailey and Tolnay2015). Lynchings also varied in form: some were perpetrated by small, anonymous groups working in secret, while others were public and included many of participants (Brundage Reference Brundage1993; Smangs Reference Smangs2016). And while lynching connotes hanging, the technique of violence included firearms, burning, torture, and “extra-lethal” desecration of victims’ bodies (Fujii Reference Fujii2013). In the extreme, victims could be tortured and mutilated before crowds of hundreds or thousands. Despite this variation, lynchings challenged the state's monopoly on violence. Not only did mobs proclaim their own “law,” victims were often seized from courtrooms or jails, while perpetrators were rarely indicted let alone convicted (Waldrep Reference Waldrep2002).
The causes of lynching were several. Tolnay and Beck (Reference Tolnay and Beck1995) argue that cotton cultivation led white planters to control the availability of black labor and poor whites to compete with African Americans for work and land, producing a cross-class coalition for violence against African Americans. Bailey and Snedker (Reference Bailey and Snedker2011) find that lynchings were more common when white communities were divided by religion and less common where religious communities crossed racial lines. Smangs (Reference Smangs2016) further shows that while “public” lynchings unified white communities, “private” lynchings followed an economic logic similar to Tolnay and Beck. And while Southern Democrats employed racist rhetoric similar to apologies for lynching (Cecelski and Tyson Reference Cecelski and Tyson1998), Tolnay and Beck (Reference Tolnay and Beck1995), and Hagen, Makovi, and Bearman (Reference Hagen, Makovi and Bearman2013) find that lynchings were less likely in places with greater Republican vote share, suggesting that electoral competition did not drive lynching.Footnote 2
Lynching in Public Debates
Lynchings loomed large in the national consciousness. Some lynchings, particularly “spectacular” ones, became front-page news in papers across the country (Perloff Reference Perloff2000; Seguin Reference Seguin2016; Wood Reference Wood2009). This publicity generated vociferous debates. Perpetrators and defenders of lynching gave their own reasons and justifications for lynching. Invoking the dilemma of law enforcement in Frontier communities, many praised lynching as a form of popular sovereignty in which “the people” enacted the law themselves: lynching was not merely legal, but an expression of democratic self-legislation (Pfeifer Reference Pfeifer2011; Waldrep Reference Waldrep2002). This dovetailed with claims that courts, rules of due process, and criminal defense attorneys were inefficient, corrupt, and exculpated criminals on mere “technicalities.” Accordingly, lynching dispensed “justice” and deterred crime.
While allegations of rape were the pretext for a minority of lynchings (Brundage Reference Brundage1993; Tolnay and Beck Reference Tolnay and Beck1995), lynching was most frequently justified as a means to punish sexual crimes (Jean Reference Jean2005). Proponents claimed that rape elicited a “natural” desire for men to defend “their” women and that trials only forced victims to painfully relive the assault. Racism was wedded to and intensified these arguments. Lynching apologists argued that violence against African Americans was necessary because the failed experiment of Reconstruction corrupted the courts (Waldrep Reference Waldrep2002); emancipation caused African American men to degrade into “brutes”; and the only way to deter “fiends” from pursuing rape was swift and extreme punishments, including torture (Wood Reference Wood2009). When both racial and sexual purity were at stake, the “natural” impulse for vengeance was amplified. As then-South Carolina Governor Coleman Blease put it: “When the Constitution steps between me and the defense of the white women of my State … to hell with the Constitution!” (Anonymous 1912).
These explicit arguments in favor of lynching built on narratives and tropes. In the Southern press, lynching narratives portrayed the mob as sober, rational, and composed of “leading citizens”; used passive voice to erase responsibility for the killing; presumed the guilt of the victim; and portrayed black victims as subhuman, monstrous, and unrepentantly criminal (Jean Reference Jean2005). Often, these narratives were parroted in the Northern press: The New York Times recycled the headline “A BRUTAL NEGRO LYNCHED” eleven times during the 1880s (Seguin Reference Seguin2016, 1).
In many places, support for lynching was rooted in local culture. Many lynchings were public and attended by large crowds,Footnote 3 treated as picnics or festivals, celebrated in local newspapers (Clark Reference Clark1948), and sometimes commemorated in folk songs, photographic postcards, and the sale of macabre souvenirs including body parts (Wood Reference Wood2009). Important public figures endorsed the practice: in 1908 a former Senator from Mississippi boasted to reporters of leading a lynch mob (Curriden and Philips, Jr. Reference Curriden and Philips1999). This public support for lynching was consequential. The press often “predicted” lynchings, provided ex ante justifications, and sometimes encouraged them. This endorsement may have caused lynchings (Arnold Reference Arnold2009; Brundage Reference Brundage1993; Clark Reference Clark1948).
And while not all Southern whites endorsed lynching and particular lynchings were seen as “unwarranted,” public opposition to lynching as such was rare (Jean Reference Jean2005). Even when lynching was condemned, these condemnations came with caveats that conceded much to rhetorical defenses of lynching. Atticus Haygood, a prominent Methodist bishop, denounced lynching as illegal, but repeated claims that interracial rape by black men was rampant and that these acts naturally and understandably induced “moral insanity.” For his capitulation, anti-lynching activists condemned Haygood as a hypocrite (Mathews Reference Mathews2017).
Public support for and justification of lynching underwent a sea-change between the 1890s and the 1930s (Seguin Reference Seguin2016). The press ceased to endorse the “facts” that warranted lynching (Jean Reference Jean2005). Instead, new narratives refuted claims that black men preyed sexually on white women; claimed mobs acted out of resentment toward successful blacks and white supremacy; and showed mobs to be unruly and uneducated rather than “leading citizens” (Brundage Reference Brundage1993; Dowd Hall Reference Dowd Hall1993; Waldrep Reference Waldrep2009). Similarly, press reports ceased dehumanizing and imputing guilt to victims. Newspapers held mobs accountable for their actions and cast suspicion on their motives. Lynchings were portrayed as scandalous lapses of supposedly civilized whites into “savagery.” Rejecting lynching as “natural,” newspaper editors placed blame on local politicians and police for failing to uphold the law.
These new narratives bolstered explicit condemnations. Most prominently, lynching was denounced as a threat to law and order. Public figures and newspaper editorials argued that lynching violated the criminal law and the Constitution and that permitting this lawlessness would foster a disregard for the law, threaten public order, and open the door to anarchy and “barbarism.” As a result, commentators argued that the lynching was a stain upon the reputation of the United States internationally, and upon individual states or communities where it occurred (Pfeifer Reference Pfeifer2004; Waldrep Reference Waldrep2002, Reference Waldrep2009).
How did this change happen? The historiography of lynching suggests several reasons. First, from 1900 to 1940, Southern agriculture shifted from labor- to capital-intensive (Hornbeck and Naidu Reference Hornbeck and Naidu2014; Tolnay and Beck Reference Tolnay and Beck1995). This reduced the need for violent control over black labor. In the absence of the need for lynching, the justification for it withered away. Second, other economic or political considerations persuaded erstwhile supporters of lynching to turn against it. For example, when white labor organized in the South, business elites endorsed the expansion of state militia and police to stop all forms of extralegal violence, including labor unrest and lynchings (Brundage Reference Brundage1993; Campney Reference Campney2013). Similarly, the architects of Jim Crow saw segregation and related institutions as a way to render lynching unnecessary (Brundage Reference Brundage1993; Pfeifer Reference Pfeifer2004). Third, social transformations like the decline in scientific racism, the rise of progressivism, the emergence of social gospel, and the growth of labor and communist organizations may, each in their own way, have eroded support for lynching (Dowd Hall Reference Dowd Hall1993; Hill Reference Hill2009; Wood Reference Wood2009). All of these transformations likely changed how racial violence was viewed and reduced the incidence of lynching. I propose an additional, complementary explanation.
PUBLICITY AND LYNCHING
In the late nineteenth century, the reach and inclusivity of publicity expanded, in part due to technological advances of the railroad and telegraph, resulting in challenges to justifications for lynching and increased reputational costs.
As detailed above, lynching routinely received public endorsement where it happened. At the same time, powerful local interests were able to silence the condemnation of lynching and the narratives of victims through the use or threat of force. African Americans who dared to criticize lynching in the South were beaten, murdered, or even lynched themselves. Public figures were not exempt. While there were many black newspapers in the South, with few exceptions they did not take strong stances against lynching. Black editors that condemned lynching risked losing the support and advertising from white printers and businesses (Seguin Reference Seguin2016, 48), being run out of town (Bay Reference Bay2009, 103), and being jailed (Bernstein Reference Bernstein2006). Even white opponents of lynching in the South during the 1880s and 1890s faced severe criticism, accusations of supporting rape, death threats, and attacks on their property (Brundage Reference Brundage1993; Clark Reference Clark1948). As late as 1919, a white, high-ranking official with the NAACP was violently beaten on the steps of the state courthouse in Austin, Texas, by a mob headed by a county judge (Francis Reference Francis2014). And following the end of Reconstruction, Republican newspapers in the South faced violence and declining revenues, shuttering potential local voices against lynching (Gentzkow et al. Reference Gentzkow, Petek, Shapiro and Sinkinson2015) (See SA C.3).
A Transformation in Publicity
But expanding reach and inclusivity brought lynchings to a wider audience, exposed lynching communities to criticism, and permitted African Americans to challenge the frames that justified the practice.Footnote 4 While postal subsidies of newspaper exchanges between editors had facilitated the spread of news since the time of the Revolution (Kielbowicz Reference Kielbowicz1989), the kind, quantity, and speed of this news changed drastically in the second half of the nineteenth century. In the early nineteenth century, the news that circulated around the nation covered events in the centers of economic and political power and emanated outward to the hinterland. And methods and prices of distributing mail severely limited the amount of information and the speed at which it moved (Kielbowicz Reference Kielbowicz1989; Pred Reference Pred1973). This meant that news of events like lynching was unlikely to be reported in local papers, less likely to travel to new audiences, and if it did, this news would be out-of-date, critical responses would be staggered rather than simultaneous, and criticism would be slow in reaching locals, if at all.
Several changes over the course of the century drastically increased both reach and inclusivity of publicity. First, growing populations, new printing technology, expanding railroad postal routes, second-class mail policy, and growing advertising revenue prompted the emergence of local news, initially in cities and eventually nationwide (Russo Reference Russo1980). Second, changes in technology and policies increased both the volume and speed of news and created a truly national public. While railroad and telegraph were introduced in the 1830s, between 1870 and 1900 rail and telegraph networks expanded drastically, the cost of telegrams dropped while wire services grew, and the distribution of mail via railroads grew exponentially (Blondheim Reference Blondheim1994; Kielbowicz Reference Kielbowicz1989). Increased speed brought news to audiences nationwide simultaneously and made coverage and reception of an event part of the event itself (Kielbowicz Reference Kielbowicz2016). The growing quantity of news brought a deluge of national publications, opinions, and advertising to even isolated communities, rendering membership in a national community imaginable (Kielbowicz Reference Kielbowicz1989). These changes entailed more news about lynchings, this news reaching wider audiences, these audiences being understood as peers, the audiences’ criticism becoming part of the story, and, ultimately, establishing the shared knowledge required for national scandal.
At the same time, this increase in reach enabled greater inclusivity. While black voices against lynching in the South were violently suppressed, the emergence of national audiences and news institutions enabled African Americans to join the public discourse on lynching. The black press coordinated nationally to report on lynching events, provide the victims’ perspective of lynching, and articulate clear counterarguments against lynching justifications, even if Southern black newspapers could not. When Ida Wells was forced out of Memphis and her newspaper shuttered for condemning a lynching there, she was not silenced. Instead, through connections to the National Colored Press Association (founded 1881), she found a safe haven working for the New York Age where her strident arguments against lynching were vaulted onto a larger stage (Schechter Reference Schechter2001, 90). African American newspapers from major cities, like the Chicago Defender, New York Age, and the Richmond Planet carried these messages to audiences extending far beyond their cities of origin, sometimes reaching whites (Waldrep Reference Waldrep2009). The Defender even employed Pullman Porters to smuggle issues into the South (Grossman Reference Grossman1985, 86).
Publicity and De-legitimation
As news of lynching events reached wider audiences, its meaning and consequences were no longer local. Regardless of the specific facts of the case, a lynching became situated in the broader national debate about lynching in general (Seguin Reference Seguin2016). While lynching enjoyed public support in the communities where it was perpetrated and its legitimation could be achieved through the production of a shared narrative, when news of lynching events reached wider audiences, its meaning and consequences were no longer secure. Audiences in the Northeast and Midwest, where extralegal killing was rare and where legal executions were “private,” did not share in the culture of lynching (Pfeifer Reference Pfeifer2004; Wood Reference Wood2009). Given the political history of race, abolition, and Reconstruction, it is no surprise that Northern newspapers, particularly Republican papers like the Chicago Tribune, were open critics of lynching (Perloff Reference Perloff2000). And international reporting on lynching was nearly uniformly critical (Seguin Reference Seguin2016, 56–74), particularly in the United Kingdom (Silkey Reference Silkey2015). Coverage of lynchings outside the South produced a wave of editorial condemnation of lynching and the communities that perpetrated it. The Southern press were acutely aware of this criticism and were incensed by it (Clark Reference Clark1948). But with their antagonists hundreds of miles away, lynching apologists could do little but rebut the arguments and charges levied against them and express their indignation—which they did, vociferously, charging that outsiders were hypocrites and lacked adequate knowledge of the “negro problem” (Jean Reference Jean2005). But this could not restore their control over narratives about lynching.
Even though increased coverage of lynching meant that distant audiences were aware of the violence and often found it deplorable, they did not necessarily take a public stand against it. Instead, many Americans believed claims that rape was the cause of lynching. In his response to a lynching Delaware and a thwarted lynching and race riot in Indiana, President Theodore Roosevelt publicly condemned lynching. But, echoing Southern apologists, he asserted that swift and severe punishment for rape was the solution (Schechter Reference Schechter2001, 127). Likewise, when newspapers took an editorial stand against lynching, they often conceded the diagnostic frames undergirding justifications for lynching. This control over the “facts” of lynching was so pervasive that Frederick Douglass—according to Wells (Reference Wells1970)—Booker Washington, and other civil rights leaders believed the “crime” narratives (although they did not see it as a justification for lynching).
African Americans played the central role in both contradicting the “facts” of lynching with new narratives and articulating the central arguments against the practice. Activists like Ida Wells, Monroe Work, and the NAACP employed statistics on lynching to demonstrate that rape, though often cited as a justification for lynching, was only alleged in a decreasing minority of lynchings (Waldrep Reference Waldrep2009; Wood Reference Wood2009). Wells reported on her personal investigations of lynchings and argued that rape was a pretext for killing in cases of consensual relations between white women and black men (Hill Reference Hill2009). The NAACP also conducted discreet investigations and published their findings in periodicals and in mass press releases to major newspapers across the country (Waldrep Reference Waldrep2009). These reports revealed that victims were lynched for reasons related to racial bias or jealousy; that their “crimes” were acts of self-defense in the face of white violence; and that mobs were incorrect, unruly, and drunk; with the aim of juxtaposing the humanity of the victims with the horrific violence of the mob.
One of the most compelling examples of African Americans transforming public discourse was the subversive appropriation of lynching postcards by black newspapers and periodicals. Lynchings were sometimes commemorated in gruesome photographic postcards in which participants or spectators posed with the victim’s body. White supporters of lynching sent these to friends and family to relate the story of the killing and to reaffirm their racial superiority. While white newspapers were unwilling to print these images, the black press sought out and published the photographs with commentary that highlighted the barbarity and hypocrisy of the mobs (Wood Reference Wood2009).
Consequences
Once criticism of lynching emerged, perpetrators and their defenders faced condemnation. After a lynching, towns could become the focal point of a national scandal, bringing in reporters and investigators. Negative portrayals of a lynching made townspeople appear barbaric, uneducated, and lawless. To city leaders that embraced ideals of civic reform and portrayed their cities as modern and urbane, such national embarrassment was truly harmful (Brundage Reference Brundage1993; Campney Reference Campney2013).
Scandals were more likely to erupt when there was widespread foreknowledge that a lynching was threatened and could occur. When “everyone” knew lynching was imminent and the killing happened, the failure to enforce the law implied the incompetence or complicity of local sheriffs, mayors, and governors, tarnishing their reputations. Notable cases of this include the 1899 lynching of Sam Hose and the 1906 lynching of Ed Johnson while he awaited an appeal before the Supreme Court. In the wake of the Hose lynching, former Governor Northen sought to restore his state’s reputation by giving a speaking tour across the North (Arnold Reference Arnold2009). In the Johnson lynching, the sheriff and his deputies were condemned in the press and tried and convicted for contempt of the Supreme Court (Curriden and Philips, Jr. Reference Curriden and Philips1999).
Importance of Publicity
The importance of publicity in changing discourse about lynching is evidenced by the behavior of both anti-lynching organizations and lynchers. Organizations involved in the anti-lynching movement, like the NAACP, Association of Southern Women for the Prevention of Lynching (ASWPL), the Tuskegee Institute, and International Labor Defense, all put publicity at the center of their agendas (Brundage Reference Brundage1993; Dowd Hall Reference Dowd Hall1993; Hill Reference Hill2009; Waldrep Reference Waldrep2002). Ida Wells explicitly called for a campaign of publicity to undermine lynching: “The negroes must have detectives who can go and find out the facts about each lynching and publish them side by side with the versions printed in the Southern newspapers.” She pioneered this strategy, hiring a private investigator to report on the lynching of Sam Hose (Arnold Reference Arnold2009) and conducting her own investigations in Cairo, Illinois, and Elaine, Arkansas (Schechter Reference Schechter2001). The NAACP, without crediting Wells, implemented her strategy on a larger scale. Their investigators risked their lives to write scathing reports on lynching events that were subsequently published in The Crisis and press releases (Waldrep Reference Waldrep2009). And though the NAACP fought for a federal anti-lynching law (Francis Reference Francis2014), Walter White, head of the organization in the 1930s, saw publicity as their greatest weapon (Waldrep Reference Waldrep2009). To these ends, Wells and the NAACP cultivated close relationships with newspaper editors and wire services to obtain access to white audiences (Silkey Reference Silkey2015, 99–110) (Bay Reference Bay2009, 151).
Lynchers were acutely aware of the threat that publicity posed. Lynchers and their supporters used threats to keep investigators from providing alternate narratives. On multiple occasions, lynching investigators escaped only moments before mobs came for them (Waldrep Reference Waldrep2009). Elizabeth Freeman, a white suffragette investigating the lynching of Jesse Washington for the NAACP, found herself tailed, her room searched, and threatened with arrest once locals suspected the reason for her visit (Bernstein Reference Bernstein2006, 139). Towns also used other means to keep news of lynching from traveling. Following the same lynching in Waco, local photographers sold souvenir postcards showing the lynching. But when the lynching attracted national notoriety, the photographers “quit selling the mob photos … because [the] ‘City dads’ objected on the grounds of ‘bad publicity,’ [and] as [they] wanted to be boosters and not knockers, [they] agreed to stop all sale” (Bernstein Reference Bernstein2006, 160). When two men were lynched in Canton, Mississippi, in 1939, the town’s mayor (and newspaper editor) prevented the story from appearing in print, keeping the event hidden until the publication of an NAACP exposé (Waldrep Reference Waldrep2009). By the 1930s, anti-lynching activists were worried that they had successfully “stopped” lynching only by driving it underground (Waldrep Reference Waldrep2000).
At the same time, Southern politicians, economic elites, and newspaper editors grew increasingly concerned about how lynching damaged the reputation of the South. Worried about losing investment and new migrants, Southerners accused Ida Wells of lynching of working for Western land developers and Northern industrialists to tarnish the South’s reputation (Schechter Reference Schechter2001, 106). Even though many Southerners thought the criticism was unwarranted, they nevertheless backed efforts to stop lynching in order to improve the reputation of their communities and states (Brundage Reference Brundage1993; Silkey Reference Silkey2015).
TESTING THE ARGUMENT
While the historical evidence illustrates the important role played by the expansion of reach and inclusivity in transforming the debate about lynching, is it corroborated by statistical evidence? The growth of publicity I describe above took place monotonically over time and simultaneously with other transformations that may have changed discourse about lynching, like the transition to capital-intensive agriculture, the institutionalization of Jim Crow, and growing labor mobilization. Thus, it is difficult to test this argument at the national level.
Instead, I focus on sub-national variation in exposure to rising publicity. While communication technology did not solely cause increasing publicity, access to communication networks likely determined differential exposure to national publicity. For instance, the telegraph permitted news to be shared instantaneously, and railroads permitted newspapers and reporters to share news via the mail where telegraph was unavailable or too expensive (Kielbowicz Reference Kielbowicz1989) and also brought the movement of more people through a county, resulting in greater coverage. Drawing on this insight, I derive observable implications of my argument that should vary sub-nationally at the level of the lynching event. This narrow focus helps set aside the many other explanations for changes in discourse about lynching that operate over the long term.
If communication and transportation technologies determine exposure to publicity, access to communication networks must increase coverage, offsetting any effects of distance. Thus, I expect:
1. The probability that a lynching is reported in a newspaper increases as railroad transportation time between the lynching and the paper decreases.
2. The probability that an incident of lynching reaches a larger/national audience increases when the lynching occurs in a place better connected to communication and transportation networks.
Based on my argument, public criticism of lynching should occur in places more distant from lynching because those audiences are potentially less receptive to justifications for the violence and critics may more safely speak at a distance. Thus,
3. Criticism of a lynching increases with geographic and/or cultural distance between the community where the lynching took place and the location of the newspaper.
Finally, if negative publicity for lynching increases the reputational costs of lynching, then:
4. Lynching should have declined faster in places with more potential exposure to publicity.
DATA
To test these claims, I compile data on lynchings, discourse about lynchings, and communication and transportation infrastructure.
Lynchings
As of the writing of this paper, there is no authoritative national database of lynchings (but see Cook Reference Cook2012; Seguin Reference Seguin2016). As a result, different regions of the country have different levels of coverage. Drawing on several sources (SA Section D.1), I compile lynching events from 1880 onwards. Most of the lynchings recorded come from newspaper reports (Pfeifer Reference Pfeifer2011; Tolnay and Beck Reference Tolnay and Beck1995). Thus, there are almost certainly events that are excluded because they never appeared in the press. While this prevents me from examining variation in whether lynchings were reported at all, there was wide variation in the amount of coverage lynching received.
Coverage and Discourse
In order to measure both the extent and content of press coverage of lynchings, I develop a novel dataset of historical newspaper issues. Drawing on several online digital archives, these data comprise more than nine million unique newspaper issues from thousands of different newspapers—ranging from big-city dailies to small-town weeklies—between 1880 through 1940.Footnote 5 This contrasts with previous investigations of press discourse, including those on lynching (Seguin Reference Seguin2016), which typically consider one or a few major daily papers.
These data offer great breadth at the cost of depth: it is impossible to carefully read all of the content and computer transcription errors foreclose the use of more sophisticated text analyses. This trade-off is necessary in order examine spatial and temporal variation in coverage of and discourse about lynching. I measure the presence and content of lynching coverage using the keywords and phrases pertaining to lynching and the different arguments and narratives used to justify or criticize the practice. Newspaper issues have “coverage” of lynching if it contains words intrinsic to or synonymous with lynching within seven days of an event. Lynching was mentioned on 1.2 million news pages between 1880 and 1940. The content of lynching coverage is coded along a pro- and anti-lynching spectrum derived from keywords and phrases. Because of imperfect mapping between keywords and their contextual meaning, I identify keywords and phrases pertaining to six different pro- and anti-lynching discourses, combine them into one index, and validate them against manual codings of the same discourses (See SA Section D.4). The pro- and anti-lynching indices are produced using the following equation:
 $$Discours{e_k} = \left( {\sum\limits_{i = 1}^{{n_a}} {AntiLynching\;Wor{d_{ik}}} } \right) - \left( {\sum\limits_{j = 1}^{{n_p}} {ProLynching\;Wor{d_{jk}}} } \right).$$
For a given article k, this computes the discourse score as the difference between sum of anti-lynching dictionary words and the sum of pro-lynching dictionary words (Grimmer and Stewart Reference Grimmer and Stewart2013). Thus, n a and n p are the total number of keywords in the anti- and pro-lynching dictionaries. Word ik and Word jk indicate whether word i or j is present (1) or absent (0) in article k. In analyses, I transform this into a z score for purposes of interpretation. Because this measure tends toward zero as the number of matched keywords approaches zero, I include dummies for the total number of matched keywords in all models that employ this variable.
Communication Networks
I measure access to communication and transportation networks as integration into railroad networks. While the availability of telegraph is also fundamentally important, data on telegraph access is limited (cf. Garcia-Jimeno, Iglesias, and Yildirim Reference Garcia-Jimeno, Iglesias and Yildirim2018; Honsowetz Reference Honsowetz2015). But railroad access is important as a direct measure of informational transfer and as a proxy for the telegraph. First, Kielbowicz (Reference Kielbowicz1989) shows that railroad continued to be an important means by which newspapers gathered information well after the rise of the telegraph. Second, the vast majority of telegraph lines and stations were located along railroads (Honsowetz Reference Honsowetz2015). Integration into railroad networks thus serves as a proxy for centrality in telegraph networks.
The most complete and useful form of rail data available comes from Perez-Cervantes (Reference Perez-Cervantes2014). Based on maps of railroad construction projects, it includes lines added in each year between 1840 and 1900, making it possible to develop annual county-level rail networks. The central limitation is that this data ends in 1900, whereas the data on lynchings and press coverage extends through the 1930s. Rail networks in the United States had nearly reached their peak by 1911, and rate of railroad growth was greatest prior to 1900 (Atack Reference Atack2013). For this reason, I use the network data for 1900 for the years 1901 to 1910, but show that the results are substantively unchanged when restricting the analysis to 1880 through 1900.
I use these data to produce a network of counties linked by rail from centroids to centroids. This simplification is a useful expedient to drastically reduce the computation of network centrality and distance measures (See SA D.2). I use this county network to construct estimates of the rail network centrality of counties in each year. In the study of networks, there are several different measures of “centrality”; because they each capture something different, I consider two different conceptions of centrality:Footnote 6
1. Betweenness centrality: the number of times a county appears on the shortest paths between pairs of other counties.
2. Eigenvector centrality: the “influence” of a county based on connections to other counties with many rail connections.
Using the same data and data from (Atack Reference Atack2013) on navigable rivers and canals, I calculate the travel time between a lynching event and a newspaper in the absence of railroads and travel time in the presence of railroads.
Other Data
I also compile county-level data on population, demographics, and manufacturing and agricultural output from the United States Censuses between 1870 and 1940. These data are matched to 2000 county boundaries and the intercensal years are estimated using linear interpolation (SA D.5).
DESIGN
Using the data described above, I examine the implications of my argument. To examine the presence and content of coverage for lynchings (implications 1 through 3), I created data composed of dyads of lynching events and all digitized newspaper issues that are published within a week of the lynching event. Based on a sample of 34 lynchings manually investigated, 80% of coverage occurs within one week.Footnote 7 An issue gives a lynching “coverage” when it mentions lynching in the week following the event. Using data from 1880 to 1910, this yields 3,231 lynchings from 1,239 counties matched to 3.7 million newspaper issues from 5,873 newspapers and 1,139 counties. This yields a total of 9.9 million dyads that include covariates for both the lynching and publication county. This data includes both issues with coverage and without, so it captures the changing denominator of how many digitized newspapers were available at different points in time. When examining content, this data is restricted to lynching-issue dyads in which “coverage” occurs.
When estimating the effects of railroad network access and travel times on lynching coverage, there are three major threats to drawing causal inferences.
1. Increasing rail density and decreasing travel times are correlated with the passage of time. To account for time trends, I include year fixed effects. This approach eliminates any confounding due to alternative explanations for changing discourse about lynching that shifted nationally over time including the gradual emergence of capital-intensive agriculture in the South, the rise of social gospel, and increasing concern about labor unrest, almost all of which occurred after the period I examine.
2. The construction of rail lines to places was likely a function of preexisting attributes of those places, which might bias estimates. It may be the case that places with larger populations or economic activity were both more attractive for railroads and simultaneously more newsworthy. I address this in three ways. First, I include fixed effects for lynching-counties in all specifications to account for any time-invariant attributes of counties that correlate with rail investment. Second, I also include controls for logged population, urban population, agricultural output, and manufacturing output because counties might become more attractive for railroads and the news over time. Third, I explicitly control for endogenous railroad construction by including dummies for degree centrality (the number of rail connections between a county and its neighbors).
3. Travel time between lynching counties and publication counties could also be a result of attributes of the publication county. And coverage of lynching could be a function of attributes of local newspapers. For instance, some towns may have greater interest in distant events because of their economic importance. Thus, in the analyses of dyad data, I include publication fixed effects as well as logged population, urban population, and agricultural and manufacturing output for the county of publication.
Equation 2 represents the most general model estimated using this dyad data.
 $$\displaylines{ {Y_{ijt}} = {\alpha _{year}} + {\alpha _i} + {\alpha _j} + \delta \cdot {\bf{Centralit}}{{\bf{y}}_{{\bf{it}}}} + \cr \beta \cdot {\bf{Distanc}}{{\bf{e}}_{{\bf{ijt}}}} + \gamma \cdot {{\bf{X}}_{{\bf{it}}}} + \lambda \cdot {{\bf{W}}_{{\bf{jt}}}} + \cr {\varepsilon _i} + {\varepsilon _j}. \cr}$$
In this equation, i is a lynching event, j is a newspaper, and t is a day within a week following a lynching. Y ijt is a binary indicator for whether an issue from paper j and on day t published an article that explicitly mentioned lynching. αyear is a fixed effect for each year; αi is a fixed effect for the county where the lynching occurred; and αj is a fixed effect for newspaper j. Centralityit is the network centrality (betweenness or eigenvector) for the county in which lynching i occurred at time t. Both centrality measures are highly skewed. I break both into decile dummies and log betweenness centrality.Footnote 8 Distanceijt is the distance between the county of lynching i and the county of newspaper j. Xit and Wjt are vectors of covariates for the lynching and publication county, respectively. Because these represent dyads of lynching counties and publication counties, I cluster standard errors by both lynching county and publication county (εi, εj).
To examine the effects of increased exposure to publicity on the incidence of lynching, I estimate equation 3. This is a county-year panel model from 1880 to 1900 with county and year fixed effects, where Y it is a dummy for any lynching in county i and year t. Potential publicity is measured as “media access”: access to daily newspaper circulation weighted by travel time.Footnote 9 This is similar to the use of travel-time in the coverage models. X it includes logged county population, urban population, agricultural and manufacturing output, as well as percent black, percent urban, and rail degree centrality. I also estimate this model replacing county fixed effects with a lagged dependent variable.
 $$AnyLynchin{g_{it}} = {\alpha _i} + {\alpha _t} + {\beta _1} \cdot Acces{s_{it}} + {{\bf{X}}_{{\bf{it}}}}\gamma + {\varepsilon _{i}}}.$$
RESULTS
Networks
Did increasing connection to rail networks lead to greater coverage of lynching? I first estimate equation 2 for betweenness centrality (logged and in deciles) and eigenvector centrality (in deciles). Figure 1 shows the results of these analyses across three different sets of covariates. The baseline model (no additional covariates) shows that a 50% increase in betweenness results in a 0.1 percentage point change in coverage for lynchings (p = 0.011). The middle panel shows the relative percentage point change in probability of coverage from increasing betweenness compared to the bottom decile. Using the baseline specification, lynchings that occur in the top 7th, 8th, 9th, and 10th deciles are 2.9 (p < 0.001), 2.7 (p < 0.001), 3.2 (p = 0.003), and 3.6 (p = 0.002) percentage points more likely to be reported. The results are similar for eigenvector centrality. The bottom panel shows lynchings occurring in counties in the top decile of eigenvector centrality are 4.1 (p = 0.017) percentage points more likely to receive coverage.
Lynching Coverage and Rail Network Centrality.
Note: This figure shows the effects of betweenness centrality and eigenvector centrality on coverage using data from 1880 to 1910. Baseline models include lynching county, publication county, and year fixed effects. N is 9,927,448, across 3231 lynchings in 1239 counties and 5873 newspapers in 1139 counties. Covariate models add logged population, urban population, and agricultural and manufacturing output for lynching and publication counties. Full models add dummies for rail degree centrality. N is 8,802,073, across 3018 lynchings in 1111 counties and 5468 newspapers in 1063 counties. Standard errors clustered by lynching and publication county.

These effects are relatively large in magnitude: per the estimates, moving into the 7th through 10th decile of betweenness centrality or into the top decile of eigenvector centrality offset the reductions in coverage associated with being between 2,400 and 3,000 miles away, respectively. A 50% increase in betweenness centrality (in this period, the median county saw a 290% increase) yielded an increase in coverage comparable to a 5% decrease in distance (See SA A.1).
The effects of betweenness centrality are robust in several ways. First, SA section B.1.4 shows that the effects of increased centrality on coverage are not concentrated locally but across a range of distances. Second, the results are robust to the inclusion of economic and demographic covariates for both lynching and publication counties and conditioning on local railroad construction (Figure 1). These results are similar in magnitude and significance when considering different ranges of years, different samples of lynching, different sets of newspaper archives, and using different windows for defining coverage (SA B.1). Moreover, the results are similar when using lynching-events rather than dyads as the unit of analysis (SA B.1.3). By contrast, while moving into the highest decile of eigenvector centrality is consistently associated with higher coverage, this effect is less robust and varies in magnitude and significance depending on specification.
An additional implication of my argument about technology and publicity is that reductions in rail travel time, holding distance constant, between a lynching and a newspaper should increase coverage of a lynching. I regress coverage on logged travel time (without railroads) and the logged travel time with railroads.Footnote 10 Table 1 reports the results of these analyses. In all specifications, rail travel time is highly significant (p < 0.001) and more than offsets the effects of non-rail travel time, even when including fixed effects, demographic and economic covariates, and measures of local railroad construction. Halving non-rail travel time increases coverage 0.4 (p < 0.001) percentage points, but halving rail travel time increases coverage by 1 percentage point (p < 0.001).
Effects of Travel Time on Coverage Rate

*p < 0.05; **p < 0.01; ***p < 0.001.
Estimates obtained using OLS, with standard errors clustered by lynching and publication county.
Taken together, these results show that access to railroad and telegraph increased the reach of publicity about lynching, potentially mobilizing new critical audiences and creating spaces from which African American critics organized a sustained public campaign against the practice. Were the effects of network access cumulative? Tables A.1 and A2 (SA) show that when including both network measures and rail travel time in the model, betweenness centrality and railroad travel time independently affect coverage rates (p < 0.01, p < 0.001).Footnote 11 How certain can we be that the railroad and telegraph actually caused the movement of information? Using strikes and railroad accidents that disrupted service as instruments for railroad and telegraph networks, Garcia-Jimeno, Iglesias, and Yildirim (Reference Garcia-Jimeno, Iglesias and Yildirim2018) find that exposure to distant places via both railroad and telegraph increased reporting of Temperance protests in those distant places and the diffusion of protest itself. This provides strong causal evidence for my claim that railroad and telegraph access increased the reach of publicity.
Content
Did expanding the reach of publicity for lynching produce more criticism? Drawing on the subset of the dyad data in which newspapers covered lynching, I examine whether coverage of lynching is more critical at a distance. Figure 2 shows the mean prevalence of anti-lynching over pro-lynching keywords in coverage across distance residual on the number of matching keywords. There is a clear pattern: more distant coverage is more critical. This relationship between distance and criticism could result from lynching events with spectacular violence generating both more distant and more critical coverage, particular newspapers taking consistent position on lynching, or trends over time to more distant and more critical coverage. Yet, as Table 2 shows, even when including dummies for number of keywords found, fixed effects for unique lynching events, or fixed effects for year, distant coverage of lynching is significantly more critical.Footnote 12
Anti-Lynching Discourse by Distance From Lynching Event.
Note: This figure shows the mean scaled anti-lynching discourse in newspaper coverage of lynchings in 100-mile bins for all coverage within 14 days of a lynching. These means are residualized on the total number of matching keywords.

Anti-lynching Discourse Over Distance

*p < 0.05; **p < 0.01; ***p < 0.001.
Estimates obtained using OLS, with standard errors clustered by lynching and publication county. N is 2,528,586 for all models.
These effect sizes (in columns 1 and 2 of Table 2) appear small: linearly increasing distance by 1,000 miles is associated with a 0.03 SD increase in anti-lynching discourse (p < 0.001, model 1). Moving from 100 to 1,000 miles away from a lynching is associated with a 0.05 SD increase in anti-lynching discourse index (p < 0.001, model 2). To meaningfully understand the magnitude of these results, I estimate the difference in discourse between white and African American papers, which strongly condemned lynching (Waldrep Reference Waldrep2009; Wood Reference Wood2009). Estimating models 1 and 2 including a dummy for African American papers, I find that African American newspapers were more critical of lynching having 0.09 and 0.1 standard deviations more anti-lynching than pro-lynching keywords (p < 0.001), while the effects of distance were unchanged. Compared to local papers, discourse about lynching in white newspapers 1,000 miles away was between a third and a half as critical as African American newspapers.
Lynching Events
Based on my argument, increasing publicity and criticism of lynching means that local officials and business elites would have had strong incentives to prevent or stop lynchings when they were at greater risk of exposure to publicity.
Using data on county-years from all states with academic sources for lynching events between the years 1880 and 1900, I regress the incidence of any lynching on access to daily newspaper circulation (equation 3). Table 3 shows that across different sets of covariates and fixed effect versus lagged dependent variable specifications, increasing access to daily circulation reduces the probability of a lynching. The median county in this sample saw a twofold increase in access to circulation in this time, which corresponds to between a 0.3 percentage point (model 4) and 4.2 percentage point (model 3) decline in the probability of any lynching (p < 0.001), which are large effects relative to the county-year probability of a lynching (2.7%). One might be concerned that this is capturing exposure to audiences in the same state, not external audiences, but Table B.3 (SA) shows that the results are slightly stronger when considering only access to out-of-state newspaper circulation. Similarly, it could be that access to high circulation newspapers is a proxy for access to more population and thus is not about information reaching audiences. However, “population access” has no clear relationship with lynching (SA Tables B.2 and B.3), and conditioning on population access does not diminish the effect of media access. These results are robust to restricting the analysis to only the South, considering different time periods, and to estimating the model using logit with random effects (See SA B.3).
Effects of Log Access to Newspaper Circulation on Probability of Lynching

*p < 0.05; **p < 0.01; ***p < 0.001.
Estimates obtained using OLS, with standard errors clustered by county.
Overall, this provides suggestive evidence that increasing publicity and the growth of its attending costs may have actually stopped lynchings in an era when lynching was actually becoming more frequent. However, did greater risk of publicity actually reduce violence or, as anti-lynching activists feared (Waldrep Reference Waldrep2000), did it simply push it underground? One way to address this is to examine whether publicity reduced attempted lynchings (which might shift underground) or reduced the success of lynching attempts (which would not). Using data on successful and thwarted lynchings for three states (Hagen, Makovi, and Bearman Reference Hagen, Makovi and Bearman2013), I estimate the direct effect of media access on successful lynchings and its indirect effect through attempted lynchings. While most of the effect is through reductions in lynching attempts, media access directly reduced the success of mobs. This suggests publicity probably reduced, rather than concealed, violence (SA A.2).Footnote 13
CONCLUSION
How does non-state violence become publicly unacceptable? In this paper, I have argued that transformations in publicity disrupt local justifications for violence. When the reach of publicity expands, new, distant audiences may condemn violence without fear of reprisal from perpetrators. This provides opportunities for victims and their allies to challenge both the factual and normative frames invoked by perpetrators to justify their actions. And I show using historical and statistical evidence that the expansion of both the reach and inclusivity of publicity played a pivotal role in undermining public support for lynching in the United States. At a theoretical level, the mechanisms of publicity I propose contribute to our understanding of how forms of violence become legitimated and de-legitimated. The data and methods I employ in my analyses provide a framework for how arguments about changes in public discourses about violence may be evaluated in other contexts. Finally, I expand on the work of historians (Bernstein Reference Bernstein2006; Brundage Reference Brundage1993; Campney Reference Campney2013; Waldrep Reference Waldrep2009) by providing both a theoretical argument for why and further empirical evidence that expanding publicity, alongside changes in agricultural labor practices, the rise of Jim Crow, and labor unrest, was an important cause of public opposition to and the decline of lynching.
My evidence for the importance of publicity comes from the case of lynching in the United States, but is the argument likely to travel? What are the attributes of “legitimate” violence that make them vulnerable to expanding publicity? To provide an answer, I conceive of the violence in two dimensions. Along one dimension, violence is categorized by the type of perpetrator: from violence perpetrated by states to violence perpetrated by non-state actors; along the other dimension is the direction of change: violence can lose or gain legitimation. The argument I make above about publicity addresses the de-legitimation of non-state violence. Within these cases, increasing publicity is likely to be consequential to the de-legitimation of non-state violence when three important conditions obtain.
First, the spatial distribution of the violence is relatively “local.” If there is no place “outside” of where the violence occurs, then increasing the reach of publicity will be difficult to achieve and will not result in bringing news of violence to new, potentially critical audiences. Second, there must be a substantial power disparity between victims and perpetrators of violence. If there is little power disparity, victims have other options. Local protests or mobilizing other local resources may be effective and sufficient means to undermine justifications for the violence. Third, local elites must care about their reputation among new audiences. In order for publicity to lead local elites to condemn or stop violence, they must face some costs to doing otherwise. Local elites are far more likely to value their reputations among new audiences when: the audience is composed of perceived peers or equals (Terman and Voeten Reference Terman and Voeten2018); it has important economic ties with the local elites; or it shares a higher jurisdiction with the locality. These three conditions seem most likely to obtain within nation-states during periods of national consolidation.
Shared jurisdictions are particularly important to understanding both why attempts at “naming and shaming” in international politics are not always successful and why the anti-lynching movement, in part, was. Francis (Reference Francis2014) contends that the NAACP’s publicity work challenged justifications of lynching, but argues that the NAACP shifted to anti-lynching legislation and court challenges because their publicity efforts failed to bring a stop to lynching. My argument suggests that publicity and institutional approaches were not alternatives and instead complementary (albeit unintentionally). The first efforts at federal anti-lynching legislation pre-dated the NAACP and failed to make much progress (Burns Reference Burns2010). But the Dyer and subsequent anti-lynching bills were pursued alongside NAACP publicity campaigns that used investigations and national press releases to call out local politicians and elites where lynchings occurred (Waldrep Reference Waldrep2009). This double threat amplified reputational costs to Southern leaders because continued publicity of lynching could have built political will for federal intervention in the South. These fears ultimately drove local anti-lynching laws and efforts to thwart mobs (Brundage Reference Brundage1993, 189–190, 238).
And Southern elites were right to be afraid; there were several attempts to pass federal anti-lynching legislation between 1922 and 1937. Schickler (Reference Schickler2016) and White (Reference White2016) show that by 1937 public opinion strongly supported federal anti-lynching legislation. While this paper does not engage with variation in this public support, it provides an account of how public discourses and narratives about lynching were transformed in the preceding decades, making broad support for federal intervention possible, if not ultimately effective.
This shift in public opinion highlights a further caveat. The argument I make regarding publicity and norms about violence appears consonant with well-known arguments on public discourse and changing ethical and moral standards (Habermas Reference Habermas1991; Pinker Reference Pinker2011). In the light of proliferating forms of potentially global publicity enabled by the internet, does my argument imply ineluctable progress against the acceptability and incidence of violence? There are two reasons to be circumspect.
First, the mechanisms of reach and inclusivity that I identify may, under some conditions, increase public legitimation of violence. Perhaps the starkest counterexample to my argument about growing publicity and the de-legitimation of violence is the simultaneous expansion of mass media and rise of Nazi propaganda justifying anti-Semitic violence in inter-War Germany. But, the mechanism of inclusivity helps make sense of these events. Examining the effects of radio propaganda in Weimar and Nazi Germany, Adena et al. (Reference Adena, Enikolopov, Santarosa and Zhuravskaya2015) show that when public broadcasts became drastically less inclusive under the Nazis, support for the Nazis and participation in violence against Jews increased. Even though technology increased the reach of news, Nazi control over the media silenced the victims and opponents of violence, hampering challenges to the justifications produced by the Nazi regime.
Second, the extent to which justifications for violence can be challenged and the reasons why violence is condemned hinge on “discursive opportunity structures” (McCammon et al. Reference McCammon, Newman, Muse and Terrell2007) or the kinds of arguments that might resonate with new audiences. Many white Americans found condemnations of lynching on the basis of “law and order” persuasive because this appealed to values consonant with the status quo (Hill Reference Hill2009; Jost and Andrews Reference Jost and Andrews2011). But W. E. B. Du Bois’s claim that “the police is the mob. The courts are the lynchers” (Du Bois Reference Du Bois1921) was an indictment of state itself, and thus too radical (Hill Reference Hill2009; Waldrep Reference Waldrep2009). While there is no statistical evidence that legal executions substituted for lynching (Beck, Massey, and Tolnay Reference Beck, Massey and Tolnay1989), many anti-lynching activists feared that an emphasis on “law and order” would lead “legal-lynching” by courts (Waldrep Reference Waldrep2000) and foreclose a more expansive critique of a system of racial violence that was in part administered by the state, such as Du Bois’s. And, NAACP legal successes on due process protections notwithstanding (Francis Reference Francis2014), these fears came to pass (see, e.g., Weaver Reference Weaver2007).
This paper opens the door to further research on publicity and changing norms about violence. First, while I provide evidence for several of the mechanisms in my argument, more work is needed to evaluate the effects of condemnation of lynchings by distant audiences on both local rhetorical opposition to and practical steps against lynching. Showing that such effects exist would bolster the argument I make about reputational costs. And investigating how these effects depend on attributes of local leadership, the critical audiences, and the relationship between the two would clarify the scope conditions for when expanding publicity might actually change local norms and practices and when it might not.
More generally, further work must be done to examine the contexts in which changes in publicity are relevant for changing evaluations of violence. Could expansions of reach and inclusivity also de-legitimize violence perpetrated by states? Do the effects of publicity depend on particular communication technologies? For instance, whereas inexpensive printing technology at the turn of the twentieth century, paralleling the internet today, made access to larger audiences more inclusive, television and radio broadcasting were more capital intensive and may have limited access to publicity for challengers to the status quo. Finally, can shifts in publicity be used to legitimize violence, and if so, how? This paper shows the need for greater attention to how publicity and public discourses about violence constrain or enable perpetrators and to how that triggers struggles over facts and norms in the public sphere.
SUPPLEMENTARY MATERIAL
To view supplementary material for this article, please visit https://doi.org/10.1017/S0003055418000886.
Replication materials can be found on Dataverse at: https://doi.org/10.7910/DVN/QTOIQF.


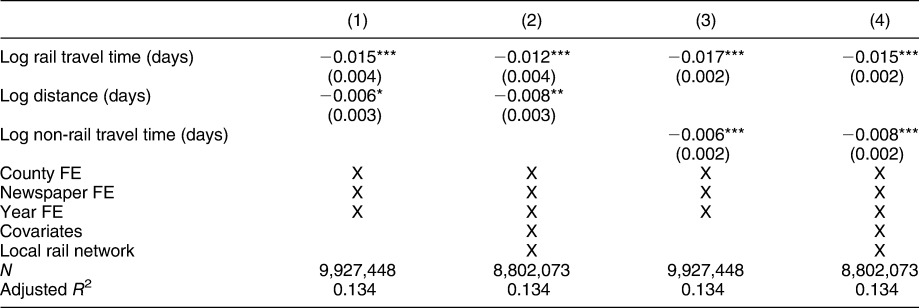
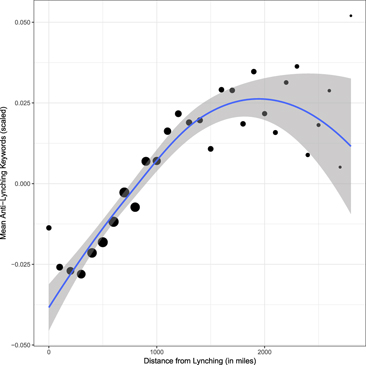
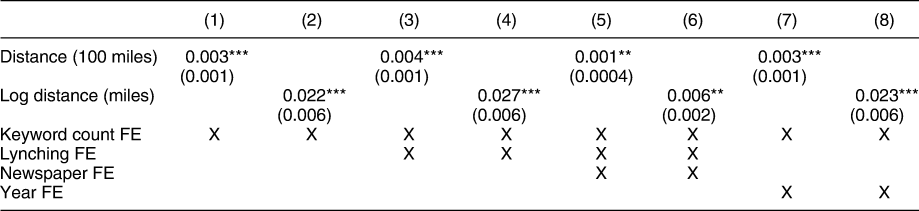
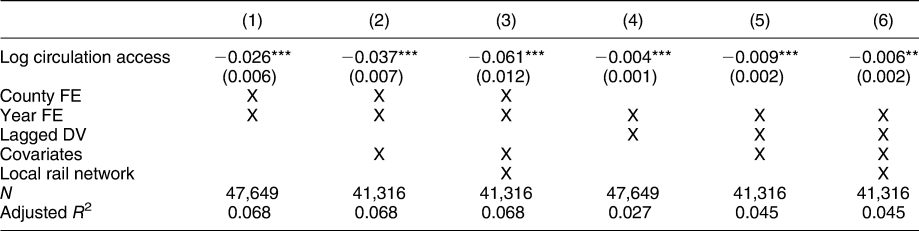




Comments
No Comments have been published for this article.