

Introduction
As the global increase in the prevalence of dementia is presenting key health and social challenges, the National Health Service of England (NHS England, 2015a) published a report on dementia diagnosis and management, stating that primary care settings should appropriately diagnose dementia. Emphasizing that dementia is a slowly progressive disease, a two-step process for assessing dementia was proposed in which the first screening used a standardized tool to distinguish depression, delirium, drugs, and memory changes due to natural aging, and then the cause of dementia was identified (Stähelin, Monsch & Spiegel, Reference Stähelin, Monsch and Spiegel1997). In this process, the Six-Item Cognitive Impairment Test (6-CIT) was suggested as one of the tools that could be used as a dementia screening tool in primary care settings (NHS England, 2015a).
The 6-CIT is a very brief dementia screen test developed in 1983 by Katzman et al., and consists of six items: three questions asking for the year, month, and time, listing the months of the year backwards, the name and address memory phrase, and counting down from 20 to 1. It takes 3–4 min to perform and covers several cognitive domains such as orientation, memory, and concentration. Additionally, it is easy to interpret because a score of 8 or higher indicates significant dementia. The questions are so clear that they can be used without error when translated into languages from other cultures; therefore, even those who are not physicians can easily use them with minimal training (Katzman et al., Reference Katzman, Brown, Fuld, Peck, Schechter and Schimmel1983).
NHS England emphasized the need to assess dementia first in primary care (NHS England, 2015a), but this is also required in acute care hospitals (Timmons et al., Reference Timmons, Manning, Barrett, Brady, Browne, O’Shea and Linehan2015). Dementia patients often receive acute care without a prior diagnosis. Hospitals also need screening tests for assessing cognitive impairment in older adult inpatients (O’Sullivan, O’Regan & Timmons, Reference O’Sullivan, O’Regan and Timmons2016). It also provides the benefit of avoiding potential safety issues in the course of care or during discharge (Timmons et al., Reference Timmons, Manning, Barrett, Brady, Browne, O’Shea and Linehan2015). Because of its brevity and simplicity, the 6-CIT can be efficiently used in both primary and secondary care settings as well as community (NHS England, 2015b).
The 6-CIT has been used to screen for cognitive function (Alves Apóstolo et al., Reference Alves Apóstolo, Malgorzata Bobrowicz-Campos, Carvalho dos Reis, Justo Henriques and Veiga Correia2018), but unlike the Mini-Mental State Examination (MMSE), its diagnostic performance for dementia screening has not been quantitatively reviewed (O’Sullivan et al., Reference O’Sullivan, O’Regan and Timmons2016). This study, which was based on the existing studies comparing the 6-CIT with the MMSE and other screening tools, was conducted to analyze the predictive validity of the 6-CIT as the first step in dementia screening.
Methods
This study was conducted according to the guidelines of the Cochrane Handbook for Systematic Reviews of Diagnostic Test Accuracy (Bossuyt, Davenport, Deeks, Gatsonis & Wisniewski, Reference Bossuyt, Davenport, Deeks, Gatsonis and Wisniewski2013) and the Preferred Reporting Items for Systematic Reviews and Meta-Analyses (PRISMA) 2020 Statement (Page et al., Reference Page, McKenzie, Bossuyt, Boutron, Hoffmann, Mulrow and Moher2021).
The MEDLINE, Embase, CINAHL, and PsycArticles databases were searched on August 17, 2021. The key search terms were dementia and 6-CIT. In dementia, MeSH terms for each type of dementia were used, and in the 6-CIT, free text was used. An example of the search strategy is provided in Supplementary Table 1.
The inclusion criteria were as follows: (i) types of studies: studies (e.g., cohort and cross-sectional studies) that reported diagnostic accuracy results; (ii) types of participants: studies that targeted patients with mild cognitive impairment (MCI) or any type of dementia; (iii) indexed tests: studies using the 6-CIT. The cutoff scores of the 6-CIT have applied the values suggested in each study; (iv) gold standards: studies in which dementia or cognitive impairment was diagnosed using international guidelines such as the Diagnostic and Statistical Manual of Mental Disorders (DSM), the International Classification of Diseases, Tenth Revision (ICD-10), or Petersen’s criteria (Petersen et al., Reference Petersen, Smith, Waring, Ivnik, Tangalos and Kokmen1999); (v) types of outcomes: studies reporting true positive (TP), false positive (FP), false negative (FN), and true negative (TN) results that could be used to calculate sensitivity and specificity. Age and language were not limited in the literature search process.
The quality of the selected studies was assessed using the Quality Assessment of Diagnostic Accuracy Studies-2 (QUADAS-2). The following information was extracted from the selected literature: year of publication, author, location, setting, age, sample size, the gold standard, blinding, cutoff scores for the 6-CIT and other tools, and TP, FP, FN, and TN values.
The meta-analysis was conducted using MetaDiSc 1.4 (Zamora, Abraira, Muriel, Khan & Coomarasamy, Reference Zamora, Abraira, Muriel, Khan and Coomarasamy2006) and the Meta DTA program (Freeman et al., Reference Freeman, Kerby, Patel, Cooper, Quinn and Sutton2019; Patel, Cooper, Freeman & Sutton, Reference Patel, Cooper, Freeman and Sutton2021). Based on the TP, FP, FN, and TN described in the 2 × 2 contingency table, screening accuracy was evaluated by yielding pooled sensitivity, and specificity with 95% confidence intervals (CIs). The data were analyzed with a bivariate random effect model. The summary receiver operating characteristic (sROC) curve statistics were presented graphically through the area under the curve (AUC). The AUC values were interpreted as follows. An AUC of 0.5 was a non-informative test, 0.5 < AUC ≤ 0.7 was low accurate, 0.7 < AUC ≤ 0.9 was moderate accurate, 0.9 < AUC < 1 was high accurate, and an AUC of 1 was a perfect test (Greiner, Pfeiffer & Smith, Reference Greiner, Pfeiffer and Smith2000). The Q* value represents the point at which sensitivity and specificity are equal in the sROC curve, with a value of 1 indicating accuracy of 100% (Walter, Reference Walter2002).
Results
Selection process and risk of bias
A total of 2,189 papers were found in the four databases. Of them, 764 studies were duplicated, and the inclusion and exclusion criteria were applied to 1,425 studies. After excluding 1,418 (99.5%) studies, seven studies were selected for inclusion in the study. The study selection process is detailed in the PRISMA 2020 flow diagram (Fig. 1).
Flow diagram of article selection. This flow diagram developed by Preferred Reporting Items for Systematic Reviews and Meta-Analysis 2020. Figure 1 depicts the flow of information through the different phases of a systematic review. It maps out the number of records identified, included and excluded, and the reasons for exclusions.

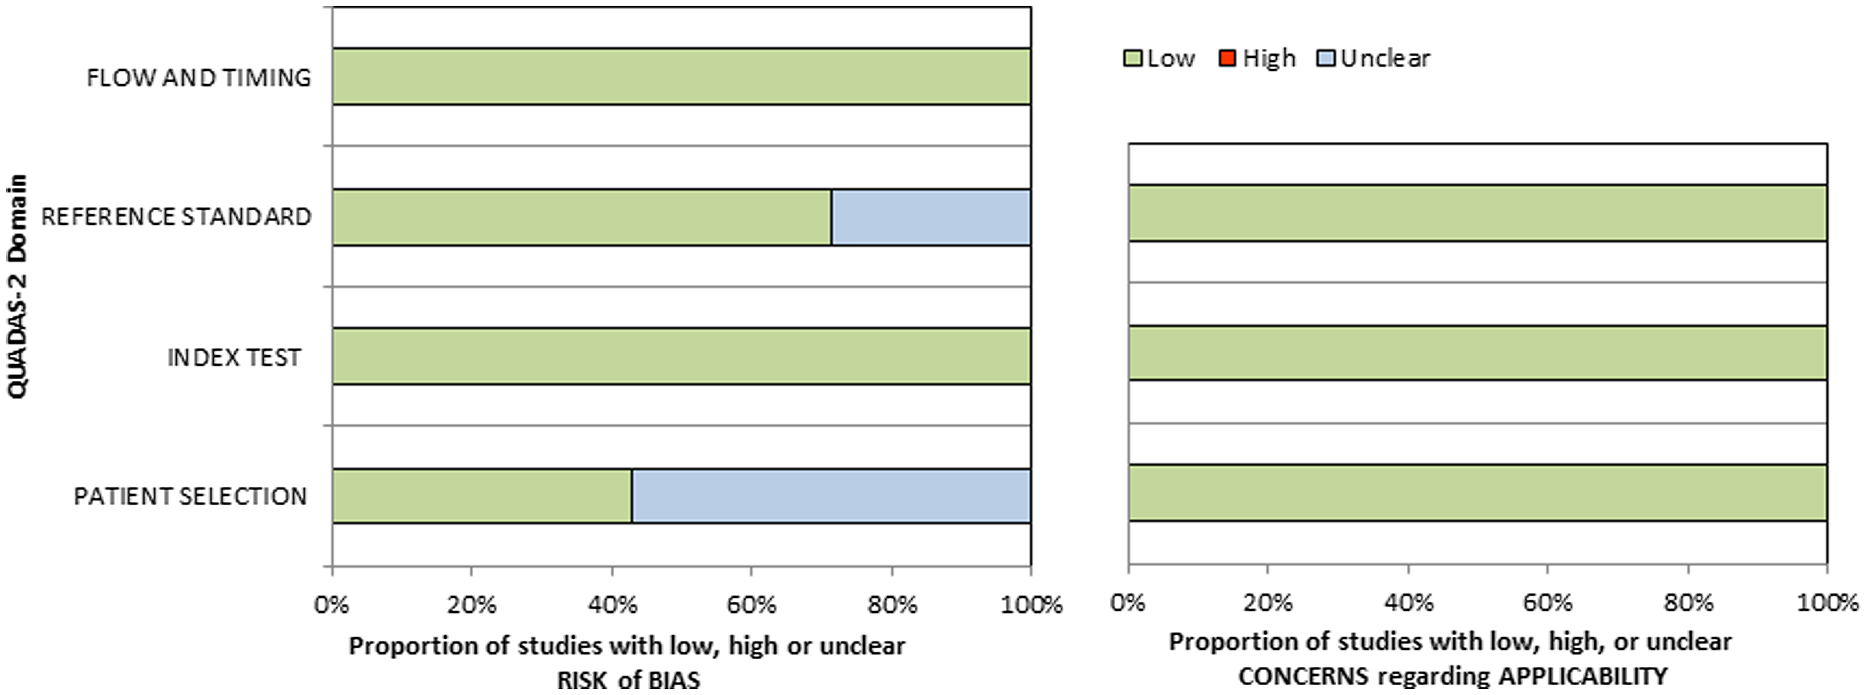
As a result of assessing the quality of the selected studies, three studies (Abdel-Aziz & Larner, Reference Abdel-Aziz and Larner2015; Hessler et al., Reference Hessler, Schäufele, Hendlmeier, Nora Junge, Leonhardt, Weber and Bickel2017; Larner, Reference Larner2021) were found to have a low risk of bias in all domains and items. In the patient selection domain, three studies were random samples (Hessler et al., Reference Hessler, Schäufele, Hendlmeier, Nora Junge, Leonhardt, Weber and Bickel2017) or consecutive samples (Abdel-Aziz & Larner, Reference Abdel-Aziz and Larner2015; Larner, Reference Larner2021) and the rest were unclear. Five studies (Abdel-Aziz & Larner, Reference Abdel-Aziz and Larner2015; Hessler et al., Reference Hessler, Schäufele, Hendlmeier, Nora Junge, Leonhardt, Weber and Bickel2017; Larner, Reference Larner2021; O’Sullivan et al., Reference O’Sullivan, Brady, Manning, O’Shea, O’Grady, O’Regan and Timmons2018) on which blinding was performed had a low risk of bias in the index test domain and the reference standard domain. All studies were assessed as low risk in flow and timing and the application of each domain because the same tests were performed on the patients (Fig. 2).
Quality assessment results of the selected studies by QUADAS-2. Graphical display for presenting results of QUADAS-2 for assessing the quality of studies.

Summary of the included studies
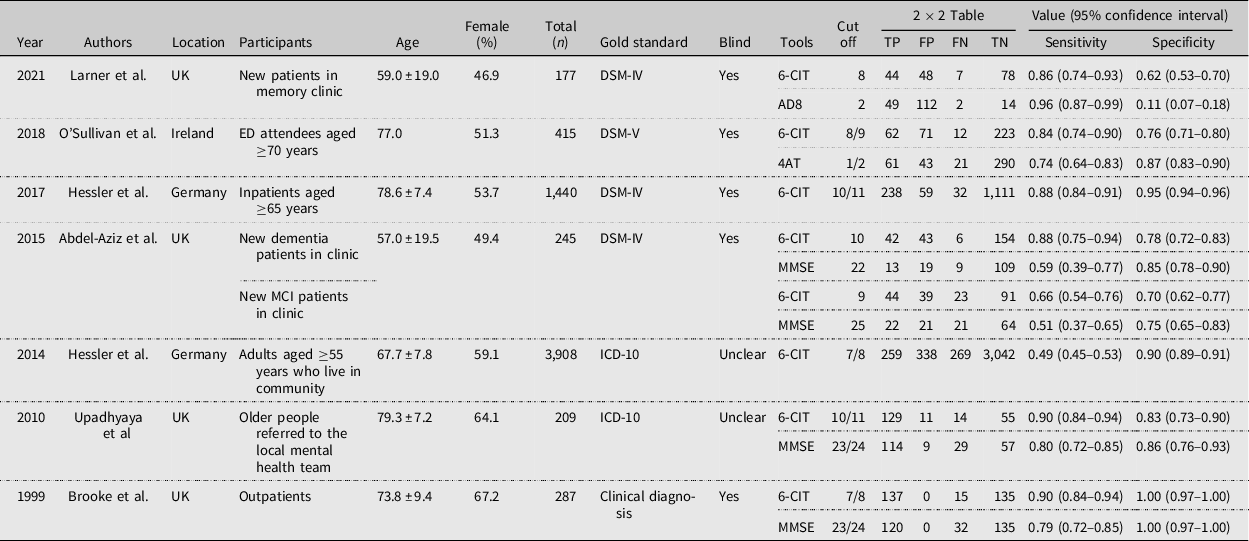
A total of seven studies verified the predictive validity of the 6-CIT, and the total number of participants was 6,681. Abdel-Aziz & Larner (Reference Abdel-Aziz and Larner2015) analyzed dementia and MCI. The age of the participants was 65 years or older, except for in two studies (Abdel-Aziz & Larner, Reference Abdel-Aziz and Larner2015; Larner, Reference Larner2021). The studies were mainly published in the UK, and two studies were in Germany (Hessler et al., Reference Hessler, Brönner, Etgen, Ander, Förstl, Poppert and Bickel2014; Hessler et al., Reference Hessler, Schäufele, Hendlmeier, Nora Junge, Leonhardt, Weber and Bickel2017), one in Ireland (O’Sullivan et al., Reference O’Sullivan, Brady, Manning, O’Shea, O’Grady, O’Regan and Timmons2018). There were 100 or more participants in each study, and there were two large-scale studies (Hessler et al., Reference Hessler, Brönner, Etgen, Ander, Förstl, Poppert and Bickel2014; Hessler et al., Reference Hessler, Schäufele, Hendlmeier, Nora Junge, Leonhardt, Weber and Bickel2017) with more than 1,000 people. The optimal cutoff scores for the 6-CIT presented in each study ranged from 8 to 11. In five studies, the 6-CIT and other tools including the MMSE (Abdel-Aziz & Larner, Reference Abdel-Aziz and Larner2015; Brooke & Bullock, Reference Brooke and Bullock1999; Upadhyaya, Rajagopal & Gale, Reference Upadhyaya, Rajagopal and Gale2010), the Ascertain Dementia (AD8) (Larner, Reference Larner2021), and the 4 ‘A’s test (4AT) (O’Sullivan et al., Reference O’Sullivan, Brady, Manning, O’Shea, O’Grady, O’Regan and Timmons2018) were compared (Table 1).
Characteristics of Selected Studies

This is a summary table of the seven studies included in this review.
Abbreviations: TP, true positive; FP, false positive; FN, false negative; TN, true negative; DSM-IV, Diagnostic and Statistical Manual of Mental Disorders-fourth edition; 6-CIT, Six-item Cognitive Impairment Test; AD8, Ascertain Dementia; ED, emergency department; 4AT, 4 ‘A’s test; MMSE, Mini-Mental State Examination; MCI, mild cognitive impairment; ICD-10, International Classification of Diseases-Tenth Revision.
Predictive validity of the 6-CIT in selected studies
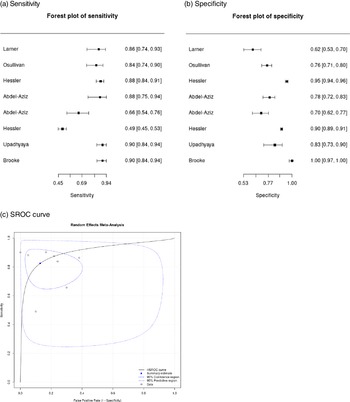
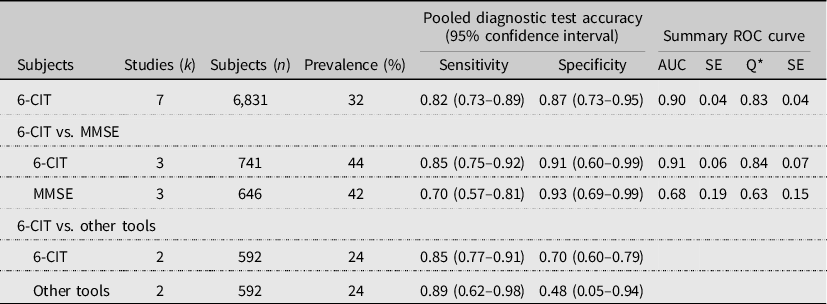
The predictive validity of the 6-CIT was assessed for 6,681 participants across seven studies. The prevalence was 32.0%. The sensitivity and specificity ranged from 0.49 to 0.90 and 0.62 to 1.00, respectively. In the meta-analysis, the pooled sensitivity of the 6-CIT was 0.82 (95% CI, 0.73–0.89), the pooled specificity was 0.87 (95% CI, 0.73–0.95), and the sROC AUC was 0.90 (SE = 0.04). The Q* value was 0.83 (SE = 0.04) (Table 2 and Fig. 3).
Predictive validity of the 6-CIT. The forest plot summarizes the results of the pooled sensitivity and specificity of the 6-CIT in selected studies.

Summary Results of Meta-analysis

This is the meta-analysis result of the 6-CIT, and compared with other tools.
Abbreviations: ROC curve, receiver operating characteristic curve; AUC, area under the curve; SE, standard error, 6-CIT, Six-item Cognitive Impairment Test; MMSE, Mini-Mental State Examination.
Compared predictive validity of the 6-CIT and other tools
The 6-CIT versus the MMSE
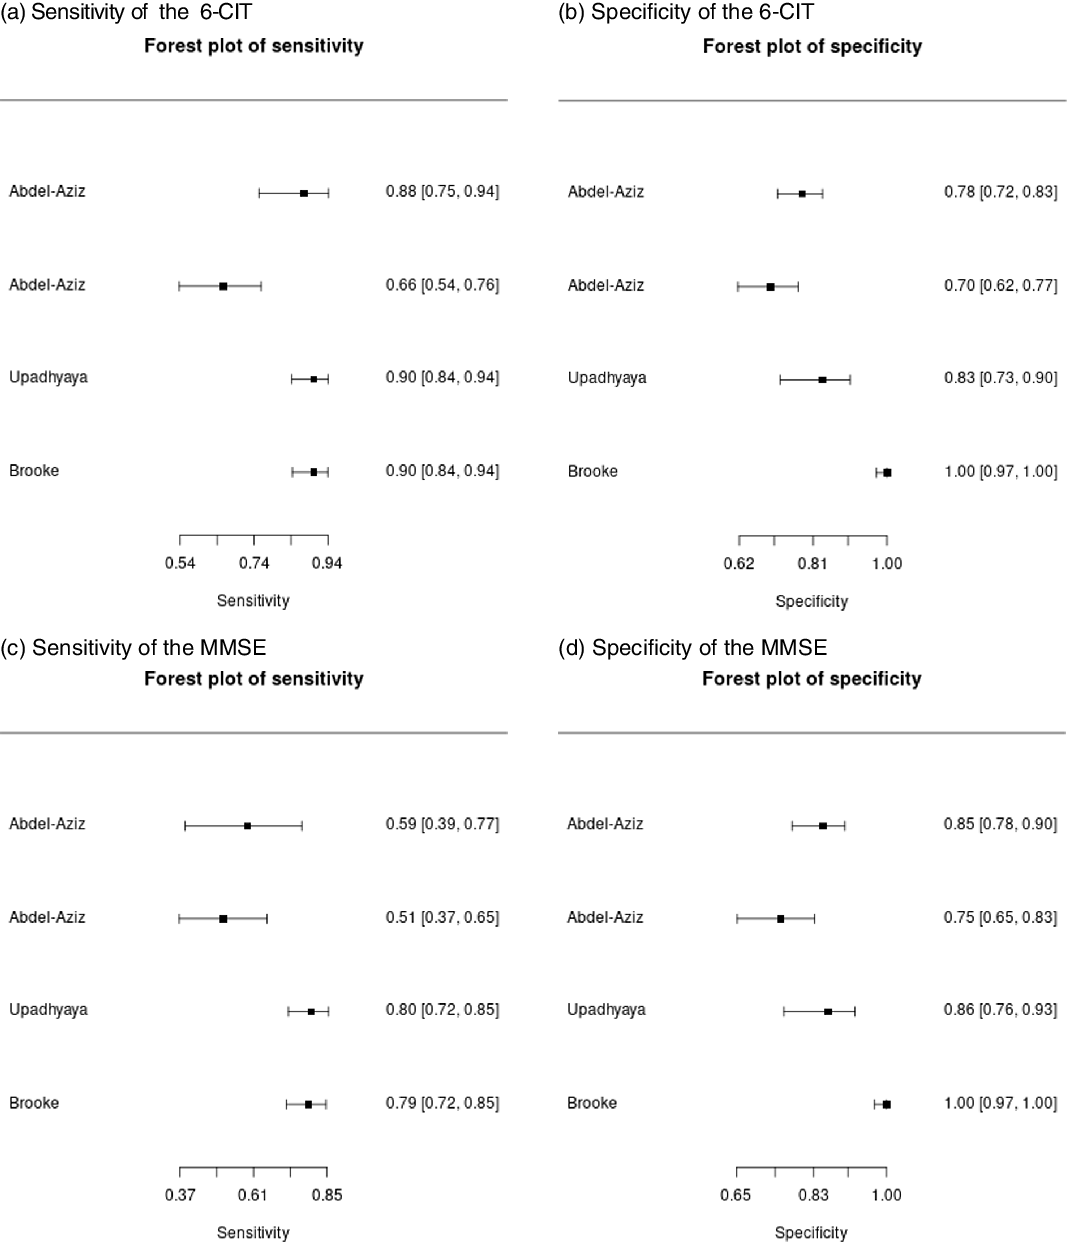
The predictive validity of the MMSE compared to the 6-CIT was assessed for 741 participants in three studies (four cases). The sensitivity ranged from 0.66 to 0.90 for the 6-CIT, 0.51 to 0.80 for the MMSE, respectively. The specificity ranged from 0.70 to 1.00 for the 6-CIT, 0.75 to 1.00 for the MMSE, respectively. The pooled sensitivity of the 6-CIT was 0.85 (95% CI, 0.75–0.92), the pooled specificity was 0.91 (95% CI, 0.60–0.99), the sROC AUC was 0.91 (SE = 0.06), and the Q* value was 0.84 (SE = 0.07). In contrast, the pooled sensitivity of the MMSE was 0.70 (95% CI, 0.57–0.81), the pooled specificity was 0.93 (95% CI, 0.69–0.99), the sROC AUC was 0.68 (SE = 0.19), and the Q* value was 0.63 (SE = 0.15) (Fig. 4).
Predictive validity of the 6-CIT vs. the MMSE. The forest plot summarizes the results of the pooled sensitivity and specificity in the 6-CIT versus the MMSE.

The 6-CIT versus other tools
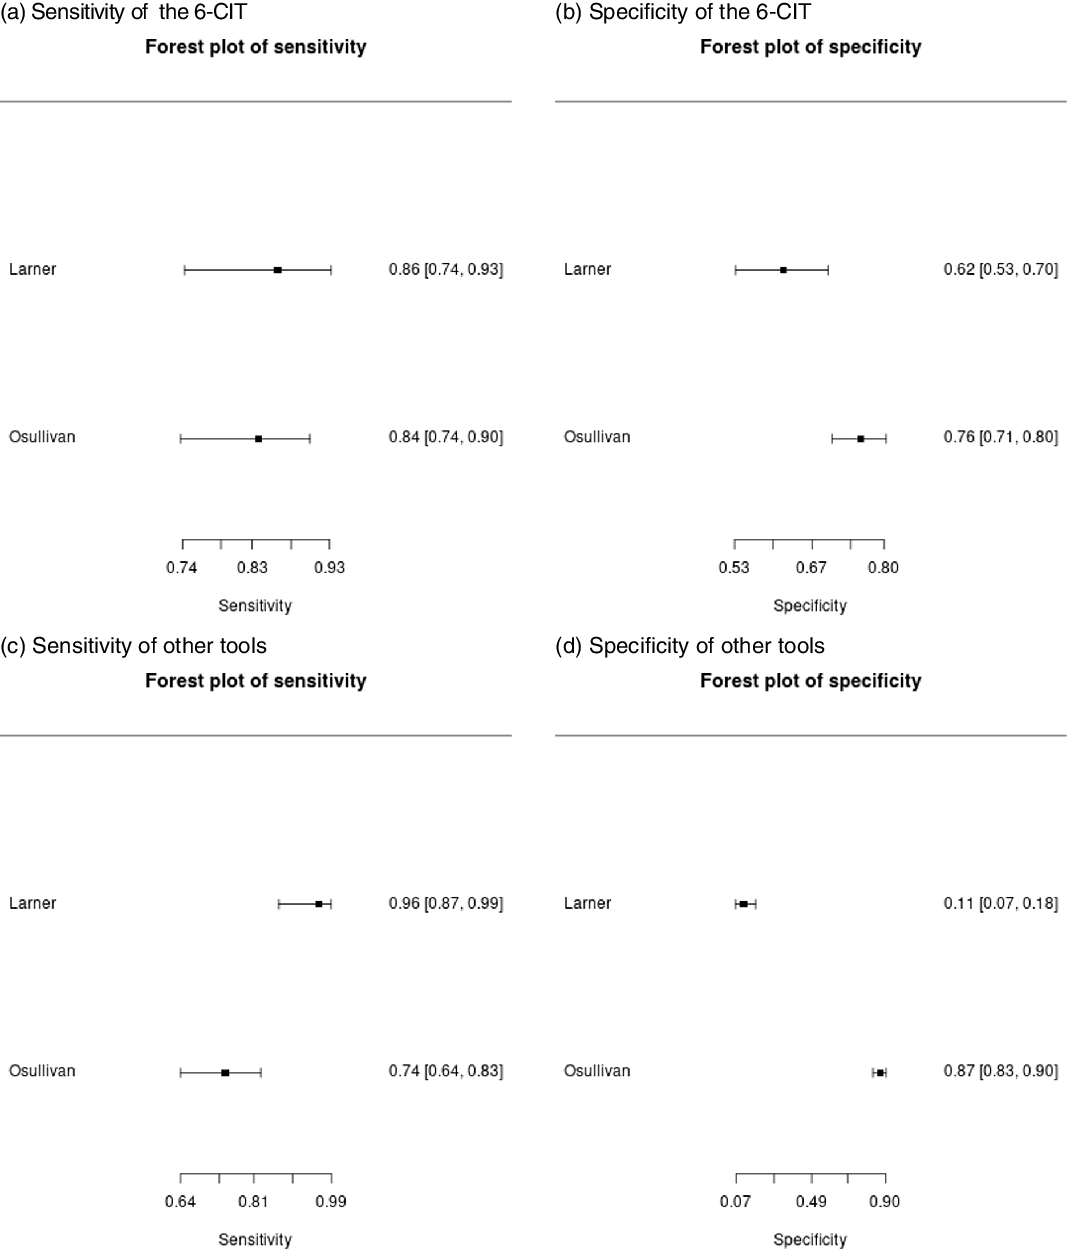
The predictive validity of other tools compared to the 6-CIT was assessed for 592 participants in two studies. The pooled sensitivity of the 6-CIT was 0.85 (95% CI, 0.77–0.91), and the pooled specificity was 0.70 (95% CI, 0.60–0.79). And the pooled sensitivity of the other tools analyzed with the AD8 and 4AT was 0.89 (95% CI, 0.62–0.98), and the pooled specificity was 0.48 (95% CI, 0.05–0.94) (Fig. 5).
Predictive validity of the 6-CIT vs. other tools. The forest plot summarizes the results of the pooled sensitivity and specificity in the 6-CIT versus other tools.

Discussion
The dementia screening tool can quantitatively assess the degree of cognitive impairment and is useful for measuring changes in cognitive function through repeated examinations. Dementia is a progressive disease; hence, it is difficult for family members or acquaintances to detect it accurately as well as in a timely (Grand, Caspar & Macdonald, Reference Grand, Caspar and Macdonald2011). Thus, the 6-CIT comprising six items has some advantages because it could easily and frequently check for dementia. The most widely used mental state examination worldwide is the MMSE (Arevalo-Rodriguez et al., Reference Arevalo-Rodriguez, Smailagic, Roqué I Figuls, Ciapponi, Sanchez-Perez, Giannakou and Cullum2015). This study was intended to quantitatively identify the dementia screening performance of the 6-CIT in seven studies compared with the MMSE which have been well proven through various researches.
In the studies included in this review, the 6-CIT was used for the early identification of cognitive function in older adults living in the community or patients who visited or were admitted to primary and secondary care settings. Since the 6-CIT is a dementia screening tool targeting the older adult population, it was interpreted that the characteristics of these participants were similar to those of the environment in which 6-CIT was practically applied. In addition, since 6-CIT has a quantified scoring system, it was determined that the risk of bias in the procedure of the test would be low.
In the meta-analysis, the 6-CIT of all included studies had the pooled sensitivity of 0.82, the pooled specificity of 0.87, and the sROC AUC of 0.90. In comparison with the MMSE, the sROC AUC for the 6-CIT was 0.91, indicating a highly accurate test. The results of this review provide evidence that the 6-CIT demonstrates an excellent diagnostic performance for screening dementia. The advantage of the 6-CIT over other neuropsychological assessments is that it is very simple and easily accessible. The cognitive domains that neuropsychological assessments usually evaluate are memory, attention, processing speed, reasoning, judgment, problem-solving, and spatial and language functions (Harvey, Reference Harvey2012). In comparison, the 6-CIT assesses only the domains of orientation, memory, and concentration (Katzman et al., Reference Katzman, Brown, Fuld, Peck, Schechter and Schimmel1983). Nevertheless, the findings of this review outline the excellent diagnostic performance of the 6-CIT, which highlights the clear advantage of using it as a quick and easy first screener when dementia is suspected in practice.
In comparison with the MMSE, the pooled sensitivity of the 6-CIT was 0.85, which was higher than that of the MMSE (0.70), and the pooled specificity was 0.91, similar to that of the MMSE (0.93). The sROC AUC of the 6-CIT was 0.91, which was interpreted as highly accurate, whereas the SROC AUC of the MMSE was 0.68, which showed a relatively low diagnostic performance. There are many neuropsychological assessments, but among them, the MMSE is the most used and well-tested tool. However, the MMSE is affected by education level, and is difficult to apply a consistent cutoff score, and takes too much time to use in primary care (Matallana et al., Reference Matallana, de Santacruz, Cano, Reyes, Samper-Ternent, Markides and Reyes-Ortiz2011). There are also limitations when translating items from other cultures (Shim, Yang, Kim, Park & Kim, Reference Shim, Yang, Kim, Park and Kim2017). However, the questions of the 6-CIT are simple and clear sentences; hence, there would be no translation errors (Katzman et al., Reference Katzman, Brown, Fuld, Peck, Schechter and Schimmel1983; O’Sullivan et al., Reference O’Sullivan, O’Regan and Timmons2016). This review provides evidence that the dementia screening performance of the 6-CIT is relatively superior compared to that of the MMSE. Thus, we can suitably use it in any country. In comparison to other tools (AD8 and 4AT), the pooled sensitivity was similar at 0.85, but the pooled specificity of the 6-CIT at 0.70 was better than that of the other tools at 0.48.
In this study, the cutoff score of the 6-CIT applied in each study was used as it is. The 6-CIT has a quantified scoring system, and some websites can automatically calculate the measured scores. In the selected studies, a cutoff score of 10 or 11 was applied to patients with dementia or referred patients, and a cutoff score of 8 or 9 was applied to general participants for cognitive function screening. This was interpreted as a result showing that the scoring system that Katzman distinguished according to cognitive function (Katzman et al., Reference Katzman, Brown, Fuld, Peck, Schechter and Schimmel1983) was consistently applied in practice.
This review has certain limitations. The number of studies included in the review was small: seven articles. Comparison with the MMSE was done using three studies (four cases) and that with other tools was done using two studies. Thus, this study confirmed that the diagnostic performance of the 6-CIT was comparable to that of other tools, but it could not explain its potential benefits like when the use of the 6-CIT might be advantageous instead of the MMSE, and when the use of the 6-CIT is not suitable. The studies selected for this review did not consider differences in dementia subtypes. In addition, the use of the 6-CIT tends to be limited to some countries. All studies included in this review were published in three countries: four studies were from the UK, two from Germany, and one was from Ireland. Therefore, it also needs to be assessed in countries with different cultures.
Many of the older adults with dementia remain undiagnosed. Dementia, for which there is no treatment, is one of the early symptoms of cognitive decline (Knopman & Petersen, Reference Knopman and Petersen2014). Considering the social and psychological effects of dementia, dementia screening should be easy and fast. This study presents evidence that the 6-CIT had excellent dementia screening performance and could be used as an alternative to the MMSE. The questions of the 6-CIT are very clear; hence, any country can correctly translate it into their own language. Cognitive impairment can be linked to adverse events that threaten the safety of older adults. The 6-CIT may provide an opportunity for early detection of dementia in people at potential risk. The 6-CIT, which is easy for anyone to use, can easily and quickly detect patients with cognitive impairment in the community or primary and secondary care settings and provide useful information for care.
Supplementary materials
For supplementary material for this article, please visit https://doi.org/10.1017/BrImp.2022.22
Acknowledgements
This work was supported by the Soonchunhyang University Research Fund. The funders of this study had no role in the study design, analysis, or interpretation of data or in the writing of the article or decision to submit the article for publication. Additionally, the author thanks Dr YS Cho for the assistance and advice provided during study selection, data extraction, and the quality assessment of the studies.
Financial support
This research received no specific grant from any funding agency, commercial, or not-for-profit sectors.
Conflicts of interest
There are no conflicts to disclose.
Ethical standards
Not applicable.
Description of author’s roles
Seong-Hi Park is the sole contributor to the brief report.