
I. INTRODUCTION
A. Instrumented indentation
Instrumented indentation is a technique with high force and displacement resolution, less than 1 nN and 1 nm, respectively, Reference Galli, Fornasiere, Cugnoni and Oyen1–Reference Fischer Cripps4 that is used to measure the local mechanical properties of a material. Reference Hu, Zhao, Vlassak and Suo5–Reference Heris, Miri, Tripathy, Barthelat and Mongeau7 The technique monitors the real-time load and indentation depth of a probe with well-defined geometry and size, and uses these data combined with models to obtain material properties. Reference Kalcioglu, Mahmoodian, Hu, Suo and Van Vliet2,Reference Ebenstein and Wahl8 Probes with radius less than 10 µm have been used to characterize harder biological materials, such as cartilage and bone, using instrumented indentation. Reference Ebenstein and Pruitt6,Reference Paietta, Campbell and Ferguson9 Soft gels with modulus ranging from 10 to 100 kPa have been characterized with probe sizes ranging from 100 µm to 1 mm and conical spherical or spherical-shaped probes. Reference Kalcioglu, Mahmoodian, Hu, Suo and Van Vliet2,Reference Chhetri, Zhang and Neubauer3,Reference Strange, Fletcher, Tonsomboon, Brawn, Zhao and Oyen10–Reference Oyen12
Instrumented indentation is also increasingly recognized as an efficient way of understanding the biological process of diseased and/or damaged tissues, which are typically soft and heterogeneous on the scale of 10's to 100's of micrometers. Reference Kalcioglu, Mahmoodian, Hu, Suo and Van Vliet2,Reference Ebenstein and Pruitt6 It has been used with tissues like bone and cartilage, Reference Hauch, Oyen, Odegard and Haut Donahue13–Reference Li, Allen, Alliston and Pruitt15 with fewer studies on softer tissues with modulus less than 1 MPa, in part due to problems with surface detection. Reference Ebenstein and Pruitt6,Reference Farine16 Yao et al. characterized the shear modulus and poroelastic properties of human cervix Reference Yao, Yoshida, Fernandez, Vink, Wapner, Ananth and Oyen17 ; Slaboch et al. characterized rat thrombus relaxation behavior with indentation Reference Slaboch, Alber, Rosen and Ovaert18 ; Chhetri et al. studied elastic properties of vocal folds Reference Chhetri, Zhang and Neubauer3 ; and Gupta et al. characterized the porcine cartilage time-independent properties. Reference Gupta, Lin, Ashby and Pruitt14 The increasing interest in the characterization of soft and biological materials drives the demand for a more accurate and reliable approach to measure the mechanical properties of these materials via instrumented indentation.
The biggest and yet to be resolved challenge in testing soft materials with instrumented indentation is detection of, or locating, the sample surface. Reference Farine16,Reference Kaufman and Klapperich19,Reference Wald, Considine and Turner20 This is the challenge addressed in this paper and we present a novel approach to address this issue.
B. The surface detection problem for indentation of soft materials
In general, the probe must approach the sample either manually or automatically, and must register a load in order to detect the surface. Often a preload is set to do this. For soft materials, the preload must be sufficiently large to register contact with the material surface. If the preload is too small, the fluid–tip interaction can trigger false engagement. Small preloads can also result in false engagement if the initial contact with the probe is not uniform. If the preload is too large, the preload will be reached after the probe has already significantly deformed the sample. This means there has been preload-induced deformation and the probe begins the indentation test at an unknown depth below the sample surface. This initial indentation depth can be on the order of microns (e.g., see Section IV.B). There is currently no nondestructive method to determine the initial depth and the result is an overestimation of properties such as elastic modulus and shear modulus. Reference Kaufman and Klapperich19,Reference Wald, Considine and Turner20
Previous studies have suggested tracking the surface deformation using florescent particles as a means to resolve the surface detection problem. Reference Wald, Considine and Turner20 This method requires specialized equipment and not all materials can be prepared with fluorescent beads on the surface. Li et al. and Bhushan et al. proposed surface detection by monitoring the change in stiffness through cyclic loading. However, their theory was developed for rigid plastic materials and this approach is not applicable to viscoelastic and viscoelastic-plastic materials because it does not account for time-dependent behavior. Reference Li and Bhushan21 Ebenstein et al. approached surface detection by dynamic testing. The high frequency dynamic testing can result in sample heating, and thus softening or even melting. Reference Ebenstein and Wahl8 Some of the previous studies did not address the surface detection problem at all. Reference Galli, Fornasiere, Cugnoni and Oyen1,Reference Chhetri, Zhang and Neubauer3,Reference Hu, Zhao, Vlassak and Suo5
In this paper, we propose a multi-indent approach (MIA) that indirectly detects the sample surface by determining the preload-induced initial indentation depth. With this initial indentation, the actual indentation depth is greater than the apparent depth, i.e. the indentation depth prescribed by the user. With the underestimation of the actual indentation depth, the modulus is inflated and poroelastic properties are also affected. In this work we measured the linear elastic and poroelastic properties of polyacrylamide gels using instrumented nanoindentation and compared results from the MIA to those obtained by the Oliver–Pharr approach. Bulk, uniaxial, unconfined compression test data were used for comparison of the elastic modulus and shear modulus to the indentation results using both the MIA and Oliver–Pharr methods.
C. Overview of the Oliver–Pharr model
The method introduced here, the MIA, draws from the commonly used Oliver–Pharr model. Reference Heris, Miri, Tripathy, Barthelat and Mongeau7,Reference Oliver and Pharr22,Reference Oliver and Pharr23 The Oliver–Pharr model has been most widely applied to elastic and elastic–plastic materials with elastic modulus greater than 1 MPa, less so to materials with modulus between 50 kPa and 1 MPa, and even less to softer materials. Reference Heris, Miri, Tripathy, Barthelat and Mongeau7,Reference Buffinton, Tong, Blaho, Buffinton and Ebenstein11,Reference Kaufman and Klapperich19 Kaufman et al. Reference Kaufman and Klapperich19 studied the properties of hydrated polydimethylsiloxane (PDMS) using indentation and the Oliver–Pharr method. They concluded that when using the Oliver–Pharr model, errors due to surface detection can be significant, as much as almost five times the actual value. Buffinton et al. measured Young's modulus of polyacrylamide gels with moduli ranging from 11 kPa to 44 kPa using a 1 mm diameter conical-spherical tip; Heris et al., Reference Heris, Miri, Tripathy, Barthelat and Mongeau7 studied the properties of vocal fold tissue with modulus in the range of 5–10 kPa using Oliver–Pharr. When the Oliver–Pharr method has been applied to softer materials, the initial indentation depth has not been taken into account. Reference Heris, Miri, Tripathy, Barthelat and Mongeau7,Reference Buffinton, Tong, Blaho, Buffinton and Ebenstein11,Reference Kaufman and Klapperich19 Here, we provide a short summary of the basic assumptions of the Oliver–Pharr model and then relate those to the use of MIA in Sec. II. A.
One assumption of the Oliver–Pharr model is that there is only elastic recovery on unloading. Reference Oliver and Pharr22,Reference Oliver and Pharr23 This is important for soft materials that can exhibit poro- or viscoelastic behavior. Another is that the “sink-in” depth, similar to the initial indentation depth for the MIA approach, can be corrected for in the calculation of the contact area. Reference Poon, Rittel and Ravichandran24 The third assumption is that the material is homogenous under the affected area. Reference Galli, Fornasiere, Cugnoni and Oyen1–Reference Fischer Cripps4 The model also assumes that there is no friction and no adhesion between the probe and the sample. Reference Oliver and Pharr22,Reference Oliver and Pharr23 Finally, the deformation is assumed to be small. Reference Oliver and Pharr22,Reference Oliver and Pharr23
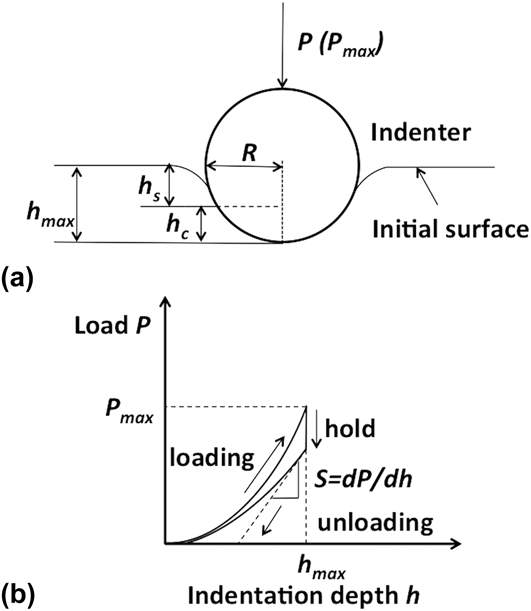
Some of the concepts and notation that are important to the Oliver–Pharr method and to our approach are introduced using Fig. 1 and Eqs. (1)–(7). During an indentation experiment, the probe continuously indents the material to the maximum load, P max, and maximum indentation depth, h max (Fig. 1). Figures 1(a) and 1(b) show a spherical probe and a schematic of a load–displacement curve in displacement control, respectively. We also used a spherical indenter and displacement control in our study (see Sec. III for details). The depth over which the indenter is in contact with the material is the contact depth, h c [Fig. 1(a)]. The distance from the contact separation point to the nondeformed surface of the sample is referred to as the “sink-in” depth, denoted h s (Fig. 1) and is expressed in Eq. (1), Reference Oliver and Pharr23 where ε is a constant that depends on the geometry of the indenter and is equal to 0.75 for a spherical probe like that used in this paper. Reference Heris, Miri, Tripathy, Barthelat and Mongeau7,Reference Oliver and Pharr23 The sum of the sink-in depth and the contact depth is the maximum depth of the indenter and their relationship is then given by Eq. (2).
 $${h_{\rm{s}}} = \varepsilon {{{P_{{\rm{max}}}}} \over S}\quad ,$$
 $${h_{\rm{c}}} = {h_{{\rm{max}}}} - \varepsilon {{{P_{{\rm{max}}}}} \over S}\quad .$$
Schematics showing (a) geometry of indentation and (b) the corresponding load–displacement curve. Adapted from Oliver and Pharr. Reference Poon, Rittel and Ravichandran24 Schematic is not drawn to scale.

The projected or contact area, A, of the spherical indenter that is in contact with the material depends on the contact depth according to Eq. (3), in which R is the radius of the spherical indenter tip. Reference Oliver and Pharr23 The contact area is used in the calculation of the elastic modulus of the sample, E s, Eqs. (4)–(6).
 $$A = \pi \left( {2R{h_{\rm{c}}} - {h_{\rm{c}}}^2} \right)\quad .$$
The slope of the unloading curve evaluated at P max is referred to as the contact stiffness, S, as illustrated in Fig. 1(b) and expressed by Eq. (4). It is a function of the effective modulus, E eff, the contact area, A, and a geometric constant β, the value for which is approximated as 1 for the spherical indenter. Reference Oliver and Pharr23 The modulus of the sample and that of the indenter are contained within the equation for the effective modulus, Eq. (5), in which E s and E i are the modulus of the sample and indenter, respectively. Likewise, νs and νi are the Poisson's ratio of the sample and the indenter, respectively.
 $$S = \beta {2 \over {\sqrt \pi }}{E_{{\rm{eff}}}}\sqrt A \quad ,$$
 $${1 \over {{E_{{\rm{eff}}}}}} = {{1 - {\nu _{\rm{s}}}^2} \over {{E_{\rm{s}}}}} + {{1 - {\nu _{\rm{i}}}^2} \over {{E_{\rm{i}}}}}\quad ,$$
 $${E_{{\rm{eff}}}} = {{{E_{\rm{s}}}} \over {\left( {1 - {\nu _{\rm{s}}}^2} \right)}}\quad .$$
The indenter probe used here was sapphire with an elastic modulus of 345 GPa, while the materials of interest all have modulus much less than 100 kPa. Therefore, the second term of Eq. (5) is small and can be neglected, leaving E eff in the form of Eq. (6). Substituting h c, A, and E eff from Eqs. (2), (3) and (6), respectively, into Eq. (4), we obtain Eq. (7).
 $$S = \beta {2 \over {\sqrt \pi }}{{{E_{\rm{s}}}} \over {\left( {1 - {\nu _{\rm{s}}}^2} \right)}}\sqrt {\pi \left( {2R\left( {{h_{{\rm{max}}}} - \varepsilon {{{P_{{\rm{max}}}}} \over S}} \right) - {{\left( {{h_{{\rm{max}}}} - \varepsilon {{{P_{{\rm{max}}}}} \over S}} \right)}^2}} \right)} \quad .$$
Equation (7) is important to the MIA introduced here. It will be used to determine the preload-induced initial indentation depth, h 0, and thus the more accurate elastic and poroelastic material properties than has been possible with previous approaches used for soft materials.
II. THE MULTI-INDENT APPROACH (MIA)
A. Theory of the MIA
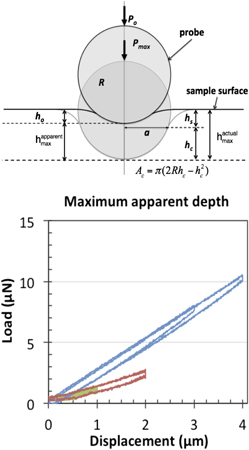
The key feature of the MIA is to determine the initial indentation depth caused by the preload, which allows for an accurate determination of the elastic modulus and other poro-viscoelastic properties. The MIA is based on the Oliver–Pharr model. Figure 2 shows the geometry of the indentation with a spherical indenter and notation specific to our approach. If the initial depth is ignored and we assume that the indentation begins at the surface of the sample, then the maximum indentation depth readout from the data, which we call the apparent maximum depth,
 $h_{{\rm{max}}}^{{\rm{apparent}}}$
, is less than the actual depth of the probe in the sample,
 $h_{{\rm{max}}}^{{\rm{actual}}}$
(Fig. 2). The initial indentation depth is taken in to account by adding it to the apparent maximum indentation depth, Eq. (8). Substituting
 $h_{{\rm{max}}}^{{\rm{actual}}}$
from Eq. (8) into Eq. (7) yields Eq. (9). If the smaller maximum indentation depth,
 $h_{{\rm{max}}}^{{\rm{apparent}}}$
, is used in determining the sample modulus, E
s, then the modulus value obtained is inflated relative to the actual sample modulus.
 $$h_{{\rm{max}}}^{{\rm{actual}}} = {h_{\rm{0}}} + h_{{\rm{max}}}^{{\rm{apparent}}}\quad ,$$
 $$S = \beta {2 \over {\sqrt \pi }}{{{E_{\rm{s}}}} \over {\left( {1 - {\nu _{\rm{s}}}^2} \right)}}\sqrt {\pi \left( {2R\left( {{h_{\rm{0}}} + h_{{\rm{max}}}^{{\rm{apparent}}} - \varepsilon {{{P_{{\rm{max}}}}} \over S}} \right) - {{\left( {{h_{\rm{0}}} + h_{{\rm{max}}}^{{\rm{apparent}}} - \varepsilon {{{P_{{\rm{max}}}}} \over S}} \right)}^2}} \right)} \quad .$$
h 0 is determined by measuring two sequential contact stiffnesses, S 1 and S 2, at the same location and assuming that the associated initial indentation depth is the same for each. With the two contact stiffnesses, we take the ratio of the squares of S 1 and S 2 and eliminate common terms from Eq. (9), including unknowns like E s and νs. Canceling terms yields Eq. (10). The squared terms in the numerator and denominator on the right hand side of Eq. (10) are small for the depths considered here and therefore are neglected. Finally, the initial indentation depth can be determined by solving for h 0, shown by Eq. (11).
 $${{S_1^2} \over {S_2^2}} = {{\left( {{h_{\rm{0}}} + h_{{\rm{max1}}}^{{\rm{apparent}}} - \varepsilon {{{P_{{\rm{max1}}}}} \over {{S_{\rm{1}}}}}} \right) - {{\left( {{h_0} + h_{{\rm{max1}}}^{{\rm{apparent}}} - \varepsilon {{{P_{{\rm{max1}}}}} \over {{S_1}}}} \right)}^2}} \over {\left( {{h_{\rm{0}}} + h_{{\rm{max2}}}^{{\rm{apparent}}} - \varepsilon {{{P_{{\rm{max2}}}}} \over {{S_2}}}} \right) - {{\left( {{h_0} + h_{{\rm{max2}}}^{{\rm{apparent}}} - \varepsilon {{{P_{{\rm{max2}}}}} \over {{S_2}}}} \right)}^2}}}\quad ,$$
 $${h_{\rm{0}}} = {{S_1^2\left( {h_{{\rm{max2}}}^{{\rm{apparent}}} - \varepsilon {{{P_{{\rm{max2}}}}} \over {{S_2}}}} \right) - S_2^2\left( {h_{{\rm{max2}}}^{{\rm{apparent}}} - \varepsilon {{{P_{{\rm{max1}}}}} \over {{S_2}}}} \right)} \over {S_2^2 - S_1^2}}\quad .$$
Schematic illustrating the preload-induced initial indentation depth, h
c, and its relationship to the actual maximum indentation depth,
 $h_{{\rm{max}}}^{{\rm{actual}}}$
, and the apparent maximum indentation depth,
 $h_{{\rm{max}}}^{{\rm{apparent}}}$
. Schematic is not drawn to scale.

The two contact stiffnesses, S
1 and S
2, are obtained at two different maximum indentation depths allowing h
0, and therefore the actual indentation depth,
 $h_{{\rm{max}}}^{{\rm{actual}}}$
, to be determined. h
0 is substituted into Eq. (9), for either S
1 or S
2, and the elastic modulus of the material can then be determined from this procedure. This is repeated with the same preload at multiple locations for a homogeneous sample to obtain multiple measurements for an average value. Alternatively, for a heterogeneous sample, this is repeated at different preloads in the same location.
Several assumptions for the Oliver–Pharr model were described in Sec. I. C and are important to consider in applying the model to MIA. If the material is fully relaxed between the two indents needed to obtain S 1 and S 2, for the MIA, then the assumption that there is only elastic recovery on unloading is valid. Reference Oliver and Pharr22,Reference Oliver and Pharr23 The MIA specifically accounts for the change in contact area associated with the unknown “sink-in” depth, or the initial indentation depth, which satisfies another assumption for the Oliver–Pharr model. The third assumption is that the material is homogenous under the affected area Reference Galli, Fornasiere, Cugnoni and Oyen1–Reference Fischer Cripps4 and adherence to this assumption depends on the material tested. In this study, the material is homogeneous and linear elastic and therefore the assumption is satisfied for the proof of concept. The issue of testing heterogeneous samples is addressed in the Discussion. The model also assumes that there is no friction and no adhesion between the probe and the sample Reference Oliver and Pharr22,Reference Oliver and Pharr23 and this is valid if samples are tested in a contact lens solution or saline solution, Reference Kohn and Ebenstein25 for example, and if any loads caused by adhesion are much less than the maximum loads. Reference Kohn and Ebenstein25 The small deformation assumption Reference Oliver and Pharr22,Reference Oliver and Pharr23 is also valid for the probe size (100 µm radius) and indentation depths considered here (<8 µm).
B. Use of the MIA to obtain poroelastic material properties
In many soft materials, such as for hydrogels like polyacrylamide and for biological tissues, poroelasticity plays an important role in the material response. Reference Hui and Muralidharan26,Reference Hu, Chan, Vlassak and Suo27 Kalcioglu and others have shown that the poroelastic response is contact-area dependent. Reference Hu, Zhao, Vlassak and Suo5,Reference Kohn and Ebenstein25,Reference Galli and Oyen28 Therefore, having an accurate value for the contact depth, h c, determined from knowing the initial indentation depth, h 0, is also important in determining accurate poroelastic properties. Of particular interest in poroelastic materials are properties such as shear modulus, G, Poisson's ratio, ν, diffusivity, D, and intrinsic permeability, κ.
Poroelastic properties are obtained using stress relaxation tests.
Reference Kalcioglu, Mahmoodian, Hu, Suo and Van Vliet2,Reference Hu, Zhao, Vlassak and Suo5,Reference Strange, Fletcher, Tonsomboon, Brawn, Zhao and Oyen10,Reference Galli and Oyen28
The shear modulus depends on the maximum load, P
max, the contact depth, h
c, and the radius of the projected contact area, a, as defined in Fig. 2 and Eq. (12). For a the spherical indenter, like that used in this study,
 $a = \sqrt {R{h_{\rm{c}}}}$
and h
c is given by Eq. (2).
Reference Oliver and Pharr23
Eq. (13) gives h
c after accounting for the initial indentation depth, and Eq. (14) gives P
max.
 $${P_{{\rm{max}}}} = {{16} \over 3}Ga{h_{\rm{c}}}\quad ,$$
 $${h_{\rm{c}}} = h_{{\rm{max}}}^{{\rm{actual}}} - \varepsilon {{{P_{{\rm{max}}}}} \over S}\quad ,$$
 $${P_{{\rm{max}}}} = {{16} \over 3}G\sqrt {R{h_{\rm{c}}} - h_{\rm{c}}^2} \left( {h_{{\rm{max}}}^{{\rm{actual}}} - \varepsilon {{{P_{{\rm{max}}}}} \over S}} \right)\quad .$$
Poisson's ratio is determined from the ratio of the maximum load, P max, to the relaxed load, P ∞, Eq. (15). Reference Hu, Chan, Vlassak and Suo27 According to previous studies, Reference Chan, Hu, Johnson, Suo and Stafford29 diffusivity, D, is determined by fitting the normalized force response to Eq. (16), given for a spherical indenter, in which τ = D/a 2 is the characteristic relaxation time constant and P(t) is the load–time response.
 $${{{P_{{\rm{max}}}}} \over {{P_\infty }}} = 2\left( {1 - \nu } \right)\quad ,$$
 $${{P\left( t \right) - {P_\infty }} \over {{P_{{\rm{max}}}} - {P_\infty }}} = \;0.77\exp \left( { - 1.92{\tau ^{0.8}}} \right) + 0.23\,\exp \left( { - 0.44{\tau ^{0.52}}} \right)\quad .$$
Finally, the intrinsic permeability, κ, is determined by Eq. (17) in which η is the viscosity and is equal to 1.1 × 10⁻³ Pa·s for the phosphate buffered saline (PBS) used here to maintain hydration of the sample.
 $$k = {{D\left( {1 - 2{\nu _{\rm{S}}}} \right)\eta } \over {2\left( {1 - {\nu _{\rm{S}}}} \right)G}}\quad .$$
By plotting the normalized force against time normalized by a 2, we can demonstrate whether the material response is dominated by viscoelastic or poroelastic effects; if the normalized force–time curves that are obtained at different maximum indentation depths collapse onto a single curve, then the poroelastic material response dominates over the viscoelastic response. Reference Cai, Hu, Zhao and Suo30
III. EXPERIMENTAL METHODS
A. Sample preparation for bulk, unconfined compression tests, and indentation tests
Hydrogels with modulus of 19 and 49 kPa were made for uniaxial compression and instrumented indentation experiments by preparing polyacrylamide gels according to Poellmann et al. Reference Poellmann and Wagoner Johnson31 The chemical components for gels of each stiffness were mixed, cast for indentation or compression tests, and finally polymerized for 10 min at room temperature. The 19 kPa gel contained 58.6 wt% deionized (DI) water, 20% acrylamide stock, and 10% bis stock; the 49 kPa gel contained 43.6 wt% DI water, 30% acrylamide stock, and 15% bis stock. Both gels also contained 1.2 wt% of 10 wt% ammonium persulfate (APS) and 0.2 wt% of tetramethylethylenediamine (TEMED). The ratio of acrylamide stock and bis stock determines the stiffness of the specific gel. Reference Poellmann and Wagoner Johnson31,Reference Poellmann and Wagoner Johnson32
B. Unconfined compression tests
The elastic modulus determined by bulk compression tests was used as the comparison to the modulus determined by indentation. For bulk samples, the unpolymerized gels were cast into 6-well cell culture plates resulting in samples 20 mm in diameter and 25 mm in height. Compression tests were conducted using a Bose 5100 ElectroForce BioDynamic test system with Bose Wintest control software (TA Instruments, ElectroForce Systems Group, 9625W. 76th street, Suite 15, Eden Prairie, MN). Samples were tested to 5% strain at a displacement rate of 0.15 mm/s, which corresponds to 0.5%/s. A 1000 g load cell was used. Elastic modulus was determined from the linear elastic regime of the stress–strain curve using a custom Matlab code (Matlab, 2014a version, Mathworks, Inc. Natick, MA). Three samples of each of the two gel formulations were tested in compression and each individual sample was tested three times for a total of 9 measurements for each gel formulation. A Poisson's ratio of 0.33 was used for the calculation of elastic modulus and shear modulus. This value was measured in our previous work. Reference Poellmann and Wagoner Johnson31
C. Indentation tests
1. Sample preparation for indentation tests and test set-up
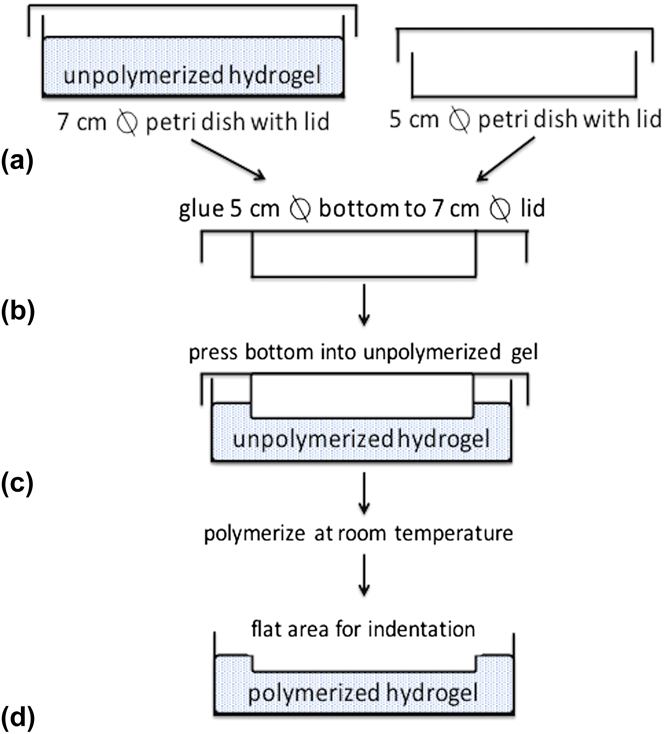
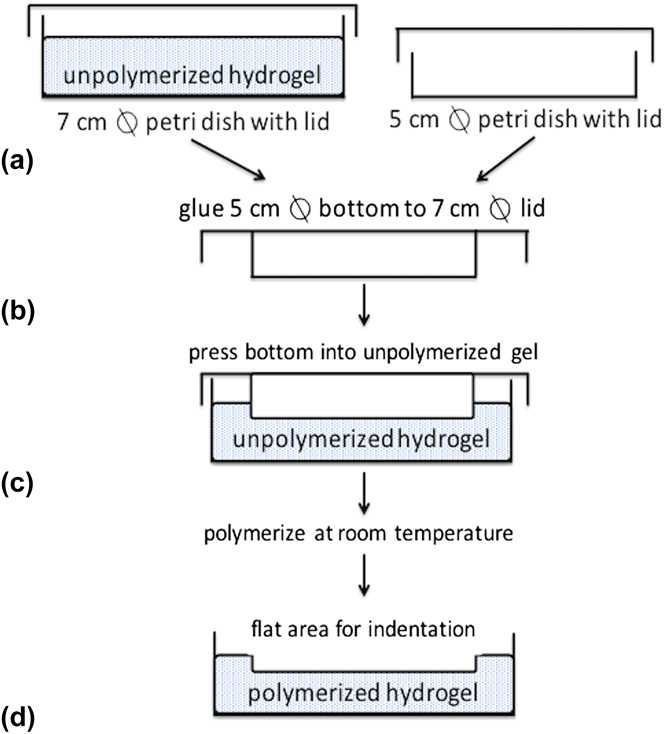
For indentation tests, the unpolymerized gel was cast into a 7 cm diameter glass Petri dish with a frosted bottom (Fig. 3). The custom-frosted glass secures the sample in the dish and thus prevents sample motion, like floating, during indentation experiments. To generate a flat indentation surface of the gel, the bottom of a 5 cm diameter Petri dish was glued onto the lid of the 7 cm Petri dish [Fig. 3(b)], and then placed on top of the unpolymerized gel [Fig. 3(c)]. After polymerization, the Petri dish was glued to a stainless steel plate and was placed on the magnetic platform of the instrumented indentation system (TI950 Triboindenter, Hysitron Inc, Minneanpolis, MN).
Schematic illustrating the polyacrylamide sample preparation for indentation tests. (a) The unpolymerized gel was cast in a 7 cm diameter glass Petri dish with a custom-frosted bottom. (b) The bottom of a 5 cm diameter Petri dish was glued to the lid of the 7 cm glass Petri dish and (c) placed on the surface of the unpolymerized gel, resulting in (d) a flat surface for indentation after polymerization. Indents were performed on the flat surface generated by the procedure.
The probe used in this study was a conical-spherical fluid extender probe with a radius of 100 µm (Hysitron Inc, Minneanpolis, MN). The force on the indenter probe from the interaction with the fluid was subtracted from the raw data by performing the recommended baseline “air indent” in the fluid with the indenter tip fully submerged. Before each test, a drift analysis was conducted for 60 s and the software directly corrected for drift during data processing. All indentation data were acquired in displacement control with a data sampling rate of 200 Hz and a displacement rate of 2 μm/s. Data postprocessing was necessary due to the noise floor of the indenter. Data were postsampled at 1/10th of the original sampling rate and a time-averaging filter was applied.
2. Determination of preloads and maximum indentation depths
The first step in using the MIA is to determine the appropriate preload(s) and then the two maximum indentation depths that are used to determine the two contact stiffnesses, S 1 and S 2, needed for Eq. (9) through Eq. (11). The selection of the preload influences the repeatability of the measurements in terms of the false engagement. An optimized preload will ensure that the tip is uniformly in contact with the sample surface when the indentation test begins and that the preload exceeds any interaction force between the tip and fluid. The preload selection must also safely adhere to the rules of thumb that the total indentation depth is comfortably less than 1/10th of the thickness of the sample and 1/3 of the radius of the indenter. Reference Yao, Yoshida, Fernandez, Vink, Wapner, Ananth and Oyen17,Reference Iivarinen, Korhonen and Jurvelin33,Reference Selby, Maldonado-Codina and Derby34 For the indentation tests in this study, these two criteria are very safely satisfied.
To optimize the preload, data from indentation cycles for preloads of 2, 4, and 8 µN were compared at a single indentation depth, and the repeatability of acquiring data was assessed. The appropriate preloads are likely to depend both on the material stiffness and the indentation system, so while this study provides some basic guidelines, this test parameter should be verified for different indentation systems and experiments.
Selection of the two maximum apparent indentation depths is also important to ensure repeatability and to increase the signal to noise ratio in the data. In this work, several indentation depths for both the 4 and 8 µN preloads were tested. However, here only the load–displacement data from maximum apparent depths of 2, 3, and 4 µm on a 19 kPa sample with a preload of 8 µN are shown.
A sensitivity analysis was performed on the preload and indentation depth. For example, the modulus was determined at maximum apparent indentation depths of 2 and 3 µm with preload of 4 µN, and 3 and 4 µm with the same preload, and compared. Then the modulus was obtained at an 8 µN preload and compared.
3. Determination of elastic modulus with multi-indent approach
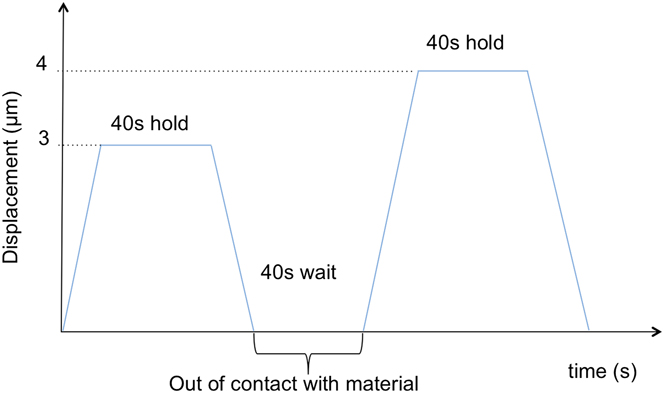
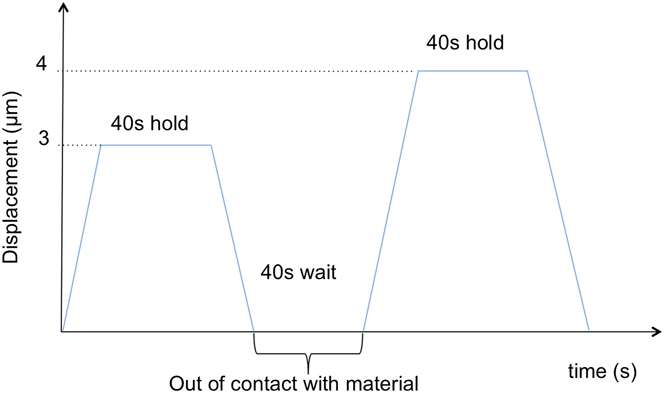
After establishing the preload and maximum apparent indentation depths, two samples for each of the two gels with nominal stiffness 19 and 49 kPa were tested using the MIA. For each gel, measurements were made at five independent locations, or spots, with a distance of at least 1 cm in between. To obtain a single measurement for the modulus, a two-indent cycle was performed at the optimized preload to the two established maximum apparent indentation depths. The load/unload displacement rate was 2 µm/s with a 40 s hold between the load and unload segment (Fig. 4). After finishing the first indent, the tip was manually retracted until it was visibly disengaged from the sample surface. The tip remained disengaged for 40 s, allowing sample to fully relax, then the second indent was performed (Fig. 4). After completing the second indent, the probe was again manually retracted until it was disengaged from the sample surface, and then was moved to a new spot for the next two-indent cycle. Each of the two-indent cycles produces one measure of the modulus according to Eqs. (9)–(11). All elastic properties of all gels were calculated from the unloading segment of the load–displacement curve and reported as an average ± standard deviation (STD), obtained from averaging the measurements from the two-indent cycles from the five independent spots.
Schematic of the waveform used in the indentations tests. Tests were conducted in displacement control. The material was allowed to relax for 40 s between consecutive indents.
The average modulus obtained using the MIA was compared to that obtained from the bulk compression tests and from the Oliver–Pharr model, according to Eqs. (6) and (7), which does not take into account the initial indentation depth. Statistical significance was established using a one-way ANOVA followed by a post-hoc Tukey test with P < 0.05 considered significant (Matlab, 2014a version, Mathworks, Inc. Natick, MA).
In this study, homogenous polyacrylamide gels were indented and results compared. Therefore, each spot had the same modulus. For heterogeneous materials, such as tissues, the modulus will, by definition, vary with location on the sample. To address this, we propose a modified MIA approach. Here, instead of moving to a new spot to repeat the two-indent cycle, the two-indent cycle is repeated at the same spot, but with two different preloads. This provides two measurements of the modulus, one from each preload. To determine whether indenting at two different preloads yielded the same result as indenting at one preload and multiple different spots, indentation test results obtained at 4 and 8 µN were compared for five spots on the homogeneous samples. Results obtained at the two preloads were also compared to the bulk compression test measurements.
4. Multi-indent test procedure for determining poroelastic material properties
Poroelastic properties were determined from load-relaxation data from the hydrogel samples that were prepared for the indentation tests. Relaxation tests were performed in two cycles to two different maximum apparent indentation depths as described in Sec. III. C. 2 and shown in Fig. 4, and the procedure was repeated for a total of five independent spots. Samples were loaded at a displacement rate of 2 µm/s. For each depth, load-relaxation data were acquired for 40 s with a sampling rate of 200 Hz. To investigate whether 40 s was sufficient for the material to relax, we extended the load–time curves at the slope measured over the last 40 s, for an additional 10 s. We then calculated the change in load over that 40 s, and compared it to the maximum load for the sample. Data were processed as described in Eqs. (12)–(17) to determine the instantaneous shear modulus, G, Poisson's ratio, ν, diffusivity, D, and permeability, κ.
The shear modulus was also calculated from bulk measurements, the Oliver–Pharr model, and the MIA. For the bulk value, the shear modulus was obtained using the elastic modulus from the compression tests and the Poisson's ratio from our previous work,
Reference Poellmann and Wagoner Johnson31
according to
 $G = {E \over {2\left( {1 + \nu } \right)}}$
. The shear modulus using the Oliver–Pharr model was determined from Eq. (12) using the h
c that is not corrected to account for the initial indentation depth. Finally, the shear modulus was calculated using the h
c determined by the MIA, which accounts for the initial indentation depth [Equations (13)–(14)]. The shear modulus was calculated at both 3 and 4 μm for the Oliver–Pharr model and the MIA. The modulus at these two indentation depths was compared using a Student's t-test at significance level of 0.05. The data were combined and the shear modulus from the three groups was compared using a one-way ANOVA followed by a Tukey test with significance level of 0.05.
The Poisson's ratio determined by the relaxation experiments was calculated using Eq. (15) at the two indentation depths and for five spots, and then compared to the value we obtained from the compression test data, using a Student's t-test at significance level of 0.05. The relaxed load need to determine Poisson's ratio, P ∞, was calculated by averaging the data points from the slope of load–time relaxation beginning at a slope less than 0.01 µN/s, which includes approximately 400 data points. Diffusivity was determined by fitting Eq. (16) to the data and determining D from τ = D/a 2. Finally, permeability was calculated using Eq. (17). The above procedure yields average ± STDs for at least five independent measurements. Diffusivity and permeability for the two gels were compared to each other using the Student's t-test at significance level of 0.05.
IV. RESULTS
A. Determination of preloads and maximum indentation depths
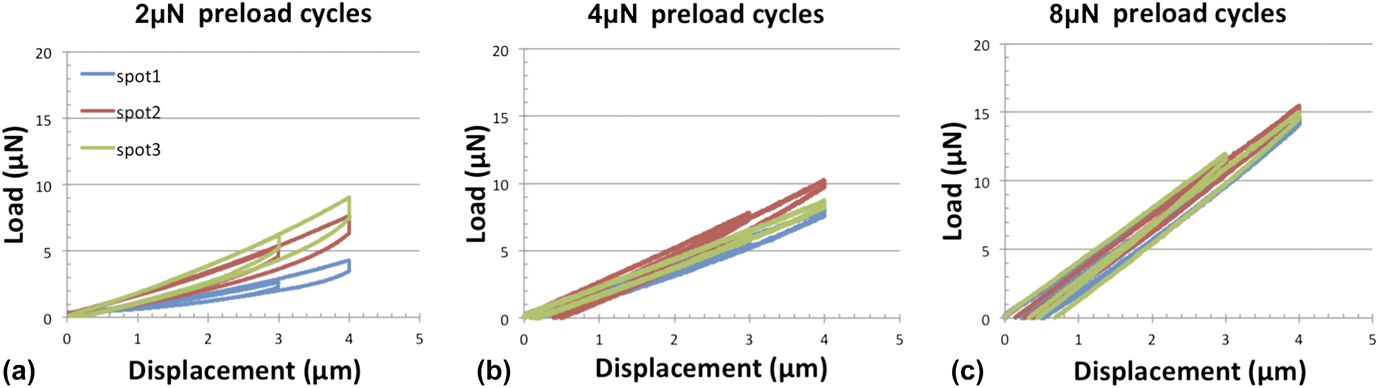
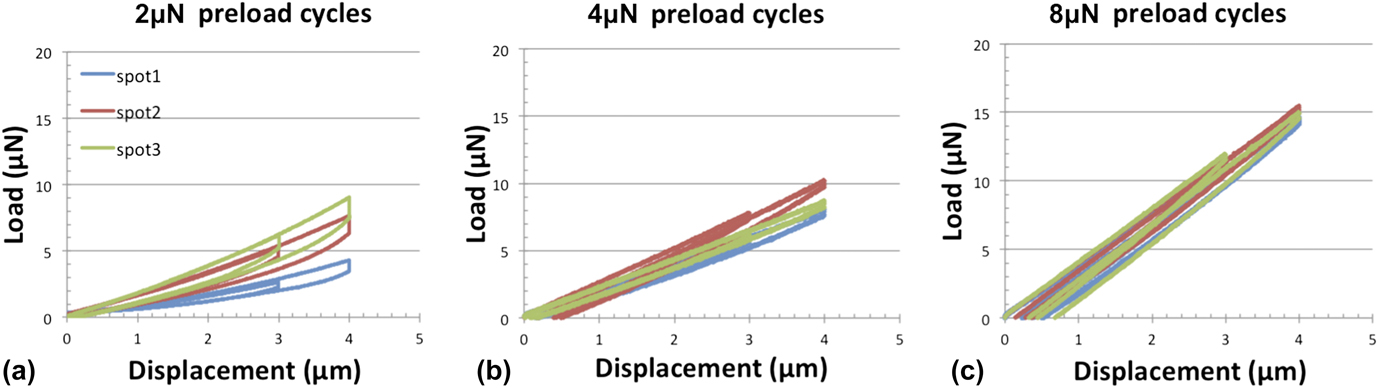
Figure 5 shows the load–displacement data up to maximum apparent indentation depths of 3 and 4 µm on the 19 kPa gel for the 2, 4, and 8 µN preloads. The 2 µN preload was too small; there was frequent false engagement (not shown) due to probe interaction with the fluid layer. Repeatability was low from spot to spot [Fig. 5(a)]. The repeatability of the indentation cycles improved for 4 µN preload [Fig. 5(b)] and was best for the 8 µN preload [Fig. 5(c)].
Load–displacement data illustrating preload selection. (a) Two-cycle, load–displacement data for three spots at the 2 μN preload. Data were inconsistent across spots. False engagement occurred frequently (not shown). (b) Data for cycles at the 4 μN preload were more consistent across spots and false engagement occurred infrequently. (c) Data for the 8 μN preload were most consistent. A 19 kPa gel indented to maximum apparent depths of 3 and 4 μm was used to determine the preload.
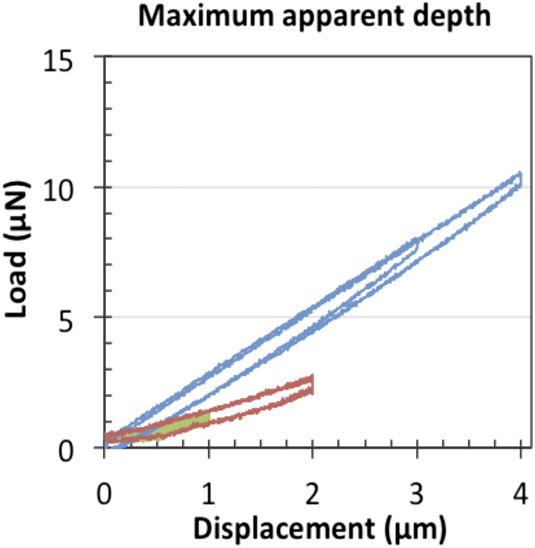
Load–displacement data from indentation cycles at apparent depths of 1, 2, 3, and 4 µm are shown in Figs. 6(a) and 6(b), respectively. Data are particularly noisy for the 1 µm depth. Data are most consistent and repeatable with the least noise for the apparent depths of 3 and 4 µm.
Load–displacement data illustrating selection of the maximum apparent indentation depths. Data are shown for 1, 2, 3, and 4 μm for the 19 kPa gel and an 8 μN preload. Data for 3 and 4 μm were most consistent and repeatable and had the fewest incidences of false engagement.
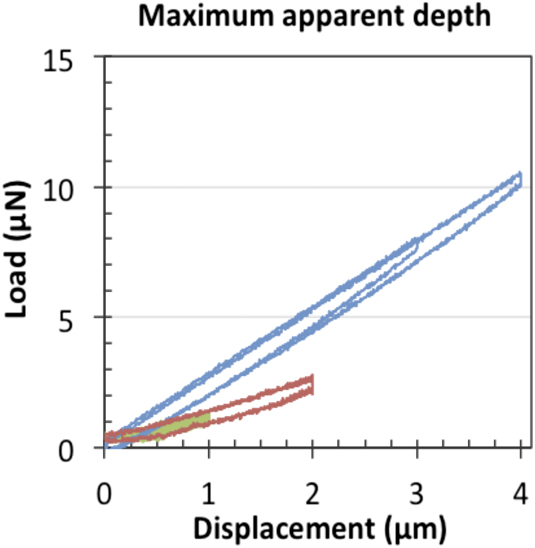
In summary, for the calculation of elastic modulus for a homogeneous material, the optimized preload and the two maximum apparent indentation depths were 8 µN, and 3 and 4 µm, respectively. In the demonstration simulating a test of a heterogeneous material by using two preloads on this homogenous material, and therefore two, two-indent cycles on one spot, 4 µN and an 8 µN preloads with these same maximum apparent indentation depths were used.
B. Use of the MIA to determine the elastic modulus
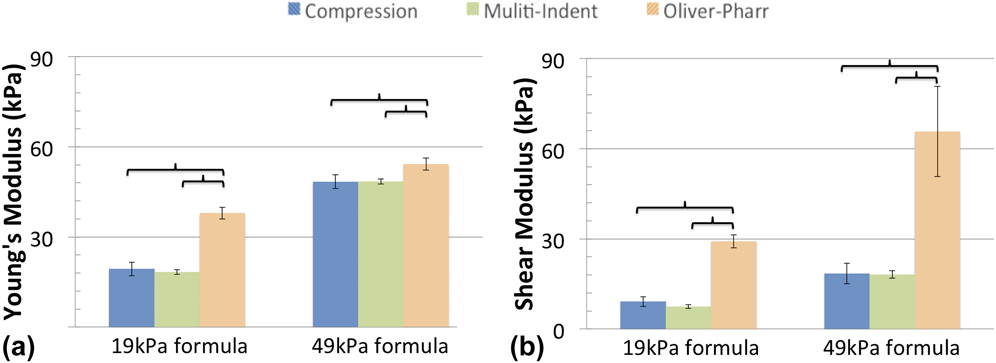
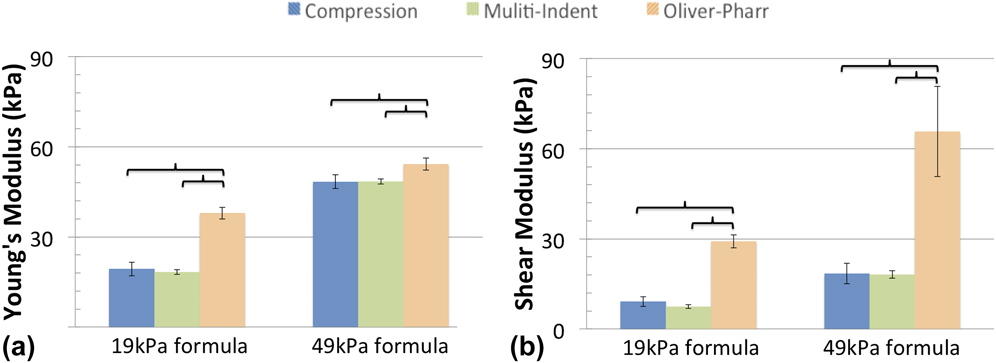
Bulk uniaxial compression test results were compared to those obtained using MIA as well as to the Oliver–Pharr model (Fig. 7). There was no statistically significant difference between the bulk compression test results and those obtained by the MIA (P > 0.05). In contrast, the results obtained by the Oliver–Pharr approach that do not take into account the initial indentation depth, significantly overestimated the modulus and the overestimation was greater for the softer gel (P < 0.05). The average moduli from the 19 kPa gel for the compression tests, MIA, and using the Oliver–Pharr approach were 17.87 ± 1.14 kPa, 19.87 ± 1.92 kPa, and 48.23 ± 3.96 kPa, respectively. For the 49 kPa gel, they were 48.17 ± 1.03 kPa, 48.23 ± 1.64 kPa, and 65.79 ± 4.68 kPa, respectively [Fig. 7(a)]. All results are reported as the average ± STD.
Comparison of elastic properties obtained using the three methods described: bulk, uniaxial compression test, the MIA, and the Oliver–Pharr method. The Oliver–Pharr model does not take into account the initial indentation depth. There is no significant difference between the (a) elastic modulus or (b) shear modulus obtained from bulk compression tests and the MIA (P > 0.05). The Oliver–Pharr model significantly overestimates the both moduli (P < 0.05).
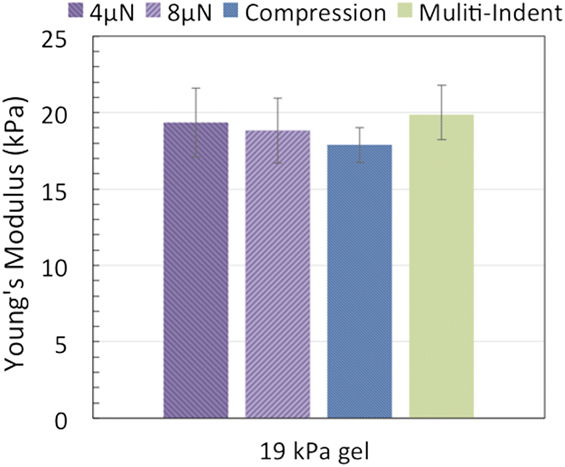
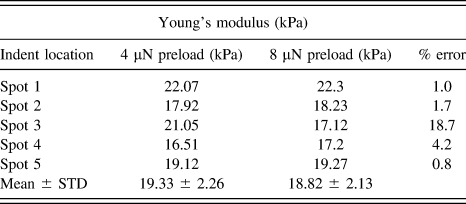
To illustrate the use of the MIA to obtain the elastic modulus for a simulated heterogeneous material, results from two-cycle indents at two different preloads, 4 and 8 µN, performed on the 19 kPa gel were compared to compression test results and indentation test results using one single preload (Fig. 8). Table I shows that results are consistent at both preloads. The average values obtained over the five spots were 19.33 ± 2.26 and 18.82 ± 2.13 for the 4 µN versus 8 µN preloads, respectively. There was no significant difference between results at the two preloads (P = 0.72), indicating that the use of two preloads is also a valid approach.
Comparison between the elastic modulus using the 4 μN preload, 8 μN preload, compression tests, and the MIA. There was no significant difference across the methods and preloads (P > 0.05).
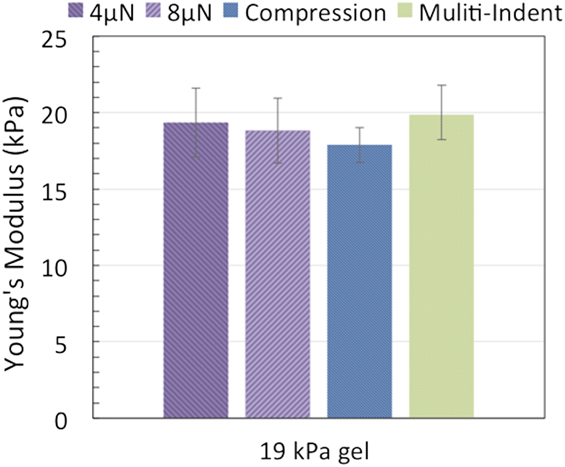
Application of the MIA to a simulated heterogeneous material. Indent cycles were conducted at the two preloads for each spot. There was no significant difference between the modulus obtained at the two preloads.

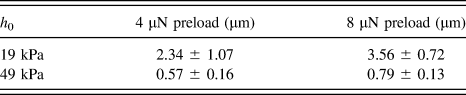
The initial indentation depth, h 0, was also calculated (Table II) and results show that h 0 increases for softer gels and for larger preloads. The maximum was 3.56 ± 0.72 for the 8 μN preload on the 19 kPa gel. With the maximum apparent indentation depth of 4 μm, the total indentation depth was always much less than 1/3 of the tip radius, considered a rule of thumb for an indentation depth limit. Reference Oliver and Pharr22,Reference Oliver and Pharr23
Initial indentation, h 0, at two preloads for the two gels of different stiffnesses. The data show that h 0 is greatest for larger preloads and softer gels.

The sensitivity analysis showed that the modulus was more sensitive to the indentation depth rather than the preload in the ranges tested. The difference in the modulus at the two indentation depths was 3.2 kPa while the difference at two preloads was 0.51 kPa.
C. Use of the MIA to obtain poroelastic material properties
The MIA was also used to determine poroelastic properties such as instantaneous shear modulus, Poisson's ratio, diffusivity, and permeability. To demonstrate the use of MIA for the shear modulus, bulk measurements were again compared to those obtained by the Oliver–Pharr model and MIA and using Eqs. (12) and (14), respectively. Shear modulus was calculated as described. For MIA and the Oliver–Pharr model, shear modulus was calculated at both 3 and 4 μm and the values obtained at the two depths were compared. There was no statistically significant difference for either approach at the two depths and therefore the average over the two depths was used for any remaining calculations or comparisons. The averages for the 19 kPa gel for the bulk measurements, the MIA, and the Oliver–Pharr model were 6.28 ± 0.86 kPa, 7.47 ± 0.67 kPa, and 29.22 ± 2.18 kPa, respectively. The averages for the 49 kPa gel were 18.8 ± 3.56 kPa, 18.13 ± 1.24 kPa, and 65.78 ± 15 kPa, respectively [Fig. 7(b)]. There was no significant difference between the MIA and the bulk tests. The Oliver–Pharr approach had a shear modulus that was significantly greater than those obtained by bulk tests or the MIA (P < 0.05).
To investigate whether the 40 s hold allowed the sample to fully relax, the relaxation curve was extended 10 s according to the slope at the end of the curve. The load for 3 and 4 μm indentations changed less than 0.01 μN, which is less than 0.2% of the maximum load for both gel stiffnesses, at both indentation depths. Thus, the material was relaxed after 40 s.
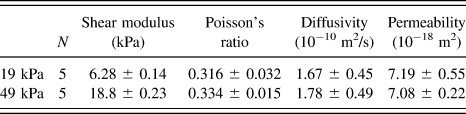
Poisson's ratio was calculated using Eq. (15) at 3 and 4 μm. The values are reported in Table III for the two gels. Poisson's ratio for the 49 kPa gel was 0.334 ± 0.015 and was 0.316 ± 0.032 for the 19 kPa gel (Table III). The Poisson's ratio was not significantly different for the two gels (P > 0.05) and the values were comparable to the value 0.33 obtained experimentally in our previous study. Reference Poellmann and Wagoner Johnson32
Poroelastic properties of 19 and 49 kPa polyacrylamide gel formulations at 4 µm nominal indentation depth.

Relaxation curves from the 3 and 4 μm depth, two-indent cycle were used to obtain diffusivity and permeability for the gels [Figs. 9(a) and 9(c)]. As previously described, diffusivity was obtained by fitting relaxation curves to Eq. (16) [Figs. 9(b) and 9(d)]. The diffusivity of the 19 and 49 kPa gels was 1.67 ± 0.45 and 1.78 ± 0.49 × 10⁻¹⁰ m2/s, respectively (Table III), and these were not significantly different (P > 0.05). Whether the poroelastic or viscoelastic response dominates the material behavior can be determined by whether or not the normalized curves collapse onto one single curve. Indeed, these curves collapsed, indicating that the poroelastic relaxation dominates [Figs. 9(b) and 9(d)]. Finally, the permeability was determined using Eq. (17) and was 7.19 ± 0.55 × 10⁻¹⁸ m2 and 7.08 ± 0.22 × 10⁻¹⁸ m2 for the 19 and 49 kPa gels, respectively (Table III). The Student's t-test showed that the difference was not statistically significant (P > 0.05).
Relaxation curves at maximum apparent indentation depths of 3 and 4 μm for the 19 kPa gel (left column) and the 49 kPa gel (right column). The legend shown at the bottom of the figure applies to (a–h). (a and b) Load–time data. (c and d) Normalized load–time data. Normalized load is given by
 ${{P(t) - {p_\infty }} \over {{P_{{\rm{max}}}} - {p_\infty }}}$
. The curves do not collapse. (e and f) Normalized load–normalized time data without applying MIA. Time is normalized by contact area squared, t/a
2. (g and h) Normalized load–normalized time data after applying MIA. The curves collapse indicating the dominance of the poroelastic response in the relaxation behavior of the gel.

V. DISCUSSION
This study presents and validates a novel approach of indirect surface detection for instrumented indentation of soft materials. More precisely, the MIA determines the preload induced deformation, or the initial indentation depth, below the undeformed sample surface. The MIA uses multiple indents at experimentally determined preloads and maximum apparent indentation depths to calculate this initial indentation depth. Gels with stiffness 19 and 49 kPa were tested using indentation, and elastic properties were compared to those measured by bulk compression tests. Results showed no difference between results obtained by MIA and bulk compression tests, while results obtained by the Oliver–Pharr method were inflated and the difference was statistically significant (Fig. 5). Further, the error increased with decreasing gel stiffness, because the initial indentation depth increased with decreasing gel stiffness (Table II). Poroelastic properties were also measured and reported and are discussed below.
To use the MIA, the preload and the two maximum apparent indentation depths are selected. In general, a preload that is too small can cause false engagement, which invalidates the test. A preload that is too large may introduce an indentation depth that exceeds the 1/3 of the radius of the indenter tip. This was not an issue for the experiments here, since the maximum indentation depth, i.e., the 4 μm apparent indentation depth plus the maximum initial indentation depth measured, was less than 10 μm and the radius of the indenter was 100 μm. Preloads of 4 and 8 μN were determined to be acceptable preloads in these experiments.
Preload is not typically reported in other papers on indentation of soft materials, Reference Galli, Fornasiere, Cugnoni and Oyen1,Reference Heris, Miri, Tripathy, Barthelat and Mongeau7 though it is important to the final result. The larger the preload, the larger the initial indentation depth and the less accurate the calculation of the properties due to the mismatch between apparent and actual maximum indentation depths.
Similarly, the choice of the maximum apparent indentation depths is important to the final results. One that is too small results in noisier and less repeatable results. Here, data for 3 and 4 μm maximum apparent indentation depths were most consistent and thus were used for the study. The sensitivity analysis showed that the modulus is more sensitive to the indentation depth compared to the preload.
MIA was also successfully used to determine poroelastic properties of the gels through relaxation tests. In general, the relaxation curve contains information on both viscoelastic and poroelastic effects of the material behavior. If poroelastic effects dominate, the relaxation curves for different indentation depths should collapse when load and time are normalized by
 ${{P\left( t \right) - {P_\infty }} \over {{P_{\max }} - {P_\infty }}}$
and τ/a
2, respectively. In our analysis, if the MIA was not applied the two normalized relaxation curves did not collapse [Figs. 9(c) and 9(g)], but did if MIA was applied. After collapse was demonstrated, Eqs. (12), (15)–(17) were used to determine shear modulus, diffusivity, and permeability.
The results obtained here for poroelastic properties for our 19 kPa gel are consistent with previous results, Reference Kalcioglu, Mahmoodian, Hu, Suo and Van Vliet2,Reference Hu, Zhao, Vlassak and Suo5 though we do not have a “standard” here by which to compare for diffusivity and permeability like we did for the bulk compression tests. Kalcioglu et al. Reference Kalcioglu, Mahmoodian, Hu, Suo and Van Vliet2 performed indentation experiments on a hydrated a polyacrylamide gel with the same composition and the diffusivity and shear modulus were similar. Their study showed diffusivity of 1.6 ± 0.15 × 10⁻¹⁰ m2/s at 4 μm indentation depth for a 20 kPa gel Reference Kalcioglu, Mahmoodian, Hu, Suo and Van Vliet2 and a shear modulus of 6.73 ± 0.19 kPa. We measured 1.67 ± 0.45 10−10 m2/s for the diffusivity of the 19 kPa gel that was made using a similar recipe and 6.28 ± 0.14 kPa for the shear modulus.
Other researchers, in particular from Oyen's lab, have measured poroelastic properties on a number of gels. Reference Galli, Fornasiere, Cugnoni and Oyen1,Reference Strange, Fletcher, Tonsomboon, Brawn, Zhao and Oyen10,Reference Wang, Mohan, Oyen and Zhao35 However, it is not possible to make a direct comparison to this work because different gels were used, for example collagen. Even in their experiments on polyacrylamide, the water content and specifics of the cross-linker used differed. Reference Strange, Fletcher, Tonsomboon, Brawn, Zhao and Oyen10,Reference Wang, Mohan, Oyen and Zhao35
Poisson's ratio for the 19 kPa gel was 0.316 ± 0.032 and it was 0.334 ± 0.015 for the 49 kPa gel. These values agree well for our previous bulk compression tests for gel of the same stiffness, 0.33. Reference Poellmann and Wagoner Johnson32 Poisson's ratio for polyacrylamide gels has been reported in some previous studies Reference Selby, Maldonado-Codina and Derby34,Reference Guglielmi, Herbert, Tartivel, Behl, Lendlein, Huber and Lilleodden36 between 0.4 and 0.5, however these researchers did not use the same gel. Others that used the same gel found a range of values for Poisson's ratio. For example, Chippada et al. Reference Chippada, Yurke and Langrana37 reported between 0.38 and 0.5 for the same type of gel tested using the Four-magnet manipulator. Kalcioglu et al. Reference Kalcioglu, Mahmoodian, Hu, Suo and Van Vliet2 reported 0.36–0.41 for the same gel using macroscale and microscale indentation. It is unclear why there is a wide range in the literature for Poisson's ratio for similar gels; it could be the measurement techniques or the gels themselves. However, our bulk tests and our indentation tests match well for elastic and shear modulus, and Poisson's ratio.
While several researchers have used the Oliver–Pharr model for soft materials, Reference Heris, Miri, Tripathy, Barthelat and Mongeau7,Reference Buffinton, Tong, Blaho, Buffinton and Ebenstein11,Reference Kaufman and Klapperich19 it has not been widely used in this application. However, it is a simple and well-known model and the major assumptions for the model are satisfied for this material, experimental set-up, and indentation system. Because the tip is fully retracted and disengaged for 40 s between indents, and we demonstrated that the material is fully relaxed under these conditions, there is only elastic recovery on unloading. The Oliver–Pharr model also assumes that there is no adhesion or friction between the probe and the sample. These samples were tested while submerged in PBS and therefore adhesion was greatly reduced or negligible; any effects related to adhesion were much smaller than the maximum loads reached. However, we note that there are models that account for adhesion and friction and they also rely on the contact area, a parameter that can be determined from the initial indentation depth. For example, MIA could be extended to more complex models of indentation such as the Johnson–Kendall–Roberts (JKR) Reference Johnson, Kendall and Roberts38 and the Deriaguin–Muller–Toporov (DMT) Reference Derjaguin, Muller and Toporov39 models, as well as models that are developed based on Hertzian contact Reference Heris, Miri, Tripathy, Barthelat and Mongeau7,Reference Lin, Dimitriadis and Horkay40 and the Sneddon model. Reference Sneddon41 This is because MIA gives a more accurate estimation of projected contact area, and all the above methods require this parameter. For the material, probe size, and indentation depths used in this study, the assumption of small deformation for the Oliver–Pharr model also holds.
Oliver–Pharr also assumes that the material is homogeneous under the probe. Reference Oliver and Pharr22–Reference Poon, Rittel and Ravichandran24 For the simple cases demonstrated here, this is valid. If materials like biological tissues were tested using this approach, the assumption would likely be violated due to the inherent inhomogeneity of tissue. However, this issue is one no matter what method is used for indentation of tissue. Thus far, there is no established approach to account for graded or inhomogeneous structure in indentation testing. It is likely that in the near future it will be possible to combine techniques like nanoindentation and second harmonic generation imaging, for example, which would allow researchers to simultaneously collect data on structure and properties. However, to our knowledge, this is not yet available. Even in with structural and mechanical information, modeling would be required to fully characterize the material.
This study adhered to the rule of thumb that the maximum indentation depth be less than 1/3 of the radius of the indenter. Maximum apparent indentation depths in previous studies have been 10's of micrometers with the same probe geometry and similar tip size as was used here Reference Farine16,Reference Yao, Yoshida, Fernandez, Vink, Wapner, Ananth and Oyen17,Reference Hu, Chen, Whitesides, Vlassak and Suo42 and some have used even larger indentation depths. Reference Kalcioglu, Mahmoodian, Hu, Suo and Van Vliet2,Reference Strange, Fletcher, Tonsomboon, Brawn, Zhao and Oyen10,Reference Hauch, Oyen, Odegard and Haut Donahue13,Reference Chan, Hu, Johnson, Suo and Stafford29 It is unclear whether these studies could demonstrate to have followed this rule of thumb. However, we successfully indented soft gels and obtained accurate material properties using small maximum indentation depths, and did not violate the rule.
We note that MIA is a similar approach as compared to the partial loading/unloading method, which has been proposed for giving a better estimation of projected contact area by Huang et al. and Clausner et al. Reference Clausner and Richter43,Reference Huang, Song, Liu, Chen, Qi, Zhao and Wang44 Thus for both approaches the contact area is varied by varying indentation depth. However, the difference between MIA and this approach is that there is a 40 s hold between consecutive indents in the MIA and therefore the material can completely relax between the two indents at the same spot. In previous studies by Kalcioglu et al. and Chan et al., the typical relaxation time for the same polyacrylamide gel at similar indentation depths and using a similar size indenter tip ranges from 4 to 10 s. Reference Kalcioglu, Mahmoodian, Hu, Suo and Van Vliet2,Reference Chan, Hu, Johnson, Suo and Stafford29
In this study, we used a single tip geometry and size to perform all experiments. Strange et al. Reference Strange, Fletcher, Tonsomboon, Brawn, Zhao and Oyen10 used three different spherical probes on the order of 1 mm in diameter, and equal indentation depths to study poro viscoelastic properties. Use of different probe sizes is another way in which to vary the contact area during relaxation tests; poroelastic response is dependent upon contact area. In our study, by indenting to different depths, i.e., 3 and 4 μm, we also varied the contact area. This is the same approach used by Kalcioglu et al. Reference Kalcioglu, Mahmoodian, Hu, Suo and Van Vliet2,Reference Chan, Hu, Johnson, Suo and Stafford29 to separate poroelastic and viscoelastic properties and our results were comparable.
MIA as proposed here has several limitations. One limitation is that the user must establish preloads and apparent indentation depths and these may vary for different test systems and materials. However, this work has provided guidelines on values for those parameters, and we note that the results will be less sensitive to the choice of those parameters as the stiffness of the material being tested increases. The selection of the parameters can be more challenging if the properties of the material of interest are unknown; however, researchers generally have a sense of the order of magnitude of the properties in order to select the appropriate test method as well as more standard test parameters like tip size.
Another limitation is that we were unable to get satisfactory results for 10 kPa gels (not shown). Testing gels this soft is significantly more challenging and requires more attention to obtain results as accurate as those presented in this study. We continue to work on the MIA to improve its reliability in this range. Another limitation is that, while we propose a protocol for testing heterogeneous materials, we have not explicitly validated MIA for this class of materials. Validation of properties of such materials proves to be challenging because there is no standard by which to compare and there is so much variability in data reported for nanoindentation. Therefore, this will remain a challenge for the foreseeable future. We have demonstrated here that MIA allows the user to determine the initial indentation depth, which is needed for other indentation models since it relates to contact area and contact area is generally is generally required. Thus we also demonstrated that MIA will more accurately determine elastic and poroelastic properties using instrumented nanoindentation.
VI. CONCLUSIONS
The MIA was introduced as an indirect way to detect the sample surface during instrumented indentation of soft materials. MIA uses data from two apparent indentation depths to determine the depth of the preload-induced indentation, and therefore to indirectly establish the location of the sample surface. The approach was validated by comparing the results from indentation to results obtained by uniaxial compression tests for 19 and 49 kPa polyacrylamide gels. Results show that the use of MIA yields significantly more accurate measurement of elastic modulus and shear modulus than that was previously possible using the traditional Oliver–Pharr model. The Oliver–Pharr model gave values inflated by as much as 150% compared to that of the bulk compression tests. The error between results obtained with and without the MIA increased as the stiffness of the gel decreased. Poroelastic properties such as permeability and diffusivity can also be determined more accurately and with small probes and indentation depths. In general, when a large probe is used, the relaxation times can be hours versus seconds. Reference Galli, Fornasiere, Cugnoni and Oyen1,Reference Kalcioglu, Mahmoodian, Hu, Suo and Van Vliet2 Results from this study show that accurate material properties can be measured by instrumented indentation using small preloads and small maximum apparent indentation depths, even using probes with radius as small as 100 μm, thus requiring much shorter relaxation times. The novel approach helps to resolve the long-standing challenge of surface detection and enables a more accurate measurement of soft material properties. This advance has the potential to significantly broaden the use of instrumented indentation to test soft materials.
ACKNOWLEDGMENTS
This study was partially funded by NIH R21 HD058705 and University of Illinois at Chicago College of Nursing internal grant support program. The research was carried out in part in the Frederick Seitz Materials Research Laboratory Central Research Facilities, University of Illinois. JW thanks Kathy Walsh for help with the indentation tests.