Across time and cultures, strong correlations exist between individuals’ economic circumstances and preferences, but it is unclear how these relationships come about. A large literature argues that they are causal: lower income and a higher risk of unemployment are seen as key drivers of support for redistributive social policies.Footnote 1 In the political behavior tradition, however, as well as for economists interested in culture, voters hold views that may be fundamentally at odds with their own material interests, and are motivated primarily by long-term values formed by socialization.Footnote 2
This study aims to resolve these conflicting predictions using a new theoretical framework, as well as a novel dataset and empirical strategy. Doing so is important because the two different conceptions of opinion formation have very different political implications. If voters base their opinions on their own economic circumstances, then changes in their circumstances translate into changes in preferences: voters respond to falling incomes or rising inequality by demanding more redistribution. It also means that more unequal countries will show greater support for such policies, and that politics revolves around clashes between constituencies of voters who fight for their own economic interests, including conflicts between voters who face a high probability of becoming unemployed, and others who do not.Footnote 3 But if preferences are based on long-term values, then changes in individual economic circumstances may do very little to alter the policies that voters support, and countries’ relative support for social policy may not depend on their levels of inequality or economic insecurity.
I address two questions. First, when and how do preferences change in response to changing economic circumstances? And second, why is there such a strong association between economic circumstances and preferences? I argue that, much of the time, people rely on longer-run values as a heuristic to guide their preferences, and are unlikely to shift their views in response to short-run changes in their economic circumstances. Only large changes in individual economic circumstances cause changes in preferences, because they provide information and motivation that help people understand how their needs have changed.
Occasional large changes in circumstances can only partly explain why the poor and at-risk are more supportive of redistribution and social spending. To complete the picture, long-run preferences also arise as a result of early socialization, which is not simply an ideological or cultural process. It involves the long-lasting impact of economic experiences, too. The views of the young, whose preferences are unusually malleable, are shaped by their family’s economic and political background, as well as early experiences in the labor market. Low intergenerational mobility, the tendency of left-wing parents to be poorer and the persistence of early labor market experiences all generate a long-term correlation between circumstances and preferences. Hence people’s long-term preferences for social policy are based on their long-run economic interests, in line with economic theories of permanent income, even though economic circumstances do little to change preferences in the short run.
This is tested with a unique long-panel study from Switzerland that combines information on respondents’ changing economic circumstances and preferences with detailed information on their background. In the rest of the article, the current literature is briefly discussed, before developing the theory. The dataset is then introduced, and cross-sectional regressions are used to obtain partial correlations that are in the same direction as previous studies. I then move beyond them, looking at over-time relationships using fixed-effects regressions and an analysis of the impact of large changes in circumstances. After that, the influence of respondents’ backgrounds is examined, and the results are discussed in light of past findings.
I find strong support for the theory. Preferences are quite stable and unresponsive to income and unemployment risk, but can sometimes be altered by large changes in circumstances, particularly deteriorations, although here the evidence is most tentative. By comparing cross-sectional and fixed-effects regressions, I also argue that previous cross-sectional studies have probably overstated the causal role of changes in economic circumstances in altering preferences toward social policies, although they provide an excellent guide to partial correlations between the two. In addition, there is evidence of a strong role for early socialization in shaping long-run opinions and generating an association between voters’ circumstances and preferences. In short, preferences and circumstances are strongly correlated at the individual level, but resistant to change over time. Greater inequality may not increase aggregate support for redistributive policies, even when opinion is polarized along class lines.
ECONOMIC CIRCUMSTANCES AND POLICY PREFERENCES: AN UNRESOLVED DEBATE
Two sets of studies paint different pictures of preferences for redistribution and social policy. The first emphasize the primacy of material interest, whereas the second emphasize the role of long-run ideologies. Both offer important insights into the nature of preferences for social policy, but cannot fully explain empirical patterns across individuals, countries and time.
Studies from the first group begin with the median voter model, which argues that voters’ incomes determine preferences.Footnote 4 Higher income inequality raises support for redistribution, since the median voter has more to gain from such policies. In addition, welfare states insure voters against shocks such as unemployment. As a result, those at higher risk of unemployment should also be more supportive of redistributive social spending, since they have a higher probability of one day needing to rely on it.Footnote 5 An important implication of these theories is that changes in voters’ circumstances translate into changes in preferences: voters will respond to falling incomes or rising inequality by demanding more redistribution, for example.Footnote 6
This focus on material interest as the driver of preferences contrasts with a second group of studies from political psychology and political behavior, as well as the cultural economics literature. In these approaches, preferences are based on long-term values, which may differ across countries. They argue that preferences can be fundamentally at odds with immediate material interest, are usually formed early in life through socialization processes and are fairly impervious to subsequent changes such as in economic circumstances.Footnote 7
Models based on voters’ material interests provide a clear explanation for an empirical regularity found across time and cultures: the striking correlations between individual economic circumstances and preferences. Poorer and more insecure voters are more supportive of social policy. However, the aggregate empirical evidence is not fully consistent with their theoretical predictions. Voters have not responded to higher inequality by demanding that governments take more action to reduce income differences. Support for such policies is also generally lower in more unequal countries where the median voter would gain more from redistribution, and both rich and poor voters respond similarly to changes in inequality.Footnote 8 One likely explanation is the models’ underlying assumption that voters have full information about their own interests, and how these link to policy. Whether this applies in reality to income and unemployment risk is uncertain. For instance, the connection between unemployment risk and social spending may be hard to understand; voters arguably lack the information needed to connect the two.Footnote 9 If voters do not grasp the relationships between their circumstances and the policies that would help them, they may not change their policy preferences in the expected direction when their circumstances change.
The second approach has been successful in explaining preferences in areas outside of redistribution and social policy, such as government health provision and immigration. Here, material interest generally plays only a minor role in preference formation, precisely because it is often difficult for voters to connect their own circumstances with the relevant policy, unless its potential costs and benefits to the individual are large and very easy to assess. This is most likely to occur when a policy unambiguously affects a small or very well-defined group of voters.Footnote 10 But based on these studies, it remains unclear why economic circumstances are so well correlated with preferences for redistribution and social spending: policies that affect almost all voters, in different and often subtle ways. If economic circumstances play only a minor role in preference formation, why are poorer voters so much more supportive of these policies?
Before developing a theory to answer this question, it is important to note that it is also difficult, at present, to distinguish between these existing theories empirically. A typical set-up involves cross-sectional surveys of individual voters, estimating regressions which relate respondents’ opinions to their income and measures of their unemployment risk. Although the correlations in these analyses clearly conform to theoretical expectations, such findings are also consistent with theories that emphasize socialization and long-term values. Despite using rich sets of controls, there may be unobserved characteristics that determine attitudes to the welfare state and are also correlated with income and risk. Equally, preferences may be formed early in life, and be stable over time, but correlated with economic circumstances. Below, I use an empirical strategy that allows for this unobserved heterogeneity.
THEORY AND HYPOTHESES
Clearly, voters respond to their material interests under certain circumstances. Rather than asking whether their interests affect preferences, I develop a framework that shows when and how it matters, and when it does not. This begins with a familiar idea from behavioral economics: voters are boundedly rational.Footnote 11 People are capable of connecting their economic circumstances to policies that would help them, but often lack the motivation to fully think through how their circumstances matter, and do not always make full use of the information that is available to them. Instead, they often fall back on readily available heuristics that help them act as if they are well-informed.Footnote 12
This means that changes in people’s economic circumstances will not alter their preferences when the cognitive costs of doing so are high, relative to relying on heuristic shortcuts. In particular, whether or not preferences change in response to economic circumstances will depend on the size of the change. Small, regular changes in circumstances will do little to alter preferences because the changes are not materially significant, and may be easily foreseeable in advance, providing little motivation to alter political views. Thinking through how these changes matter and connecting them to a relevant policy requires both high information, and high political engagement. The informational, cognitive and opportunity costs of such behavior would be high for most voters. This leads to the first hypothesis for testing:
HYPOTHESIS 1: There is no relationship between small, regular changes in economic circumstances and preferences for social policy and redistribution.
Large changes in circumstances are much more likely to lead people to change their preferences. It is much easier to understand the link between large changes in circumstance and policy. Such changes are likely to provide new information about individual economic prospects, motivating people to reconsider their own beliefs and interests. For instance, it becomes both more worthwhile, and easier, for a voter to reconsider which welfare policies would help them if they suddenly face the prospect of imminent unemployment. Overall, such a combination of increased motivation and information provides a highly favorable environment for voters to make sound political judgments in line with their objective interests.Footnote 13 This leads to the second hypothesis:
HYPOTHESIS 2: Large improvements (deteriorations) in economic circumstances lead to decreased (increased) support for redistribution and social policy.
In the absence of cues from rapidly changing economic circumstances, people will fall back on other readily available heuristics, particularly long-run ideological values, which provide an easy guide to how to approach political questions without fully thinking them through. These values are often formed through socialization early in life: a person’s background affects the type of long-term, stable values that they hold about welfare and redistribution. In part, this reflects the influence of parents in passing on ideologies.Footnote 14 Here, long-term values arise as a cultural phenomenon, as people assimilate the values of their parents. This leads to Hypothesis 3:
HYPOTHESIS 3: People whose parents were more left-wing will be more supportive of social policy and redistribution.
However, socialization is not merely about cultural values being passed on between generations. It is also an economic process, because youth is a time when material interest is more likely to change preferences. The ‘impressionable years’ theory shows that political attitudes are quite unstable in late childhood and early adulthood, but more stable thereafter, for two reasons. First, adolescence and early adulthood are associated with many major life events that are significant enough to cause people to revise their fundamental preferences, and second, young people are psychologically more open to change.Footnote 15
Youth, therefore, is a time when the barriers to opinion change – lack of information and low motivation – can be overcome, because young people’s economic experiences convey a lot of novel information, and they require less motivation to change their views to begin with. For instance, living in poverty during a person’s formative years will alter their sense of their long-run interests and economic potential at a time when they are already more receptive to new ideas. Perhaps the most important way in which young people experience poverty is through the economic position of their parents. This leads to the fourth hypothesis:
HYPOTHESIS 4: People whose families experienced economic hardship in their formative years will be more supportive of social policy and redistribution.
The other way in which young people come to understand their economic interests is through early labor market experiences. Experiencing rising wages in their youth, for instance, can cause people to revise up their long-run economic prospects. It provides a similar ‘jolt’ to large and sudden changes later in life. This is the final hypothesis for testing:
HYPOTHESIS 5: People who experience big gains (declines) in their economic standing during their formative years will be less (more) suppportive of social policy and redistribution.Footnote 16
Importantly, the last four hypotheses all lead to preferences correlating with people’s contemporaneous economic circumstances, in line with the empirical evidence. When large changes in circumstances are permanent, or a person’s current economic position reflects a history of shocks, such correlations will emerge. However, not everyone experiences large changes in circumstance very often. Many people are born poor and stay that way, but usually their preferenes are aligned with their poverty. That is why the familial channels also matter. Intergenerational mobility is limited; poor parents tend to raise children who are, on average, poor as well. Thus the fourth channel (familial poverty) leads to a correlation between people’s own economic circumstances and their preferences. Likewise, parents who are more left-wing are likely, on average, to be poorer, which has the same effect. Finally, the fifth channel (early labor market experiences) also leads to a lasting correlation between circumstances and preferences, because early economic circumstances have persistent effects on earning and employment prospects.
This means that poorer people can be strongly supportive of social policy while still relying on their longer-term values to guide political preferences most of the time. In that sense, this theory is consistent with the political pyschology and political behavior literatures. The crucial difference to other policy areas, such as health and immigration, is that these processes happen to all voters. Everyone is directly affected by economic changes, and grows up in different economic and cultural circumstances. Voters are more likely to form views on social policy that align with their material circumstances compared to other policy areas, because they are more likely to have relevant personal experiences that enable them to form a reasonable view of their own interests. This helps explain why redistributive preferences are somewhat unusual in showing very clear correlations between material interest and preferences, and it will make these preferences more stable over time than in other areas, where voters are less certain of where their long-run interests lie. Adopting this perspective also helps explain aggregate empirical findings on preferences and rising inequality, if inequality typically changes in a way that is too slow-moving to cause people to reconsider their interests.
The theory proposed here is consistent with theories emphasizing that permanent income or long-run economic position is more important than contemporaneous income in guiding economic behavior, such as consumption.Footnote 17 More broadly, it clarifies rather than contradicts past approaches based on material interest: some authors already endorse the view that only large changes in circumstances will change preferences.Footnote 18 Empirically, the theory suggests that coefficients from past cross-sectional regressions give an accurate picture of the partial correlations between economic circumstances and preferences, reflecting respondents’ permanent economic position, economic socialization and history of economic shocks. Nonetheless, because only large changes in economic circumstances can change preferences, they are likely to overestimate the causal effect of a one-unit change in income or unemployment risk on preferences.
DATA
Individual-level panel data are necessary for this study, for three key reasons. First, testing Hypothesis 1 requires uncovering the causal relationship between preferences and changes in economic circumstances. Panel data are better suited for this, because the impact of variables such as ideological values that are formed early in life and do not change over time, but cannot be observed directly, can be controlled for. The causal effect of changes in economic circumstances can therefore be captured under the much weaker assumption that all heterogeneity is time-invariant.Footnote 19 Second, in order to test Hypothesis 2, we need to directly observe individual changes in economic circumstances. This is only possible with panel data. And third, testing the other three hypotheses requires information on the family backgrounds and early experiences of individuals. Uniquely, my panel dataset has both.
I use the Swiss Household Panel Survey, which has interviewed a large group of people repeatedly each year since 1999, adding a new sample to the panel in 2004, allowing me to observe individual preferences over an unusually long period. The SHP not only details income and unemployment risk, but also asks about political opinions, in every year of the panel from 1999 to 2009 and in 2011. These twelve waves of data covering thirteen years are used (2010 and also 2012, the latest available wave, did not include the required variables).
Two dependent variables are used in this study. The first is a question that asks ‘Are you in favour of a decrease or in favour of an increase in federal social spending?’ The potential responses are ‘in favor of an increase’, ‘neither’ or ‘in favor of a decrease’. These are presented to respondents as an ordered scale (‘neither’ is separate to ‘don’t know’). This variable does not split out social spending into different categories, making this article most comparable to studies which focus broadly on social spending and redistribution.Footnote 20 Nonetheless, in one wave only (2011), the SHP also asked respondents for their opinion about spending on unemployment benefits. A comparison of the two variables, shown in Figure S1 in the Supplementary Material, shows that opinions about general social spending and unemployment benefits in 2011 are highly related: the two variables appear to reflect the same dimension of preferences.
The variable also specifically references federal social spending. In Switzerland, some welfare programs, including immediate poverty relief, are reserved to governments in small administrative regions known as cantons. The federal government controls unemployment, sickness and disability insurance, setting contribution and replacement rates and playing a redistributive role via subsidies for the poor, as well as heavily regulating health insurance.Footnote 21 Because its role is mainly in overseeing insurance schemes, federal social spending in Switzerland offers a particularly good test of insurance-based models. One concern might be that, because the appropriate role of the federal government is a politically salient issue in Switzerland, the answers to this question instead reflect preferences over federal versus local control of spending. The SHP also asks respondents how much confidence they have in the federal government. As shown in Figure S2 in the Supplementary Material, the mean response to this question does not follow any clear pattern across the three opinion groups for social spending, which is not what would be expected if opposition to social spending simply reflects opposition to the federal government.
The SHP does not ask directly about redistribution, and so the second dependent variable uses a question which instead asks about a redistributive policy: ‘Are you in favor of an increase or in favour of a decrease in the tax on high incomes?’ The potential answers are the same as above. This question taps a redistribution motive, since higher taxes on the rich are redistributive, in that such taxes directly reduce differences in post-tax earnings. Models emphasizing material interest would again predict that lower income and higher unemployment risk cause higher support.Footnote 22
There are two key independent variables of interest for this article. The first is household income. It is measured pre tax and transfers, as in the Meltzer–Richard model and previous studies, and is adjusted for inflation to allow over-time comparisons. Because the SHP surveys multiple members of the same household, and income is shared within households, I use household income (as previous studies have also done). It would be unrealistic, for example, to treat both halves of a married couple as only earning their own individual salary. However, I focus on changes over time, and some changes in measured household income are due to changes in household composition, rather than labor income. And a given income level will yield very different standards of living, dependent on household size. I therefore use a measure of income adjusted by an equivalence scale. Such scales are standardly used in the economics literature to compare household income over time.Footnote 23
The second key independent variable asks respondents for a subjective assessment of their risk of unemployment. It asks ‘How do you evaluate the risk that you will personally be unemployed in the next 12 months, if 0 means “no risk” and 10 “a very high risk”?’ The variable thus provides an eleven-point scale from 0 to 10, allowing for considerable variation in risk. In contrast to previous studies that have used objective risk measures based on national occupational unemployment rates or skill specificity, this measure accords directly with the theoretical models, which suggest that perceived risk should matter.Footnote 24 In addition, the subjective measure is also likely to more accurately reflect individuals’ particular circumstances, such as their own employer or regional economy.
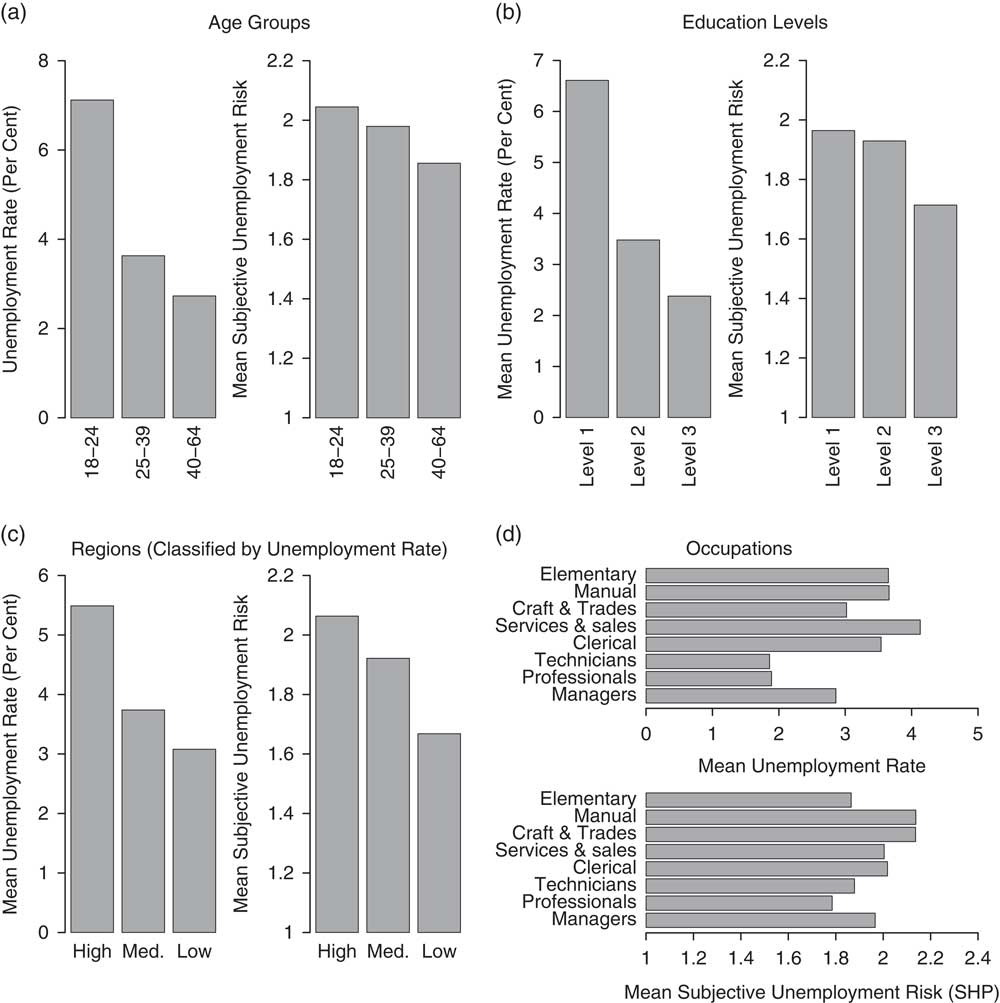
Nonetheless, it is important to verify that this variable reflects the actual risk of unemployment, rather than just noisy responses to a survey question. For four different sources of variation in unemployment, Figure 1 plots mean Swiss unemployment rates in different groups, and compares them to the mean subjective unemployment rate among respondents in those groups. All waves of data are pooled together; averages across waves are calculated. Panels (a) and (b) show that the young and poorly educated have higher unemployment rates; panel (c) shows that there are also regional differences. In each case, subjective risks clearly reflect these actual differences. Panel (d) looks by occupation. I calculated national unemployment rates for eight categories of occupation in the ISCO-88 System (an objective measure of unemployment risk explained in detail by Rehm).Footnote 25 Here, while those in the lowest-risk occupations (technicians and professionals) have lower risk assessments, not all professions show strong correlations. But overall, Figure 1 demonstrates that differences in subjective unemployment risk clearly reflect actual differences in unemployment rates.
Unemployment rates and subjective unemployment risk in the Swiss Household Panel survey, by group Note: Data come from the SHP, Eurostat and Swiss Federal Statistical Office. Panel (b) divides education levels into three groups defined by Eurostat: Level 1 (elementary only or some secondary), Level 2 (advanced secondary) or Level 3 (tertiary). Panel (c) looks at 7 Swiss regions defined by the Federal Statistical Office, grouping them into three groups defined by regional unemployment. The ‘high’ group shows average unemployment in the two regions with the highest unemployment rate, Ticino and Geneva. The ‘middle’ group includes Zurich, Espace Mittelland and North-West Switzerland. The ‘Low’ group shows Central and East Switzerland.

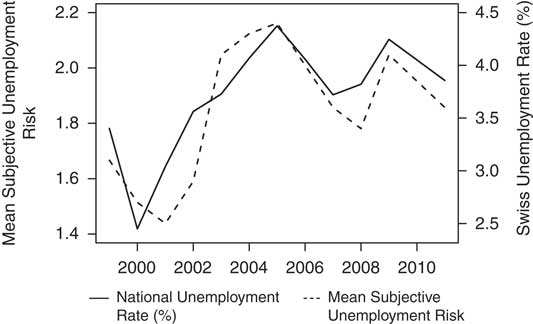
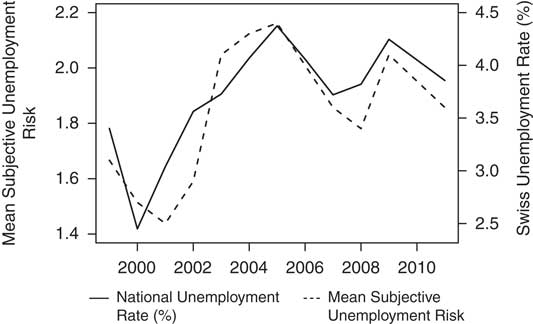
To check that changes over time in individuals’ subjective unemployment risk are also meaningful, Figure 2 compares the evolution of mean subjective unemployment risk among SHP respondents to the national unemployment rate, over the course of the panel. It reveals a remarkably close relationship between the two. In the Supplementary Material, Figure S3 shows that changes in unemployment rates among each occupational group also closely track changes in mean subjective risk assessments among respondents in those professions: subjective risk assessments are updated to reflect changes in objective risk over time.
Swiss unemployment rate and mean subjective unemployment risk in the Swiss Household Panel survey
Clearly, the SHP can be used to examine the impact of changes in unemployment risk and income on preferences for higher taxes on the rich and higher social spending over a long period. Before doing so, it is worth noting what this study does not set out to achieve. First, although the end of the panel covers the financial crisis, Switzerland experienced a relatively mild recession, and was generally stable and growing over the period covered by this study. This means that we cannot make inferences about how individual preferences might change in a period of major economic crisis. Second, all individuals in the dataset are employed (who, in any case, are the main focus of theoretical models of unemployment risk), because the SHP does not ask people out of work about their subjective unemployment risk. This article does not examine the impact of unemployment itself on preferences.
Finally, the focus is on Switzerland alone, because no other country features individual-level panel data that would render the theory testable. In particular, the SHP is completely unique in combining data on preferences over a very long period with extensive family background information. This means that caution should be exercised in generalizing the results, although this field is arguably now at a stage where most progress can be made with multiple single-country panel studies. As some leading scholars in the field recently noted, ‘ultimately, political researchers require ongoing panel surveys [...] that trace both economic experiences and political attitudes over long spans of time’.Footnote 26 In terms of its fit with the literature on welfare states, in the past the Swiss welfare state has often been characterized as having ‘liberal’ characteristics, with a relatively minimal welfare state. But it underwent a dramatic expansion over the 1980s and 1990s before stabilizing over the period covered by the panel, making it more redistributive and similar in size and structure to neighboring countries with ‘continental’ insurance-based welfare states.Footnote 27
DATA DESCRIPTION
The initial dataset for analysis contained 44,790 person-year observations for 10,655 individuals over twelve waves from 1999 to 2009 and in 2011. Respondents aged 18 or over at the time of interview are used. While item non-response is rare for the key variables, many individuals were not asked certain questions because the particular question was not relevant to them. Hence this initial sample excludes retired people (for whom unemployment risk is not relevant). There is also some attrition from the sample over time in the SHP. To make inferences about changes over time, at least two observations per individual are required, so that the sample used in this article consists of 41,979 person-year observations of 7,844 individuals. Table S1 in the Supplementary Material compares summary statistics for the sample to people who appeared in one wave only. Across all variables there are virtually no differences between the two groups. On average, individuals appear for five different waves. They usually appear in consecutive waves, but there are occasional gaps in participation.
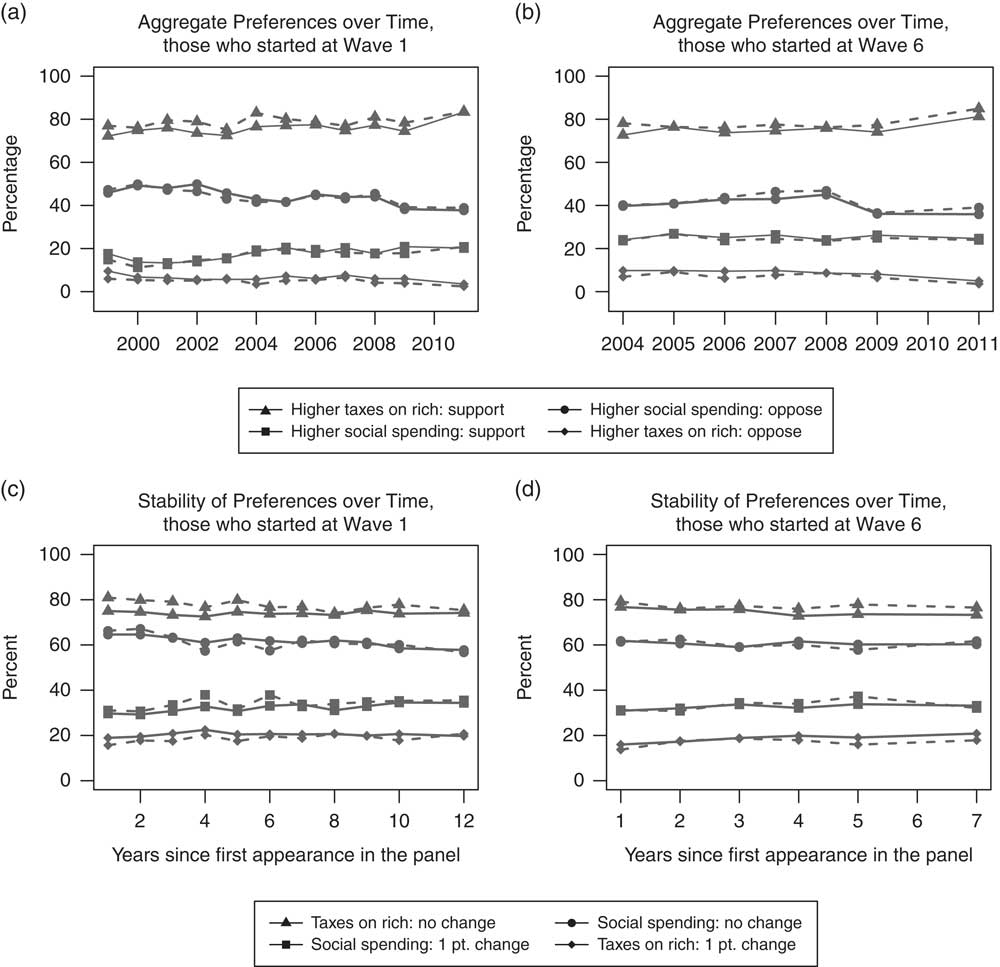
This panel is unusually long, giving an unprecedented picture of the long-run stability of preferences, both individually and in aggregate. Figure 3 looks at the stability of support for higher social spending and higher taxes on the rich. The top two diagrams look at aggregate stability, showing the percentage of respondents holding a particular view at each wave. The bottom two diagrams look at individual stability, showing whether or not sample members hold the same view in any subsequent wave as they held in the first wave they appeared in. They display the percentage of respondents holding the same view, or changing by one point up or down on the three-point scale. The figure shows results only for those who began participating at the start of the panel, in 1999, and those who began as part of the replacement sample, in 2004 (wave 6), to abstract from any changes in the composition of the sample over time. It includes both all participants regardless of when they left the panel, and the subsample of participants who remained in the panel for every wave until the end, with no gaps in participation, allowing a comparison of the two.
Evolution of opinion over time Note: Straight lines show all relevant participants regardless of when they left the panel; dotted lines show only the fully balanced sample.

The top two diagrams of Figure 3 show that aggregate preferences were quite stable over time, although there is a slight shift of opinion against social spending. Those who remained for the full six- or twelve-year periods without gaps exhibit very similar behavior to the sample as a whole. Higher taxes on the rich were very popular throughout the panel: just under 80 per cent of respondents were in favor, while just over 40 per cent favored higher social spending. The bottom two diagrams show that, for taxing the rich, around three-quarters of respondents continued to hold the same attitude even twelve years on, whilst around three-fifths of respondents did so for social spending. A sizeable proportion of the sample also tended to change by one point. But the most significant movement – from supporting higher spending, to not supporting it, for example – was rare. Overall, preferences were quite stable over time.Footnote 28
DATA SET-UP AND CROSS-SECTIONAL RESULTS
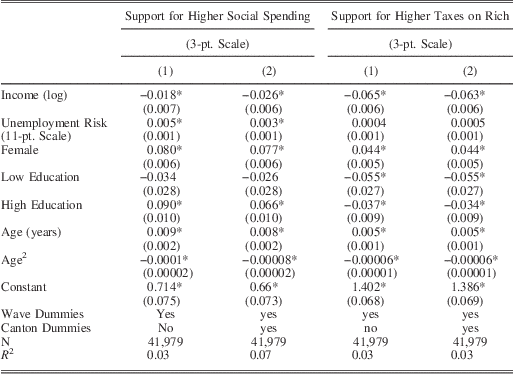
Before estimating the causal effects of circumstances under weaker assumptions, cross-sectional relationships are examined. These are intended as a comparison to the previous literature, rather than to act as a test of the theory. Previous studies have looked at these correlations using multivariate regressions, and therefore I now do the same thing, with a similar set of control variables. The results are shown in Table 1.
Cross-Sectional Models

* p<0.05; standard errors are clustered by household.
All person–time observations are pooled together, estimating models with dummies for each wave. Household income is logged, since the distribution is heavily skewed. In addition, all models include a standard set of demographic controls: gender (a dummy equalling 1 if the respondent is female), indicators of education (a dummy for ‘low education’ which includes those who did not complete basic high school, and a dummy for ‘high education’ which includes college graduates), age and age squared. Switzerland is a federal country, and so there may be strong regional effects on preferences. Thus models 2 and 4 also include dummies for canton of residence (twenty-seven in total). These results are displayed separately because this subnational variation has not been captured in past studies. Both wave and canton dummies proved to be highly significant, but are not shown for reasons of space.
For ease of interpretation, OLS models were used, with the dependent variables recoded on a three-point scale where 0=oppose, 0.5=neutral and 1=support. Sampling for the SHP is carried out at the household level, meaning that the dataset contains multiple individuals from the same household. Standard errors are therefore clustered at the household level in all models, which also accounts for clustering at the lower level of individuals within households.Footnote 29 Table S2 in the Supplementary Material shows that none of the conclusions from Table 1 are changed using ordered logit models, or logit models which code ‘support’ as 1 and are equal to 0 otherwise.
For the models for social spending, the results show that both income and subjective unemployment risk are significantly associated with a preference for higher preference in the expected directions. For example, in model (1), a 10 per cent rise in income and a one-point rise in unemployment risk are predicted to lead respectively to a 0.003-point fall and a 0.005-point rise in support for higher social spending on the scale of length 1. In terms of the direction of the coefficients, these are the same patterns that have been shown in the previous literature. The estimated coefficients are relatively small; the coefficient for income is somewhat smaller than has been typically found across the OECD countries in previous studies. For higher taxes on the rich, meanwhile, income is significantly negatively associated with a preference for higher taxes in both models, with the coefficient somewhat larger than for social spending. Unemployment risk correlates in the correct direction but is not significant. The results are also not affected by the inclusion of cantons. In the main, therefore, these results show that Switzerland exhibits similar patterns of support to previous studies: preferences mostly differ by income and unemployment risk in the directions that we would expect.
CHANGES IN CIRCUMSTANCES AND PREFERENCES
Here, models with individual fixed effects are estimated. These regressions capture the causal effects of economic circumstances under the weaker assumption that any unobserved heterogeneity is time-invariant, effectively using ‘each individual as his or her own control’.Footnote 30 Mathematically, they are identical to regressions that are specified as differences from over-time averages for each individual. This means that if, in general, changes in economic circumstances cause changes in preferences, this effect will be picked up in the estimated coefficients. The models are designed to test the first hypothesis, namely the idea that individuals do not adjust their preferences directly in response to circumstances. This theory implies that we should find a null result: once we are able to control for long-standing, unobserved characteristics of individuals that lead to a correlation of economic circumstances and preferences (such as ideological values formed early in life), the partial correlations observed in the pooled cross-sectional data between economic circumstances and preferences should disappear.
Because individuals are tracked for up to twelve years, changes in preferences could be determined by changes in policy. However, in the Swiss case, this is very unlikely to be an issue. After two decades of reform, the period from the late 1990s to the present has been marked by stability in Swiss welfare policies, social spending and taxation.Footnote 31 This is demonstrated in Figure S4 in the Supplementary Material, which shows that social spending as a percentage of GDP fluctuated only mildly over the panel between 18 per cent and 20 per cent, with no evident trend, and that tax rates on the rich were almost completely unchanged in every year. In addition, Figure 3 provides very little evidence of aggregate shifts in either dependent variable, which we would expect to see if people were responding ‘thermostatically’ to changing policies.Footnote 32
Nonetheless, in case there is any impact from policy changes that are not captured by Figure S4 or in the aggregate opinion data, dummy variables for the waves are included. They control for wave-specific effects, such as a sudden change in spending, that could cause respondents to change their average preference, allowing the regressions to capture the additional impact of individual economic circumstances. The final wave dummy (12) had to be dropped to allow age to appear in the regressions, since age is perfectly collinear with time at the individual level. This omission is unlikely to be material, however, as the results are not affected by omitting the wave dummies altogether, which is consistent with the very stable policy environment over the panel (see Table S3 in the Supplementary Material).
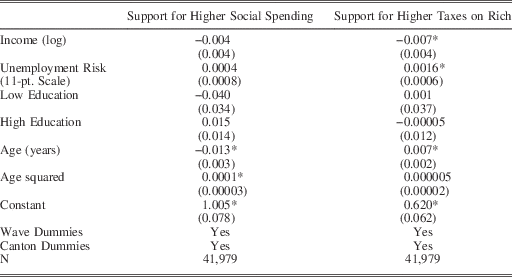
The fixed effects results are shown in Table 2. Again, standard errors are clustered by household, and models are estimated by OLS. They have the same controls as Table 1 including cantonal dummies, with the exception of gender, since it is constant over time. The results no longer show any evidence of a statistically significant relationship between preferences for social spending and either income or unemployment risk. For taxes, income remains significant at the 5 per cent level, but the estimated coefficient is about six times as small relative to the comparable cross-sectional model. These results are clearly consistent with Hypothesis 1.Footnote 33 In contrast to the cross-sectional results, unemployment risk positively affects preferences for taxes, and is significant at the 5 per cent level. This result for higher taxes is explained below, when I look at the impact of large changes in circumstances.
Models with Individual Fixed Effects

* p<0.05; standard errors are clustered by household.
For now, two potential issues, primarily affecting the social sending regressions, need to be discussed. First, there could be ‘ceiling effects’, where a substantial fraction of the fraction of sample members are already at the maximum possible value of the three-point scale for support when their economic circumstances change, so that further increases in preferences cannot be detected. However, this ought to be more of an issue for the regressions involving taxing the rich, since a substantially higher proportion of the sample is at the maximum value for this variable (Figure 3). Yet it is for taxation where we do find significant effects for the key variables. As a further check, Table S5 in the Supplementary Material looks only at people who began their first wave in the middle category. The results are unchanged.
More importantly, whether or not these results genuinely indicate the lack of a causal relationship depends on how precisely they are estimated, which is affected by how much over-time variation exists in the independent variables. But a comparison of Table 2 to Table 1 shows that the standard errors for the key variables are not larger in the fixed-effects models than in their cross-sectional counterparts. Differences from the cross-sectional set-ups are driven by large falls in the coefficients, rather than by falls in precision, meaning that for social spending, the effects of economic circumstances on preferences are tightly estimated around zero. Moreover, many respondents go through changes in risk perception and income. 37 per cent of all wave-to-wave changes in unemployment risk were two points or more, and 43 per cent of changes in income were 20 per cent or more (both in absolute terms). The full distribution of changes is shown in Figure S5 in the Supplementary Material. Overall, in contrast to the cross-sectional results, it appears that no regular causal relationship exists for social spending, as the theory predicts, and with taxes and income, the strength of the true relationship is likely to be overstated in a cross-sectional set-up.
THE IMPACT OF LARGE CHANGES
Hypothesis 2 argues that big changes in economic circumstances can change preferences, because they provide information and motivation for people to reconsider their interests. This is the most difficult hypothesis to test, because the SHP features relatively few very large changes in income or unemployment risk. 5 per cent of total wave-to-wave changes in risk were of five points or more (up or down), 4 per cent of changes in income involved drops of 50 per cent or more, and 13 per cent of changes involved rises of 50 per cent or more. Nonetheless, I offer two separate pieces of circumstantial evidence that together suggest that large changes in circumstances, particularly deteriorations, can alter preferences.
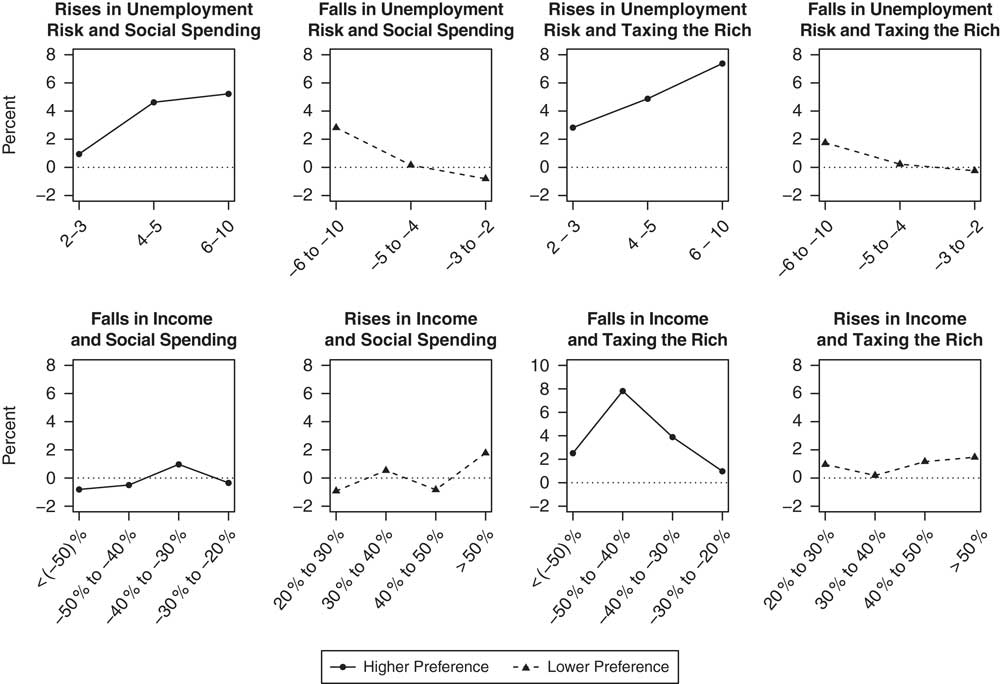
First, Figure 4 simply plots the raw data. For different-sized changes between any waves t and t−1, it compares the proportion of respondents whose preference changes in the direction predicted by theory, to the same proportion for a baseline group of respondents whose circumstances barely changed. This means that diagrams showing falls in unemployment risk or rises in income involve the percentage of respondents decreasing their preference for social spending or taxation, and diagrams showing rises in unemployment risk or falls in income involve the percentage of respondents increasing their preference. Each shows the difference between this and the equivalent percentage for the baseline group.Footnote 34
Changes in circumstances and changes in preferences: percentage of respondents changing their opinion in direction predicted by theory, compared to baseline Note: Diagrams plot the percentage of respondents in each group who change their preferences in the direction predicted by theory, minus the same percentage for a baseline group who did not experience a substantial change in circumstances.

If large changes in circumstances matter but small changes do not, respondents who experience large changes should change their preferences in the direction predicted by theory more often than the baseline group. Figure 4 shows that this is indeed the case, in general. For example, in the top left diagram we see that those whose unemployment risk rises by two to three points are no more likely to increase their support for social spending than those in the baseline group, but people who experience larger changes are more likely to do so. Similar patterns exist for the other three diagrams exploring unemployment risk, with the pattern considerably stronger for rises in unemployment risk than for falls. When it comes to changes in income, the pattern of very large changes mattering mostly only occurs for falls in income and taxing the rich. Looking across all eight diagrams, it is clear that deteriorations in circumstance (where three out of four diagrams show the expected patterns) are more likely to lead to the expected preference change than improvements. Although the differences found are quite modest, in the context of a dataset where few respondents experience very large changes in circumstance, they offer tentative evidence in favor of the second hypothesis.
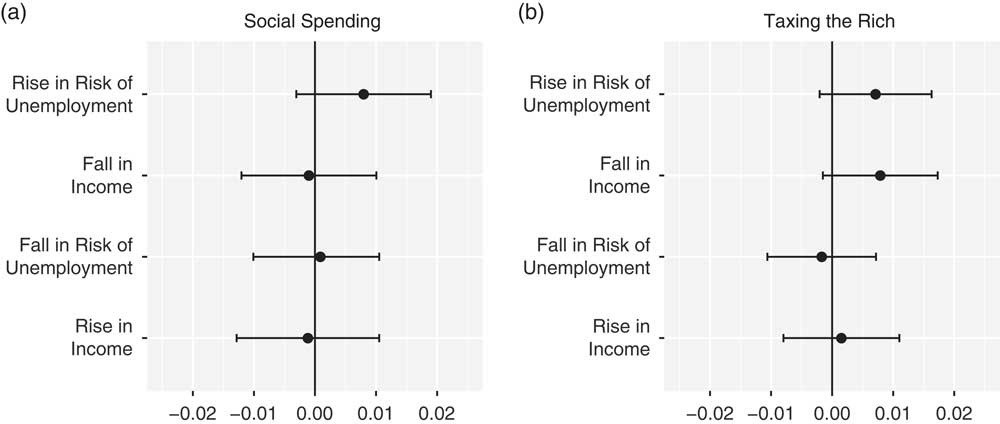
Second, to further corroborate these findings, I estimated a new set of fixed effects regressions that replace the measures of economic circumstances from Table 2 with dummy variables for large changes in circumstances, but were otherwise identical. Rises in income were more common than falls, so I defined large changes as being changes greater than or equal to the 10th and 90th percentiles of the distribution of changes. In addition, it may take some time for substantially altered circumstances to impact preferences, so as well as large changes that occurred between t−1 and t, the dummy variables also equalled 1 if the changes occurred at t−2 or t−3 and were sustained into t.
The results for the ‘big change’ variables are shown in Figure 5, which shows their estimated coefficients and associated 95 per cent confidence intervals (results for the other coefficients were the same as Table 2). For three of the four deterioriations in circumstance (rises in unemployment risk in both cases, and falls in income and taxing the rich), the estimated effects are in the expected direction, although they do not quite achieve significance at the 5 per cent level (p-values are between 0.1 and 0.16). This offers further tentative evidence in favor of large deterioriations in circumstance mattering, and closely mirrors the patterns in Figure 4, but there is greater uncertainty than the results for the other hypotheses in this article. Overall, substantial deteriorations in circumstances seem likely to lead people to increase their support for social spending and taxing the rich, and more rarely, improvements in circumstances could lead to falls in support. Arguably, deteriorations convey more news to respondents about their economic prospects than improvements.
Fixed-effects regression results for big changes in circumstances (regression coefficients and 95 per cent confidence intervals)

Crucially, this provides a first crucial building block in understanding why preferences and economic circumstances are strongly related in cross-section. People who appear poorer in cross-section may have experienced adverse economic shocks, which changed their preferences to be in line with their economic situation. This also helps to clarify the original fixed effects results in Table 2. Those are based on within-person changes, just like Figure 4, and suggest that unemployment risk is unrelated to preferences for social spending. The results in this section suggest that, while this may be true in a general sense, it is nonetheless the case that very large changes in unemployment risk can shift preferences for spending. Meanwhile, Table 2 also indicated a weak general relationship between preferences for taxing the rich and circumstances. Looking at Figures 4 and 5, it seems that in these cases, the fixed effects regressions were able to detect the impact of large changes. But they make clear that the original regression results should be interpreted as only large changes mattering.
PREFERENCE FORMATION
Now, the SHP’s rich data on its participants’ backgrounds are used to explore the third, fourth and fifth hypotheses. The third hypothesis states that early socialization affects preferences for redistribution and social policy through parents passing on their ideological beliefs: people with left-wing parents will be more supportive of social policy. The fourth argues for economic socialization: people whose families experienced economic hardship in their formative years will be more supportive of social policy and redistribution, while the fifth contends that labor market experiences in people’s formative years change their sense of their long-run economic standing, which in turn affects preferences.
I begin by looking at ideological and economic socialization within the family (the fourth and fifth hypotheses), using questions from the SHP that ask respondents about the political and economic background of their families. The first two questions ask about the political beliefs of respondents’ parents, asking respondents to place their parents on an eleven-point ideology scale from left to right. Specifically, they say ‘when you were about 15 years old, where did your father/mother stand politically, if 0 means “left-wing” and 10 means “right-wing”?’ The sample size is reduced a lot in both cases: almost one-third of respondents did not answer the question about their father, rising to almost a half for mothers. For ease of interpretation, these parental ideology variables were collapsed into dummy variables for ‘left-wing father’ and ‘left-wing mother’, equalling 1 if the parent was perceived to score a 4 or less on the eleven-point scale (the results also go through using the full scale). If there is socialization within the family, then people whose parents were more left-wing during their formative years should be more supportive of higher social spending and higher taxes on the rich.Footnote 35
The other two variables used in this section focus on economic background. The first uses information on the occupations of respondents’ fathers, which the SHP places into eight different occupational categories. I turned them into a binary variable that takes a value of 1 if the father had a lower income profession (including ‘skilled non-manual’, ‘skilled manual’, and ‘unskilled manual or non-manual’). The second is a binary variable that takes a value of 1 if the respondent reports that their family experienced ‘financial problems’ during their youth. To fully capture people who grew up in poorer circumstances, both of these variables were combined into a single indicator (‘poor family’) taking a value of 1 if the respondent had a low-income father or a family that experienced financial problems.
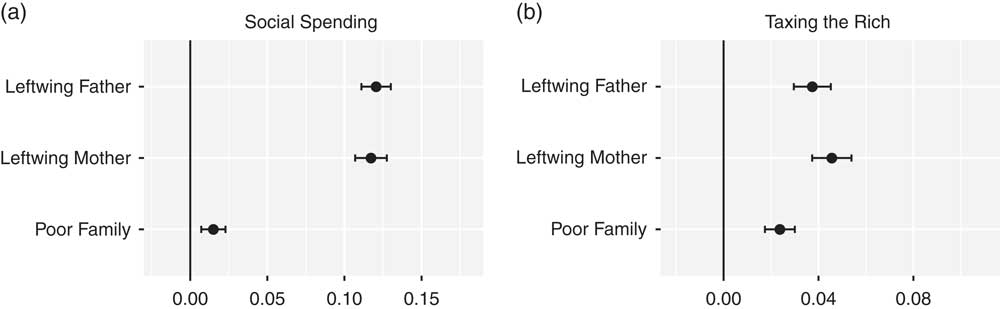
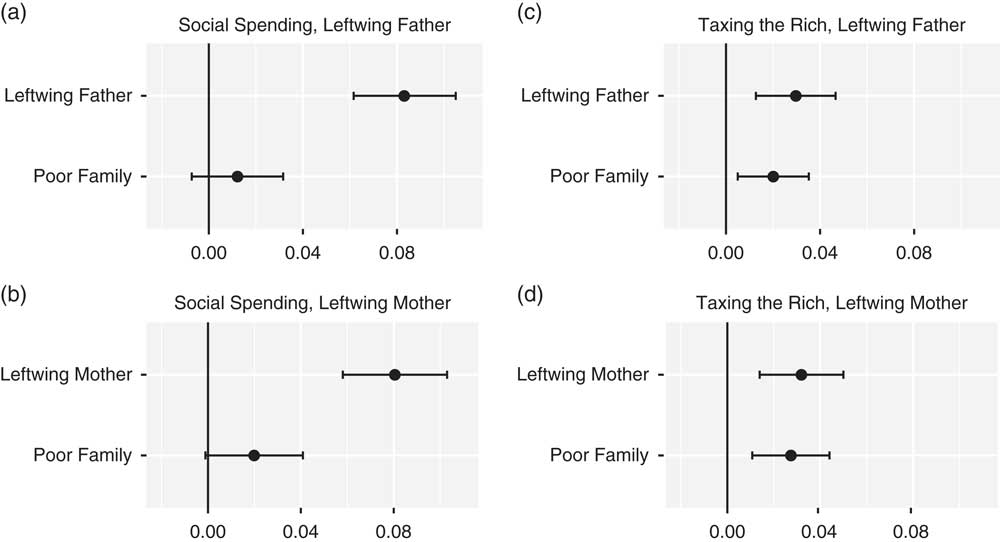
Figure 6 displays initial results for the association between these three family background variables (left-wing father, left-wing mother, poor family) and outcomes, using differences in means and their 95 per cent confidence intervals. They correlate with preferences in the expected directions: having a left-wing father or mother is associated with more than a 0.1-point rise in support for higher social spending on the scale of length 1 and a 0.04-point rise in support for higher taxation on the rich. The estimated differences are essentially equal for mothers and fathers, and they are substantively large, being about the same as the difference between men and women, or low and high educated respondents. Coming from a poor family is associated with greater support for these measures by smaller, but positive, amounts. Together, these provide preliminary evidence in favor of Hypotheses 3 and 4.
Estimated differences in means and 95 per cent confidence intervals for family background variables Note: In each case, the figure plots the estimated difference in mean response between those that did and did not possess the relevant family attribute (e.g. between those with and without a left-wing father). N=27,260 (left-wing father), 22,571 (left-wing mother) and 35,422 (poor family).

Unsurprisingly, these variables are also correlated with each other – for instance, 35 per cent of observations with left-wing fathers are from poor families, compared to 22 per cent without left-wing fathers – as well as other characteristics of the respondents. As a result, I also assessed their potential impact by including them in pooled cross-sectional regressions that are otherwise identical to Table 1 (including wave and geographical dummies). These regressions can determine whether or not parental ideology and economic situation continue to be significantly correlated with preferences while controlling for the effect of each other, as well as other characteristics. Because the parental ideology variables result in large reductions of the sample size, models were estimated containing each separately. Coefficients and 95 per cent confidence intervals for these variables are shown in Figure 7 (full regression results are in Table S6 in the Supplementary Material). All of the estimated partial correlations are in the same direction as Figure 6, and are only slightly smaller. In the regression for higher social spending containing father’s ideology, the coefficient on ‘poor family’ is not significant at the 10 per cent level (p=0.22), but otherwise, all remain significant at the 5 per cent level, or close to it (p=0.06 for the coefficient on ‘poor family’ in the regression for social spending containing mother’s ideology).
Regression coefficients and 95 per cent confidence intervals for family background variables

This suggests that, overall, socialization is both economic and ideological in nature. It involves both parents passing on their ideological beliefs, and the long-lasting effects of living in relative poverty when young. Of course, it is likely that parents’ ideologies were in part based on their economic situations, so that some of the transmission of ideology between generations may itself be economic in nature. It may be useful to view the estimated coefficients on parental ideology as an upper bound on the ‘pure’ ideological transmission of values. Nonetheless, parental ideology and economic situation appear to impact their children’s preferences independently, although I do not of course claim to have established a definite causal relationship, given the nature of the data.Footnote 36
These variables are also correlated with respondents’ contemporaneous economic circumstances. Specifically, those with a left-wing mother have a subjective unemployment risk that is on average 0.23 points higher than those without, and equivalent figures are 0.17 for the left-wing father variable, and 0.23 for the ‘poor family’ variable. Such differences are equivalent to the difference for those with and without a university education, for example (0.22). For income, observations with a ‘poor family’ had annual household incomes of approximately 7,000 Francs lower than those without, but there turned out to be no substantial difference in average household income between those with left-wing parents and those without. Taken together, this means that part of the explanation for the correlation in cross-section between contemporaneous economic circumstances and preferences is that those with lower income and higher unemployment risk come from families that were poorer and more left-wing. However, these differences are quite modest. We need to look for further explanations in order to fully capture the impact of early life experiences.
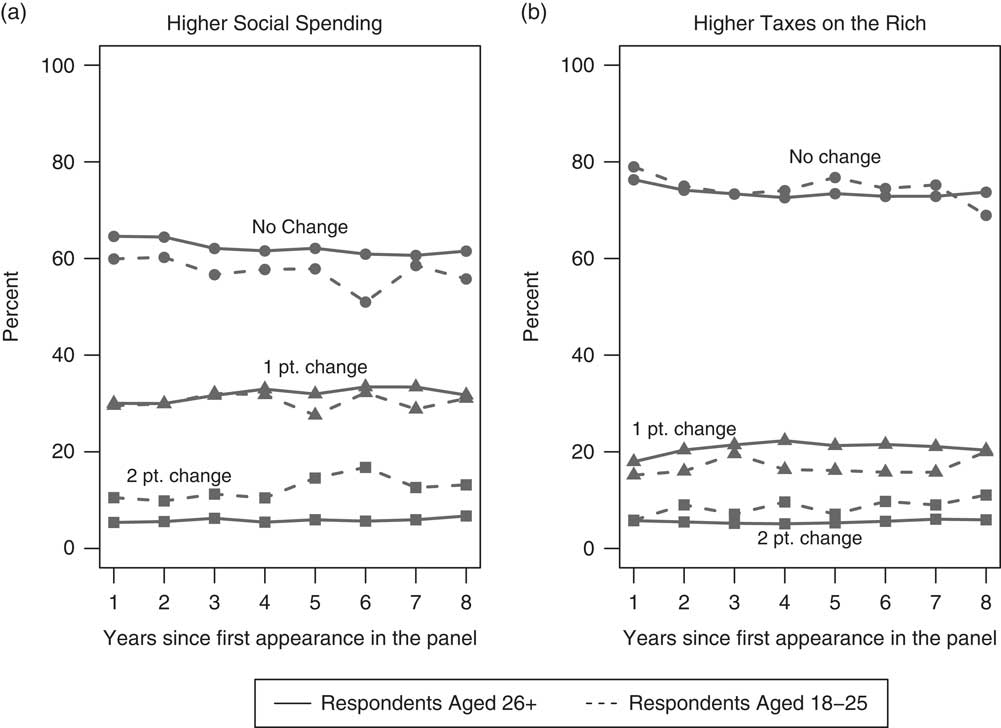
To do so, early learning during respondents’ ‘impressionable years’ is now examined, testing the final hypothesis. It states that younger voters are more likely to change their opinions than older voters, and that therefore, economic changes during people’s youth leave a lasting impression on preferences. To begin with, Figure 8 examines the stability of preferences by age, presenting the same analysis as the bottom panel of Figure 3, split by those aged 25 and under in their first wave, and those over 25 in their first wave, including only those who were in the panel for six waves or more to give a reasonable period over which to assess stability. It shows that young respondents were indeed more likely to change their preferences. For social spending, the preferences of the young are much more variable than the preferences of those over 26. For taxing the rich, preferences are more stable overall, although the proportion of younger people changing by two points is twice as high as for those over 25. Overall, young people’s preferences are more variable.
Variability of preferences by age group at start of panel Note: Displays the percentage of respondents holding the same opinion, or changing by one or two points, in any subsequent wave relative to the first wave.

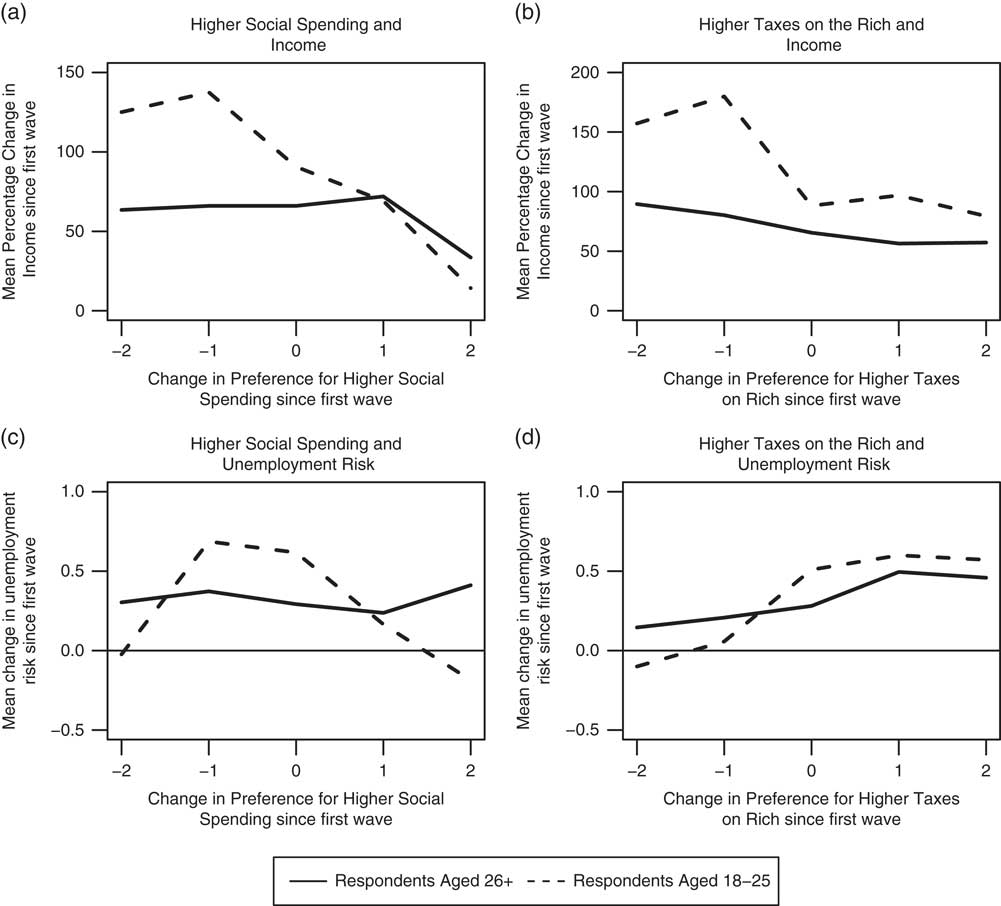
Strikingly, it now turns out that, in general, these changes in preferences among the young are strongly associated with cumulative changes in economic circumstances. To show this, Figure 9 looks more closely at the two groups appearing in Figure 8, assessing cumulative changes over people’s youth (those aged 25 and under), versus other ages. Specifically, it plots cumulative changes in preference over these six (or more) waves against the mean cumulative change in income or unemployment risk associated with each level of preference change. Hypothesis 5 suggests that those who experience large improvements or deteriorations while young are more likely to change their preferences in the expected direction.
Mean changes in economic circumstances since first panel wave compared to changes in preferences, by age at start of panel

Consistent with this, Figure 9 shows no clear relationship between cumulative changes in income and preferences for those aged over 25. But for those aged 25 and under, there is a negative relationship: decreases in preferences for social spending and taxing the rich are associated with greater rises in income than is the case for increases. With unemployment risk and social spending, no clear patterns are evident for either group. For taxation and unemployment risk, a positive gradient exists: increases in preference for taxing the rich are associated with greater increases in unemployment risk than is the case for decreases, and the gradient is much clearer for the young than the old.
So in three out of four cases, the patterns are as predicted by the theory. There is evidence of learning from early experiences. When the young experience positive or negative labor market experiences over a number of years, they are much more likely than the old to change their preferences in the directions predicted by theory. Now, if it is the case that economic shocks in one’s youth are relatively enduring, this will also lead to a lasting correlation between income, unemployment risk and preferences. It is difficult to assess the long-term persistence of labor market experiences when young in this panel, because respondents appear on average for five years. But literature from economics has shown that the effects of economic experiences when young are persistent, since the early years of a career are often the most vital in establishing oneself. For instance, youth unemployment has a large impact on wages when much older, and people who graduate from college during a recession have lower lifetime earnings.Footnote 37
DISCUSSION
I have shown that, in the Swiss panel studied here, preferences for higher social spending and taxes on the rich are mostly not based on individuals’ immediate income and unemployment risk, although large changes – particularly deteriorations – seem to bring about changes in preferences. Polarization in preferences between income and risk groups emerges as a result of ideological and economic socialization within the family as well as early economic experiences, combined with the effects of occasional large changes in circumstance. Preferences are, in general, quite stable, meaning that cross-sectional regressions may overstate the causal effect of changes in economic circumstances on preferences. The findings are consistent with the theory that voters typically rely on long-run values when forming preferences because it is often difficult for them to connect their short-run economic interests with preferences.
This suggests that material interest operates on preferences in a long-run manner, in line with economic theories of permanent income, and that insights from the political economy and political behavior traditions, ‘literatures [...] that all too often fail to speak to each other’,Footnote 38 can be combined into a unified model. People are boundedly rational; we need to consider when, not if, they act ‘rationally’. Constituencies of voters that act in line with their material interest can form, even when preferences do not always respond to economic circumstances, and are relatively stable over time. This has important implications. Due to their stability among individuals, aggregate preferences may not change with inequality or economic insecurity, even though opinion is polarized by income and risk. And because there is a cultural element to preferences acquired through socialization within the family, countries’ aggregate preferences may diverge from what might be expected, given their economic structure.
Future work should try to extend this research, although unfortunately, long-run panel datasets containing information on politics are rare. The findings could differ during crises or in other countries, or with different dependent and independent variables. For example, changes in unemployment risk may be more strongly related to changes in preferences for unemployment insurance, since it may be easier for individuals to connect their unemployment risk to unemployment insurance. I also only had information on unemployment risk, whereas Rehm et al. rightly point out that a wider range of risks, for example of ill health, are relevant to the welfare state.Footnote 39 Clearly, more work is needed to test the influence of a wider range of economic considerations on a wider range of preferences, in more countries and at more times, and to understand how individuals perceive their changing circumstances. For now, this article has provided new insights into the relationship between individual economic circumstances and preferences over long periods of time.