Since the end of the Bretton Woods System, costly financial crises in developing and industrialized countries have blemished the landscape of the international economy.1
See Caprio and Klingebiel, “Bank Insolvency,” for a discussion of recent crises and their costs.
Banking crises have disrupted credit channels and exacerbated economic contractions in both developing and industrial economies.
2 For example, see Ferri and Kang, “Credit Channel”; and Ding, Domac, and Ferri, “Is there a Credit Crunch?” for the operation of credit-channel effects in the Asian financial crisis; and Bernanke, Gertler, and Gilchrist, “Flight,” for a general discussion.
Banking crises were also a characteristic of the 1930s. Widespread financial distress occurred in at least 12 European countries, and across the Atlantic, the United States experienced a massive banking crisis.
3 Friedman and Schwartz, Monetary History; Bernanke and James, “Gold Standard”; and Grossman, “Shoe.”
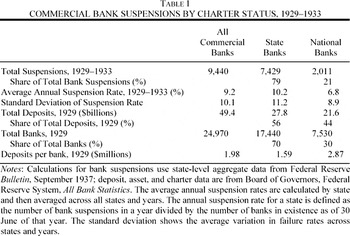
Of the approximately 25,000 commercial banks that were in existence in the United States in 1929, nearly 10,000 suspended operations between 1929 and 1933.
Although external shocks were important in triggering some of these crises, policymakers, both past and present, have also laid some of the blame on weak supervisory and regulatory institutions and have responded to crises by calling for reform. For example, G-7 countries at the 1996 Lyon Summit recommended “the adoption of strong prudential standards in emerging market economies” as well as renewed efforts “to promote effective supervisory structures in these economies”; and in 1932, the Study Commission for Indiana Financial Institutions concluded that, during the Depression, “most of the practices that are responsible for a large majority of these failures could be eradicated by supervision and regulation.”4
As quoted in Folkerts-Landau and Lindgren, Toward a Framework; and Study Commission for Indiana Financial Institutions, Report, p. 79, respectively. Recent policymakers have responded to these crises with a variety of proposals aimed at stabilizing banking systems, including uniform capital adequacy standards (Basel Capital Accords I and II), risk-adjusted deposit insurance systems, increased prudential supervision, and institutional reform of banking systems (including increased market discipline). For additional discussion of current regulatory reform, see Herring and Litan, Financial Regulation; and Goldstein, Case.
Whether such institutions matter for banking stability is a testable empirical question. This article employs a previously underutilized data set with information on county-level bank suspensions in the United States from 1929–1933 to analyze whether differences in bank regulation and supervision across states are important in accounting for the significant regional variation in bank suspensions during the Great Depression.
Previous scholars of the Depression have underscored the importance of bank failures in prolonging the U.S. macroeconomic slump.5
For example, see Friedman and Schwartz, Monetary History; Temin, Did Monetary Forces?; White, “Reinterpretation”; Wicker, “Reconsideration” and Banking Panics; and Calomiris and Mason, “Fundamentals.”
However, comparatively little attention has been paid to the regional variation in bank failures (
Figure 1) or to the role that prudential supervision and regulation may have played.
6 Exceptions are Gambs, “Bank Failures”; and Wheelock, “Regulation, Market Structure.”
Of the banks that suspended operations during the Depression, approximately three quarters were state-chartered financial institutions that operated under
different supervisory and regulatory regimes depending on the state in which they were located. Rather than eliminating existing or future state banking departments, the dual banking system, established by the National Banking Acts of the 1860s, permitted state banking departments to co-exist alongside national regulatory agencies (such the Office of the Comptroller of the Currency and later the Federal Reserve). By the 1920s significant differences in regulatory and supervisory arrangements had emerged as a result of regional experimentation and interest-group pressure.
AVERAGE BANK FAILURE RATE, 1929–1933
The analysis in this article aims to deepen our understanding of the U.S. banking crisis from 1929–1933 and shed light on the general relationship between supervision, regulation, and financial stability. I examine cross-sectional data with considerable variation in regulatory and supervisory systems as well as rates of banking distress, and improve on the methodology that has been used in previous empirical research. First, because county-level data provide a much larger sample of observations than comparable cross-country data, and because unobserved heterogeneity is less of a problem across states than across countries, the accuracy of the estimates of the effects of regulation and supervision on financial stability should be improved. Second, rather than using general proxies for institutional quality to test the relationship between supervision and bank failures (as has been the practice in recent cross-country studies of modern banking crises), this article draws on new information from the American Bankers Association surveys of state banking departments of the 1920s and 1930s to construct direct measures of the quality of bank supervision and powers granted to supervisors.7
World Bank studies such as Demirguc-Kunt and Detragiache, Does Deposit Insurance? lack data on differences in the quality of supervision across countries, and therefore rely on indirect measures (such as the rule of law and the quality of the bureaucracy) to proxy for supervisory quality. More recently, Barth, Caprio, and Levine, “Regulation” and “Bank Regulation,” have made some significant progress on gathering information on developing country banking practices, but their analysis focuses on 1999, and thus comes after many of the financial crises of the last several decades. The ability to test how supervision and regulation affect financial stability is therefore limited, especially if regulations have changed as a result of banking crises.
Third, data on differences in prudential regulations (capital and reserve requirements) and branching laws across states are also collected to provide an integrated framework for analyzing the effects of
both bank supervision and regulation on financial stability during the Great Depression.
8 Previous cross-sectional studies of the Great Depression (Grossman, “Shoe”; Wheelock, “Regulation, Market Structure”; and Wicker, Banking Panics) have neglected the role of bank supervision and failed to account for many of the estimation issues considered herein.
Fourth, the econometric analysis makes use of the unique bifurcated nature of the American dual banking system to control for other state-specific effects and differences in economic conditions across localities, and to deal with simultaneous equations bias once contemporaneous economic conditions are included.
The empirical estimates presented in this article show that differences in state regulatory and supervisory regimes help account for the regional variation in financial distress during the Depression. Counties located in states that permitted branching, enacted higher capital requirements, and gave their supervisors the authority to liquidate banks without first going through a court receivership process experienced lower bank suspension rates from 1929–1933. Those that appointed their supervisors to longer terms and gave them unlimited authority to charter banks experienced higher suspension rates.
MODELING BANK FAILURE RATES DURING THE GREAT DEPRESSION
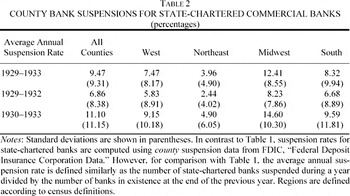
The Great Depression was a period of unparalleled financial distress. Nearly 40 percent of all banks in existence in the United States in 1929 were suspended by 1933 and were closed during the intervening period of economic hardship (Table 1). As Figure 1 and Table 2 show, the pattern of banking distress across the United States was uneven.9
The average annual suspension rates in Tables 1 and 2 for state chartered banks are computed in a similar manner; however, they are computed using different data sets. The figures in Table 1 use state aggregates from the Federal Reserve Bulletin, September 1937, to compute suspension rates, whereas those in Table 2 use county-level data from the FDIC, “Federal Deposit Insurance Corporation Data.” The suspension rates thus differ slightly, because the averages are computed at different degrees of aggregation (state versus county). The latter data set also excludes Wyoming.
Some regions and states experienced a large number (or a high proportion) of suspensions and failures, whereas others weathered the severe downturn much better. At a more disaggregated level, some counties experienced a complete loss of all their commercial state banks, while others had no suspensions during the Depression. The average annual county suspension rate for state-chartered banks from 1929–1933 (based on the number of banks in existence in each year) was 9.5 percent, and the standard deviation was 9.3 percent. By census region, counties in the Midwest had the highest average annual suspension rate over the five-year period (12.4 percent) whereas those in the Northeast had the lowest (4.0 percent).
Because differences in business and agricultural conditions across localities may account for much of the variation in failure rates across counties, I provide a simple conceptual framework for testing whether the supervisory and regulatory environment that was in place for state-chartered banks as of 1929 had an independent effect on banking distress during the Great Depression. For example, laws permitting statewide branching may have allowed banks to diversify their portfolios or weed out weak banks from their system prior to the Depression. Prudential regulations, such as capital and reserve requirements, may have provided banks with a buffer for periods of insolvency, prevented bank runs, or alternatively encouraged banks to take on additional risk in their portfolios. And supervisory arrangements (such as the authority given to supervisors and their insulation from interest-group influence) may have influenced the stability of state banking systems.
To examine the sources of variation in banking sector distress, we can decompose the suspension rate for non–Federal Reserve member, state-chartered banks, SRiq (county q, state i) into two pieces
where ai is the combined effect of all covariates common to the state and biq is the orthogonal county-specific component that combines the effect of all factors purely idiosyncratic to county q. Equation 1 implies that a properly specified estimation procedure will control for both state effects, such as differences in state-chartered bank supervision and regulation, and county-specific effects, such as differences in economic structure. Other state-level influences, such as economic conditions during the Depression, need to be accounted for as well; but including such information potentially introduces simultaneous equations bias as bank failures in a particular locality may have worsened the severity of the Depression in that area. Before estimating equation 1, I describe the differences in state supervisory and regulatory regimes on the eve of the Depression and link them to the theoretical literature on financial stability.
THE REGULATORY AND SUPERVISORY LANDSCAPE
The National Banking Acts of the 1860s gave birth to the U.S. dual banking system and created the possibility that banks in the same state could face different regulatory regimes depending on charter status.10
Many states in existence in the 1860s had already passed laws regulating their banking systems, although not all of them had organized state banking departments with supervisory authority at this time.
All national banks were under the supervisory and regulatory authority of the Office of the Comptroller of the Currency and later the Federal Reserve Board, whereas state-chartered financial institutions were under the jurisdiction of state banking departments. (By 1929, 35 percent of the state-chartered banks had also opted to join the Federal Reserve System.)
11 This subset of state banks was also under the influence of Federal regulators, although regulation was carried out at the regional level by the Reserve Banks. Because state member banks faced additional regulation and supervision, they are removed from the empirical analysis, which focuses exclusively on those differences in regulation and supervision resulting from state banking departments and state laws. I thank Joe Mason and Gary Richardson for providing some of the data on state member bank suspensions. The remaining county data on state member banks and suspensions are from 1929–1933 editions of the Rand McNally International Bankers Directory.
In theory, state banking departments could have adopted the institutional framework of the national banking system so that regulation of banking systems would have been homogeneous in 1929, but legislative decisions about bank regulation were often driven by factors that were specific to states—in particular, the motives of private-interest groups and differences in response by policymakers to public interests. As previous research has emphasized, state legislators often felt pressure to respond to earlier episodes of banking instability by passing legislation to protect the interests of depositors, such as deposit insurance and higher reserve and capital requirements. Hence, in states that had previously experienced more banking instability, regulators sometimes responded to depositor concerns by passing new banking laws. But outcomes were also influenced by the lobbying efforts of well-organized interest groups.
12 As Stigler, “Theory”; and Peltzman, “Toward a More General Theory,” have emphasized, this can make regulators and their agencies susceptible to capture.
For example, Nicholas Economides, R. Glenn Hubbard, and Darius Palia, and related work of my own, draw attention to the role of small, unit banks that lobbied for restrictions on branch banking laws; Charles Calomiris and Carlos Ramirez also stress the importance of borrowers in shaping branching outcomes (in particular, the role of landholders in wealthy states).
13 Economides, Hubbard, and Palia, “Political Economy”; Calomiris and Ramirez, “Political Economy”; and Mitchener, Supervision.
And with the emergence of financial conglomerates in the 1920s, nonbank financial service providers, such as insurance companies, were interested in impeding the growth of these new, larger financial institutions by lobbying legislatures to impose higher regulatory burdens on them. Finally, Eugene White emphasizes that competition between federal and state regulators existed.
14 State banking authorities often justified their existence on the grounds that they were more sensitive to the specific concerns of bankers and bank customers in their areas. To ensure membership in state banking systems, regulators often encouraged legislatures to offer a different menu of regulations that would be seen as more favorable to banks. As a result of these factors, substantial differences in prudential regulation and supervision had emerged across states by 1929; in turn, these differences may have influenced the pattern of state bank suspensions during the Great Depression.
Prudential Regulation and Branching Laws
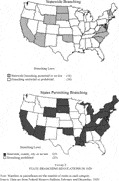
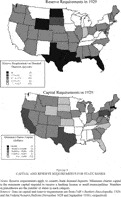
Branching laws, capital requirements, and reserve requirements differed considerably across states in 1929 (Figures 2 and 3). Interstate branching was forbidden in the United States, and national banks were severely restricted from opening branches, but state-chartered banks were allowed to operate branches if their state banking codes authorized them.15
The McFadden Act of 1927 permitted national banks to establish local branches in the city of their home office if a state law allowed branching, but the number of branches was also restricted. They could open no new branches in cities with fewer than 25,000 people, only two branches in cities with populations between 50,000 and 100,000, and at the discretion of the Office of the Comptroller of the Currency for cities of over 100,000 (Tippetts, State Banks).
Counties located in states where branch banking was permitted may have experienced fewer bank suspensions because banks in these locations could potentially diversify their loans and deposits over a wider geographical area or customer base and insulate themselves from shocks particular to certain regions or sectors of the economy.
16 Wacht, “Branch Banking”; Lauch and Murphy, “Test”; and Laderman, Schmidt, and Zimmerman, “Location.”
Moreover, just as foreign banks have brought increased competition to inefficient domestic markets, states with laws allowing branch banking may have eroded local monopolies and driven weak banks from the system through mergers and voluntary liquidation.
17 For evidence that this took place when states deregulated their banking systems beginning in the 1980s, see Stiroh and Strahan, “Competitive Dynamics.” However, it is also possible that the expansion of branching increased competition, resulting in reduced bank profits and a system more vulnerable to crises. See Folkerts-Landau and Lindgren, Toward a Framework, for a discussion of foreign banks.
As a result of consolidation, the stability of the banking system may have been improved. Studies using state-level or country-level data on the 1920s and 1930s have found some evidence that branching stabilizes banking systems, although those using individual bank data find less support for this hypothesis.
18 For aggregate evidence, see Grossman, “Shoe”; and Wheelock, “Regulation and Bank Failures” and “Regulation, Market Structure.” Wicker, “Reconsideration,” argues that Caldwell and Company, which had over 100 branches in the South, was a primary force behind the bank failures of 1930. Carlson, “Are Branch Banks?” finds that branched banks in three states had a lower probability of surviving the Great Depression than those without branches, and Calomiris and Mason, “Fundamentals,” report that state-member banks and national banks were more likely to fail if they belonged to a branching network. It may be that branch banking provides stability at the state or county level by introducing competition into the banking system and weeding out weak banks from the system without actually improving the survivability of individual banks. Previous studies using state or country data do not control for differences in the supervisory environment.
By 1929, 25 states and the District of Columbia permitted some form of branching or did not explicitly prohibit it by law. More narrowly, eight states and Washington, D.C., allowed statewide branching in 1929. (The other states restricted branching to the city or county of the home office of a bank.) To test the effects of branch banking on financial stability, I consider two different specifications, the number of states forbidding branching and the number of branches as a percent of state banks.
STATE BRANCHING REGULATIONS IN 1929
CAPITAL AND RESERVE REQUIREMENTS FOR STATE BANKS
Prudential regulations also differed across states. Prior to the enactment of federal deposit insurance in the United States, capital was the main form of protection for depositors, and minimum capital requirements (the amount of capital required to receive a bank charter) and double liability laws were the main tools used by state banking departments to induce banks to hold more capital.19
Bentson and Kauffman, “Intellectual History.” Grossman, “Double Liability,” shows that, during the first quarter of the century, differences in liability laws across states were important for explaining bank risk taking, but he argues that these laws did not eliminate banking instability in times of widespread distress. By 1929 all but eight states had implemented at least double liability for bank shareholders. The remainder had single liability or voluntary liability laws.
Modern solvency ratios, which exist today under negotiated protocols such as the 1998 Basle Accord, require that banks hold a certain percentage of capital relative to assets that are risk-weighted. In the 1920s and 1930s, most states imposed simpler capital requirements consisting of a minimum amount of capital that was required in order to receive a license to operate as a bank. Some state banking authorities specified capital-deposit ratios as well (10:1 being the most common), but these were often issued as guidelines rather than laws. But like today's risk-adjusted capital-asset regulations, the higher minimum capital requirements of the first quarter of the twentieth century were believed to be a useful device for disciplining owner-managers.
20 Writing in 1929, B. M. Anderson, economist of the Chase National Bank of New York, partly blamed the rural bank failures of the 1920s on charter-capital laws that left banks inadequately capitalized. “The laws of certain states permit banks to be organized with a capital of ten thousand dollars in small places. There is need for reform in the banking laws to ensure that all banks have adequate capital.” (Willit, Chain, Group, and Branch Banking, p. 285.)
The theoretical literature emphasizes that both types of regulations can alter bank behavior. Minimum capital requirements cushion depositors against banks' losses due to normal business operations; the larger the contributions of the owners of the bank, the greater can be the shrinkage of assets without impairing depositors' claims.
21 Dewatripont and Tirole, Prudential Regulation; and Freixas and Rochet, Microeconomics.
Because charter capital represents the contribution from owners, higher capital requirements can also serve to chasten owners (and their managers) from taking on excessively risky loan portfolios, thus reining in moral hazard.
22 The theoretical evidence on this point is mixed. For example, Kahane, “Capital Adequacy”; Kim and Santomero, “Regulation”; and Blum “Do Capital Adequacy Requirements?” argue that capital requirements could increase risk.
Finally, minimum charter capital requirements affect entry into banking. Many states had set very low capital requirements prior to the Depression, and some contemporaries argued that these had encouraged the formation of too many small unit banks and “excess competition.”
23 Study Commission for Indiana Financial Institutions, Report.
As
Figure 3 shows, in 1929, 21 states had capital requirements lower than the requirement of $25,000 that applied uniformly to national banks located in cities of fewer than 3,000 people.
24 Capital requirements are difficult to quantify during the 1920s and 1930s, in part because both state and federal regulators applied different requirements to banks depending on the size of the municipality in which the bank was located. Some states had one population-based requirement, whereas others had multiple requirements. In states that had multiple capital requirements, this article uses the requirement that applied to the smallest municipality, which was usually for 3,000 people. Using this metric, the median requirement was $25,000 and the standard deviation was $16,000. The lowest requirement was $0 and the highest was $100,000.
Thus, the theoretical and historical literature suggests that states with higher capital requirements may have experienced fewer suspensions during the Depression.
25 Hunter, Verbrugge, and Whidbee, “Risk Taking,” provide some empirical support that minimum capital requirements reduced the likelihood of failure for de novo savings and loans in the 1980s.
Reserve requirements are an additional prudential regulation that could have influenced financial stability by reducing the risk of liquidity crises. As of 1929 all states had instituted reserve requirements for state-chartered nonmember banks, and many had rates higher than the 7 percent required for national banks or for Fed members (Figure 3).26
The median reserve requirement on demand deposits was 15 percent and the standard deviation was 3.2 percent.
Without reserve requirements, banks may be prone to holding too few reserves as they are driven to compete over depositors to increase the return on assets. Such behavior can increase systemic risk, suggesting that a socially superior outcome is possible through regulation.
27 Cothren and Waud, “On the Optimality.”
On the other hand, reserve requirements can potentially reduce monitoring incentives and result in lower quality bank portfolios.
28 For literature on bank monitoring, see Besanko and Kanatas, “Credit Market Equilibrium”; and Boot and Greenbaum, “Bank Regulation.”
Further, because they operate as a tax on bank liabilities, reserve requirements can induce banks to take on more portfolio risk to offset their reduced profits. The theoretical literature thus suggests that reserve requirements affect financial stability, but the predicted sign of their effect is ambiguous.
Supervision
Frederic S. Mishkin has emphasized that prudential supervision can work in conjunction with regulation to mitigate asymmetric information problems between depositors and banks and reduce financial instability.29
Mishkin, “Prudential Supervision.”
However, reconfiguring the powers, policies, and structure of supervisory agencies is complicated by the tradeoffs between transparent rules and supervisory discretion.
30 As Folkerts-Landau and Lindgren (Toward a Framework, p. 42) state, “The justification for discretion is that bank supervision is as much about making qualitative judgments about the integrity and competence of management as it is about maintaining compliance with quantitative rules or prudential ratios. However, one major problem with allowing supervisors discretion is that there is no guarantee it will be used impartially and objectively. Much depends on the integrity, public credibility, and competence of the supervisor, which can only be earned over time, as well as on the broader political and institutional environment.”
Supervisory systems are also influenced by politics, including decisions about who should be appointed to oversee the examination of banks, how long their terms of service should last, and whether those who appoint them can override their decisions. Because the supervisory authority and political autonomy granted to state banking departments differed considerably, it is likely that some states' regulators operated with more discretion than others. Moreover, unlike national banks (which had a uniform system of bank examinations and reports and which, under the direction of the Office of the Comptroller of Currency, had improved the handling of the liquidation of failed banks), the quality of supervision across state banking departments also varied. Financial stability may therefore have been influenced by the institutional quality, the political autonomy, and the powers given to state banking departments.
In the 1920s and 1930s many state bank commissioners were particularly concerned that their ability to monitor banks or make chartering decisions was compromised by a lack of insulation from the governors who appointed them (44 of the 48 state banking superintendents were appointed by the state's governor).31
In the four other states, they were either appointed by the state bank board or a commission of corporations, or elected. Two of the 44 were first selected by banks and then appointed by the governor (American Bankers Association, Survey, 1929).
For example, when queried about weaknesses in the statutory provisions related to the office of bank commissioner, the superintendent for the state of Arkansas wrote, “The bank commissioner is appointed by the Governor, which in some instances is bound to have a political influence upon the operation of the bank department.”
32 American Bankers Association, Survey, 1929.
Lengthening the appointment of the supervisor beyond the election cycle of the governor might have provided a more effective shield from the political motives of the state's governor. On the other hand, as the theoretical literature emphasizes, more autonomy could also induce bankers and their shareholders to attempt to increase their influence over the decisions of superintendents, such as the granting of charters or the timing of bank examinations.
33 Laffont and Tirole, “Politics”; and Martimont, “Life Cycle.”
State bank supervisors granted more independence could also have been more susceptible to corruption and more concerned with implementing their own objectives rather than the public's.
34 Chapman and Westerfield, Branch Banking; Barth, Caprio, and Levine, “Bank Regulation”; and Djankov, La Porta, Lopez-de-Silanes, and Shleifer, “Regulation.”
Because the degree of insulation of the supervisor may have affected decisions about chartering, receivership, and the timing of bank examinations, and in turn influenced stability, differences in term lengths of state supervisors are included as an additional regressor.
States also differed in terms of the quality of supervision. Researchers have noted that the quality of supervision depends on having sufficient resources to hire and train competent bank examiners.35
See Folkerts-Landau and Lindgren, Toward a Framework; and Neal, History.
If the ratio of examiners to banks in a state were small, it may have been difficult for the state supervisory agency to identify nonperforming banks and intervene before banks became insolvent.
36 If the decision to suspend a bank is viewed as a regulatory outcome, it is also possible that more vigilant supervision (as characterized here by state banking departments having more supervisors per bank) may have actually increased failures if examiners were concerned about negative spillovers.
Even the most competent examination staff would have a limited capacity to monitor bank behavior effectively, so differences in the number of examiners per bank across states may account for some of the observed geographical variation in county suspension rates.
State banking departments also differed in the authority and powers they granted to their supervisors, which in turn could have limited their effectiveness.37
Folkerts-Landau and Lindgren (Toward a Framework, p. 43) have argued that “Ideally, the supervisory authority is endowed by law with a clear mandate and powers to carry out its function. The law defines the scope of authority of the supervisor and confers authority to license and to withdraw licenses of financial institutions, approve new owners, issue prudential regulations, obtain periodic prudential reports, conduct on-site inspections, take corrective actions (including the imposition of restrictions on a bank's business activities), and close and liquidate banks.”
The authority of the state bank supervisor to expedite the resolution of failed banks is one such power that varied across state banking departments and could have influenced bank failure rates during the Depression. States that granted their supervisors the authority to liquidate banks without having a court appoint a receiver may have reduced uncertainty and limited contagion from the failing institution to the rest of the system by leading to a faster resolution of claims (including those of correspondent banks).
38 Sixty percent of states had granted their supervisors this authority.
Faster resolution may have also been important in limiting credit-channel effects that resulted from assets being tied up in failed institutions and reducing the incentives for banks to gamble for resurrection.
39 Anari, Mason, and Kolari, “Speed”; and Fry, Money.
A second difference between states is whether the state bank supervisor was given sole authority to deny or grant charters, or whether this power was placed in the hands of a board.40
In contrast to the situation for state banks, the Comptroller of Currency's office had established a system that permitted a great degree of control over the granting of new charters for national banks. Its office reviewed charter applications and based chartering decisions on economic surveys of the community where the proposed bank was to be set up. These surveys included an examination of the existing banks in the service area, the local population of businesses and depositors, and regional economic conditions. Rules formulated to limit chartering were codified as early as 1909 in the Comptroller's Instructions Relative to the Organization and Powers of National Banks.
On the one hand, many state bank supervisors believed that the “overbanking” situation of the 1920s resulted not only from low capital requirements, but also from the lack of adequate power for supervisors to restrict charters.
41 Gruchy, Supervision; and Neal, History.
When state bank supervisors were surveyed in 1934, several commented that having the authority to limit bank charters would have “aided in preventing many state bank failures in the last five years.”
42 The state bank supervisor of Maryland stated in 1933, “A number of failures might have been prevented by greater care in granting new charters.” Likewise, the Virginia Superintendent wrote, “The damage which existed began more than five years ago. We were over-banked but had no authority to prevent the organization of new banks until six years ago” (American Bankers Association, Survey, 1934).
On the other hand, concentrating chartering decisions in the hands of a single individual may have had counterproductive consequences for financial stability if it increased the incentives for banking industry lobbyists to attempt to bribe supervisors or for supervisors to make decisions based on personal rather than public interest.
43 Barth, Caprio, and Levine, “Bank Regulation”; and Djankov, La Porta, Lopez-de-Silanes, and Shleifer, “Regulation.”
Because insufficient control of licensing authority has been linked to banking instability, a variable indicating whether a state's banking supervisor had the sole authority to charter banks is included in the regression analysis.
44 See Mishkin, “Prudential Supervision”; and American Bankers Association, Bank Chartering. 42 percent of U.S. states granted this authority to their supervisors.
ACCOUNTING FOR DIFFERENCES IN BANK SUSPENSION RATES ACROSS U.S. COUNTIES
Estimating State Bank Suspensions
Perhaps the biggest obstacle to identifying the relationship between bank failures, regulation, and supervision is obtaining reliable data from periods when there was sufficient distress in banking systems. To meet this challenge, this article draws on a previously underutilized data set of bank suspensions occurring in U.S. counties during the Great Depression. (Existing research on bank regulation during the Great Depression has used either aggregate state-level data on all commercial banks or individual bank data from a few states, and has not considered the role of bank supervision).45
Wheelock, “Regulation”; and Gambs, “Bank Failures,” use Federal Reserve data on all commercial bank failures at the state level to analyze the effects of bank regulation; however, they use a series that contains both national and state banks even though national and state banks had different regulatory regimes and significantly different failure rates during the Depression. (As Table 1 shows, state banks had an average suspension rate that was approximately 4 percentage points higher than national banks). Moreover, as Calomiris and Mason (“Causes”) have pointed out, using the data on all commercial banks mixes the state bank suspension data with the national bank receivership data. Carlson, “Are Branch Banks?” and Ramirez, “Did Branch Banking Restrictions?” use limited, individual bank balance-sheet data to examine the effects of branching laws, but many state banking departments did not systematically gather this sort of information, and those that did collect it only did so infrequently (every one or two years). Their results are thus based on a limited sample of only a few states using data at low frequencies, making it difficult to pinpoint the factors that contributed to individual bank failures.
The county data not only provide a larger sample relative to cross-country or state-based studies for conducting empirical tests, but they also closely approximate the competitive environment in which banks in the United States (especially rural ones) operated in the 1920s and 1930s.
46 There were approximately 25,000 banks operating in the United States at the end of the 1920s, 80 percent of which were located in towns of less than 10,000 people and 43 percent of which had a capital stock of $25,000 or less (National Industrial Conference Board, Banking Situation, pp. 13–14). Given the fact that the automobile had only gained more widespread use in the 1920s, most depositors did not travel beyond the largest town in their area to conduct banking. In rural areas, this range likely encompassed counties as well.
The data are derived from information collected by the Federal Deposit Insurance Corporation and compiled in computer format by the Inter-university Consortium for Political Science Research.
47 Federal Deposit Insurance Corporation, “Federal Deposit Insurance Corporation Data.”
The computer files contain county-level information on bank suspensions, total number of banks, and total bank deposits for 47 states on a yearly basis.
48 There are no data on Wyoming.
In addition, the data on commercial banks are further disaggregated by charter status, permitting an analysis of the relationship between state-chartered financial institutions and regulations that varied for these institutions across state borders.
Following equation 1, the dependent variable is the suspension rate from 1929–1933 for non-Fed-member, state-chartered banks located in county q, state i, computed as the sum of the bank suspensions between 1929 and 1933 divided by the number of banks in existence on 31 December 1928.49
To be sure, there are differences between suspended and closed banks. This article follows the Federal Reserve's convention: state bank suspensions comprise “all banks closed to the public, either temporarily or permanently by supervisory authorities or by the banks' boards of directors on account of financial difficulties, whether on a so-called moratorium basis or otherwise, unless the closing was under a special bank holiday declared by civil authorities. If a bank closed under a special holiday declared by civil authorities and remained closed only during such holiday or part thereof, it has not been counted as a bank suspension” (Federal Reserve Bulletin, September 1937, p. 866). Banks that become insolvent and are placed under receivership or that liquidate their assets voluntarily due to distress might properly be termed failures, and are a subset of suspensions. The county data do not permit one to distinguish between failures, temporary suspensions, or banks that later merged as a result of distress. Mergers induced by banks failing no doubt occurred, although bankruptcy laws of the period did not give receivers any responsibility to resuscitate banks through actions such as mergers (Mason, Determinants). Unfortunately, detailed information for state, nonmember banks at the county level is scarce; such data would permit one to extend the analysis presented in this article to consider postsuspension outcomes. Although the data used here potentially overstate the true number of failures for state-chartered banks, unless there is some systematic reason to believe that there are important regional differences between failures and suspensions, the hypotheses tested should not be adversely affected if suspended banks are included. In their study of contagion effects during the Depression, Calomiris and Mason (“Causes,” p. 30) point out that this distinction in theory can be important, but they do not find that their results for the 1930–1932 sample period are sensitive to the choice of failure data versus suspension data.
We regress the county suspension rate for state-chartered financial institutions on the state bank regulations and supervisory practices that were described in the section on the regulatory and supervisory landscape and an additional set of conditioning variables. Rather than relying on characteristics of a country's institutional environment to proxy for supervision, as in Asli Demirguc-Kunt and Enrica Detragiache's work, previously unused survey data from the American Bankers Association on the authority and quality of state banking departments permit the construction of
direct measures of prudential supervision.
50 American Bankers Association, Survey, 1929. See Demirguc-Kunt and Detragiache, “Does Deposit Insurance?”
Indicator variables for whether the state bank supervisor had the sole authority to license or charter state banks and whether the supervisor could liquidate failing banks without first having a court appoint a receiver are included. The number of banks per examiner and the length of the supervisor's term (in years) are used to measure the quality of state supervision and political insulation, respectively.
In contrast to previous research, which likely suffers from omitted variables bias, the supervisory data are combined with differences in state bank regulation in order to provide an integrated analysis of the effects of regulation and supervision on financial stability. In particular, we include a branch-banking dummy variable, which takes on a value of one in states where branching was prohibited. Data on the number of state bank branches (and branching laws) are from the Federal Reserve Bulletin (February and December, 1929). To capture differences in quantitative regulations across states, we include the minimum capital requirement for state-chartered banks in small municipalities (measured in thousands of dollars) and the reserve requirement applying to country-bank demand deposits (expressed as a percentage of total deposits). Data on capital and reserve requirements are from Polk's Bankers Encyclopedia, 1929, and the Federal Reserve Bulletin (November 1928, September 1930), respectively. All the regulations and characteristics of state bank supervision are those that were in existence at the start of 1929; they are treated as time invariant over the sample period in order to identify the impact of regulations that were in place at the start of the Depression.51
Changes in regulatory and supervisory regimes were relatively infrequent until the second half of 1933, when the banking crisis had subsided. For example, no additional states that prohibited branching legalized statewide branching from 1929–1932 (although Vermont changed from having no law prohibiting it to allowing it), and only six states changed capital requirements during these years.
The identifying assumption is that the regulatory and supervisory aspects of banking are uncorrelated with the random element of bank failures.
52 Although it is theoretically possible that there is simultaneity bias resulting from an endogenous public-interest response to bank failures, it is likely to be quite small in a study where the regulatory variables are determined at the state level and the dependent variable is based on county-level suspensions. To test whether the assignment of a county's regulatory and supervisory system is exogenous, I eliminated from the sample any border counties with populations that make up more than 20 percent of the state's population—those that might be regarded as potentially having a very strong influence on legislative outcomes. There were 37 counties that fit this criterion. When these “influential” counties were removed, the coefficients on the regulatory and supervisory variables were not significantly different from those reported in the regressions shown; this is consistent with the assumption that the particular regulatory and supervisory regime is predetermined by historical factors.
As suggested by equation 1, county-specific covariates, biq, are also included in order to disentangle the effects of regulatory and supervisory variables from local factors that may have influenced suspension rates. In particular, we include the percentage of a county's population that is rural and farm-based and the percentage of population that is employed in each of three different sectors (manufacturing, retail, and wholesale occupations). The percentage change in the average value of farms between 1920 and 1930 is also included to account for the fact that bank failures in the 1930s may have been a continuation of ongoing rural banking distress that started in the 1920s—a question that has been widely debated by economic historians.53
See, for example, Temin, Did Monetary Forces?; and White, “Reinterpretation.”
Because declining farm values are associated with declining land prices, falling farm incomes, and agricultural bank failures, they are a reliable proxy for local agricultural distress.
54 See Kliesen and Gilbert, “Are Some Agricultural Banks?”
These county characteristics are calculated using U.S. 1920 and 1930 census files on counties published by the Department of Commerce, Bureau of the Census. To account for differences in the size of banks in each county, a factor that has been negatively associated with the probability of failures in previous studies, we include the average deposits per bank in each county.
55 See White, “Reinterpretation”; and Calomiris and Mason, “Fundamentals.” Summary statistics for the independent variables and a correlation matrix of the regulatory and supervisory variables are available from the author in a longer, working paper version of this article.
Cross-Sectional Results
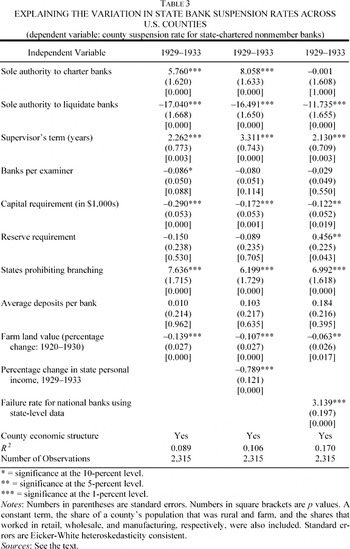
Table 3 presents cross-sectional OLS estimates (with clustered and robust standard errors) based on 2,315 county-level observations.56
There are 3,051 counties in the full sample of 47 states, but due to missing data and counties with no state non-Fed member banks, only 2,315 counties are included in the regressions. Of the 3,051 counties, 372 do not report data on state bank suspensions. In three states (Arizona, Nevada, and New Mexico), the percentage of counties with missing values for suspensions is greater than 40 percent. When all the observations from these states are dropped from the sample, the regression results for the remaining counties are very similar to those reported here.
The estimated coefficients provide evidence that supervisory and regulatory differences across states affected financial stability during the Great Depression. Counties located in states where supervisors were appointed to longer terms experienced higher state commercial bank suspension rates: an additional year in office raised the county suspension rate from 1929–1933 by a little more than 2 percentage points. (The range of term lengths varied from two to six years and the average suspension rate over the Depression was 42.4 percent.) Consistent with the theoretical literature reviewed earlier, even though longer terms for supervisors insulated them from the governors who appointed nearly all of them, they also increased the incentives for lobbyists to expend more resources to influence supervisory decisions. Supervisors with longer terms may have responded to industry lobbying by acting with less independence and more discretion in timing on-site examinations, granting forbearance, and issuing charters or banking licenses—all of which potentially undermined financial stability.
Although longer terms of appointment do not necessarily result in unfavorable outcomes for the banking system, decision-making rests more heavily on the integrity of the banking authorities in such systems because supervisors are endowed with greater autonomy. As the Massachusetts banking superintendent remarked in 1929, “Statutes of this state give commissioners ample authority to supervise banks. Quality of supervision depends on the character of the incumbent of the office of the commissioner.”57
American Bankers Association, Survey, 1929. A similar concern was expressed in 1934 by the head of bank supervision from Pennsylvania in the wake of the banking crisis: “Honest, experienced department heads, provided with means to thoroughly examine and supervise, can do more to improve the state banking system throughout the country than more restrictive banking laws.” (American Bankers Association, Survey, 1934).
The statistical evidence presented here suggests that, in some states, the discretion that went along with longer supervisory term lengths was counterproductive to stability, and the historical record provides some corroborating evidence. Raymond B. Vickers describes the situation in Florida in the 1920s as one where bankers knew how to prey on Comptroller Amos's “weakness and greed” by providing him and his examiners with unsecured loans. “Promoters eagerly sought bank charters, which regulators willingly provided. The newly sanctioned bankers then used depositors' money to fund their own projects. And with their new source of money, they bought regulatory protection by making loans to bank officials.”
58 Vickers, Panic, pp. 34–35.
Comptroller Amos was eventually indicted by a Palm Beach County grand jury for gross malpractice. Meanwhile, Florida experienced numerous failures throughout the 1920s and eventually a severe banking panic in 1929.
Counties located in states that granted supervisors the sole authority to issue charters also experienced suspension rates that were around 6 percentage points higher, a result that is both economically and statistically significant (p value = 0). The positive sign on this coefficient is consistent and complementary with the positive sign on the supervisor's term length and the theoretical literature on corruption. Supervisors with full discretionary authority over licensing decisions destabilized the state banking system by granting charters to banks whose applications had been rejected by the Office of the Comptroller of the Currency or to cronies in the banking industry who would not have otherwise had their applications approved, but who could focus their lobbying on persuading the single individual with authority over chartering decisions. It is difficult to find historical evidence of regulators admitting to “being on the take”—issuing charters in exchange for personal benefit—but some former bank superintendents have in fact admitted that their departments were susceptible to this sort of industry influence. As the state bank supervisor of Oklahoma described, superintendents in his state were indeed influenced by industry lobbyists in the 1920s. “For a period of about 3 years from 1919 until 1922 graft and corruption played a dominant role in the operation of the State Banking Department. Charters were to be had at a price.”59
In contrast to chartering authority, granting the supervisor sole authority to liquidate banks without first having a court appoint a receiver significantly reduced county suspension rates (by approximately 17 percentage points). There are several explanations for this negative association. Providing supervisors with the authority to liquidate banks resulted in a speedier liquidation process than using the court system and potentially limited contagion effects from failing institutions to the rest of the system.60
Folkerts-Landau and Lindgren, Toward a Framework.
As the Colorado state superintendent wrote in 1929, “The administration of banks in liquidation may be handled at less expense and more diligently wherein it is not necessary to constantly refer matters to the courts, which in many instances are extremely slow in the determination of important matters.”
61 American Bankers Association, Survey, 1929.
With the average liquidation time for banks around six years during the Great Depression, granting supervisors liquidation authority also allowed depositors to realize partial claims more quickly and limited credit channel effects that operate through the assets tied up in failed banking institutions.
62 As Anari, Mason, and Kolari show in “Speed,” when banks failed and were not resolved during the Great Depression, liquid deposits were involuntarily transformed into illiquid securities; this slowed down the ability to rehabilitate insolvent debtors or liquidate their collateral, and affected bank depositors' consumption decisions and the banking sector's ability to make loans.
As the banking supervisor from the state of Mississippi commented in 1929, “The bank commissioner having authority to appoint liquidating agents in failed banks and being responsible for the liquidation of these banks, has materially improved the efficiency of the department in this respect, thereby enabling the liquidation of banks to function in a businesslike way; enabling the commissioner to realize more from the assets of failed banks than would ordinarily be possible.”
63 American Bankers Association, Survey, 1929. Similarly, the head of bank supervision in Montana commented that “less interference should be had from the courts, however, where liquidation is carried on by the banking departments.” (American Bankers Association, Survey, 1929.)
Finally, speeding up bank liquidation potentially reduced the incentives for managers to engage in perverse behavior, such as gambling for resurrection before a receiver is appointed.
64 In Chile, for example, managers of troubled banks began engaging in Ponzi-type lending schemes (Fry, “Money,” p. 458).
Because many of those who held claims against failing banks were correspondent banks that also wanted their deposits returned, supervisors with this authority were not necessarily given the incentive to act only in the interests of the failing institution. Even if supervisors were apt to respond to bank-industry influence, the fact that other banks held claims with each other forced banking authorities to take into account the effects that bank liquidation decisions would have on the entire system; this likely aligned their private motives with public interest and resulted in improved stability.
Differences in state regulations also account for the variation in county suspension rates during the Great Depression. As column 1 shows, suspension rates were nearly 8 percentage points higher in counties located in states that prohibited branching. Prohibitions on branching limited the ability of banks to diversify their loan portfolios and depositor base. As many firms located in the same area became distressed during the Depression, the credit quality of banks located in counties where branching was illegal suffered more than in counties where branching enabled banks to disperse credit across economic markets. Moreover, liquidity risk was higher in geographically concentrated banks because these banks relied on deposits from less economically diverse entities. In counties where branching was permitted, banks could attract deposits from a broader base of individual and business customers, and therefore realized reductions in the variance in deposits and withdrawals—those factors that can lead to bank runs.65
See Liang and Rhoades, “Geographic Diversification,” for a discussion of this point.
By limiting competition from banks with home operations located in other counties, restrictions on branching also may have allowed more inefficient banks to persist until 1929 rather than driving them out of business or forcing them to merge; when the Depression hit, suspension rates were therefore higher in these areas.
The results in Table 3 also show a negative and statistically significant relationship between the minimum capital required to receive a bank license and bank failure rates. A $10,000 increase in the minimum capital requirement on average reduced the county suspension rate for state-chartered banks by approximately 3 percentage points.66
A one-standard-deviation change in charter capital requirements is $16,300.
The negatively signed coefficient is consistent with the theoretical literature, which emphasizes that capital requirements stabilize banking systems by reducing moral hazard (by putting more of the owners' capital at stake) or by serving as a buffer against shocks by creating a short-run cushion for banks.
67 I also tested whether nonmember state banks located in states with single liability laws experienced higher suspension rates. Although the positive sign on the coefficient is consistent with the interpretation that single liability may have increased bank risk taking, the result was statistically insignificant at the 10-percent level.
County characteristics were also included so that more precise estimates of the regulatory and supervisory variables could be obtained. Several of these covariates are also statistically significant in the regressions. As might be predicted, those counties with a more diversified economic base had lower failure rates; banks in these counties would have typically been able to hold more diversified portfolios of assets and would have had a depositor base that was less homogeneous. The percentage of a county's population engaged in manufacturing (not reported in Table 3) is negatively associated with county bank failure rates (with a point estimate of −0.33) and is statistically significant with a p value of 0.04. Banks in counties that had a mix of both industry and agriculture seem to have been better equipped to cope with idiosyncratic shocks.68
One covariate that was not statistically significant was the rural, farm population of a county—a result that is perhaps surprising because Friedman and Schwartz, Monetary History; Temin, Did Monetary Forces?; Stauffer, “Bank Failures”; and Thies and Gerlowski, “Bank Capital” have emphasized that bank failures during the Depression were overwhelmingly rural and agricultural. This was true even when an alternative measure (the number of farms per 1,000 people in a county) was substituted for the measure used here. Differences in regulation and supervision across states are likely also explaining why many banks failed in rural areas. For example, states that were rural may have also been states that forbid branch banking, had low capital requirements, or did not give their supervisors sole authority to liquidate banks, and therefore experienced higher failure rates.
The negative and statistically significant coefficient on the percentage change in farm land values suggests that those counties that had more significant reduction in land values for farms between 1920 and 1930 experienced higher bank failure rates during the Great Depression. This is contrary to Peter Temin's findings, but consistent with Robert Stauffer and Eugene White's work, which emphasizes that banks in the 1920s, especially small ones, had slow adjustment processes and were left vulnerable to a further decline in asset values or shocks to the money supply.
69 Temin, Did Monetary Forces?; White, “Reinterpretation”; and Stauffer, “Bank Failures.”
Specification Tests
Although the regressions in Table 3 account for differences in economic structure at the county level, they are predetermined and do not take into account differences in the economic conditions that prevailed during the Great Depression. Omitted variables bias is potentially a problem if contemporaneous economic conditions are not also included in the analysis.70
Finding data to address the regional differences in economic conditions has been a significant impediment to research on the feedback effects during the Depression. Broad-based measures of economic decline during the 1930s are difficult to assemble. They are nonexistent at the county level and problematic at the state level. Estimates of state GDP start in 1929, and because these figures were constructed ex post, they may suffer from significant measurement error. Alternative series such as state or county unemployment statistics are unavailable for this period.
This suggests including a broad-based measure such as changes in state personal income in the regressions (results shown in column 2).
71 The percentage change in state personal income between 1929 and 1933 is computed using data from U.S. Department of Commerce, Bureau of Economic Analysis, State Personal Income.
The coefficient on personal income is negative and statistically significant, but including this contemporaneous measure likely introduces simultaneous equations bias (economic conditions can influence bank failures and vice versa)—an econometric issue that has proved vexing in previous studies.
72 For example, Wheelock, “Regulation,” p. 30, suggests that his results do not account for the feedback between the severity of the Great Depression in a state and bank failures in a state, and therefore likely suffer from simultaneous equations bias. In his analysis, he controls for differences in the severity of the Depression by including either state-level changes in farm land prices and industrial production figures or the decline in a state's personal income, but he does not allow bank failures to in turn affect these macroeconomic indicators.
It is possible to find instruments for bank failures in the income equation (e.g., the regulatory and supervisory variables), but it is difficult to find measures using historical data that are correlated with changes in state income but uncorrelated with the error term in the bank failure equation. Without these, the system of equations would not be identified.
As an alternative strategy to the instrumental variables approach, we exploit the unique bifurcated nature of regulation and supervision in the U.S. dual banking system and include the average annual failure rate for national banks at the state level as a regressor in column 3, so that differences in contemporaneous economic conditions can be taken into account.73
I condition on state economic variables rather than those at the county level because county-level economic information such as county unemployment statistics, employment growth, and changes in personal income have been shown to be poor predictors of banking conditions such as profitability, whereas state business cycle variables have been shown to be reliable predictors of bank profitability (Meyer and Yeager, “Are Small Rural Banks?”; and Neely and Wheelock, “Why Does Bank Performance?”). Data on national bank failure rates are computed using data from the Federal Reserve Bulletin, September 1937. However, the size and statistical significance of the regulatory and supervisory variables do not appear that sensitive to using county-level failure rates for national banks instead of state-based ones.
Because national banks were regulated and supervised by the Office of the Comptroller of Currency, adding this variable should have little effect on the estimated coefficients for the regulatory and supervisory variables for state-chartered commercial banks; and because a county's failure rate contributes only a portion of a state's average failure rate, simultaneity bias is likely to be quite limited.
74 The coefficients on regulation and supervision will be biased to the extent that the county failure rate for state-chartered financial institutions affects the overall failure rate for national banks at the state level.
Including this measure has the additional advantage of conditioning state-chartered bank suspensions on a wider set of potential influences than a single measure such as personal income. (Consequently, the
R-squared rises from 0.11 to 0.17.) In the framework of equation 1, including the national bank failure rate at the state level controls for differences in a
i not attributable to supervisory and regulatory policy.
As might be expected, the coefficient on the average annual national bank failure rate is strongly statistically significant and large in magnitude, indicating that differences in the severity of the Depression across states (or other regional differences that affected national bank performance) are an important determinant of variation in state bank suspensions. A one-percentage-point increase in the average annual national bank failure rate raises the county failure rate by approximately 3 percentage points (column 3, Table 3). However, what is impressive about the results is that, with the exception of the coefficient on the dummy variable for chartering authority, the regulatory and supervisory variables maintain their statistical significance even though the national bank failure rate absorbs some of the identifying variation across counties and potentially imparts a small downward bias on these coefficients (as reflected in the somewhat smaller size of the coefficients). Moreover, the coefficient on reserve requirements is now also statistically significant at the 4-percent level. The positive sign is consistent with the hypothesis that, ceteris paribus, higher reserve requirements can induce banks to increase the share of risky assets (relative to riskless ones) in order to increase return, which could potentially increase the probability of suspension.75
A regression that also included a quadratic term for the reserve requirement was used to test for nonlinearities. The negatively and statistically significant coefficient on the quadratic term suggests that the effect on suspensions decreases as the reserve requirement rises; the linear term remained positive and statistically significant. For their joint significance, we can reject the null hypothesis that the coefficients are zero. The F statistic (2, 2352) is 4.43 and Prob > F = 0.012.
One somewhat surprising result shown in column 1 is that supervisory resources are negatively related to suspension rates, implying that states with more banks per state examiner had lower suspension rates. This might indicate that states with more resources identified more troubled banks and suspended their operations (and that they were more concerned with potential spillovers to the banking system)76
A lack of qualitative information on whether supervisors could issue “cease and desist” orders or force banks to shed risky or nonperforming loans does not permit one to formally test this hypothesis.
; however, when the failure rate for national banks is included, this effect is no longer statistically significant. We further tested the effects of differences in supervisory resources on suspension rates by including assets per bank examiner in a regression to control for the fact that larger banks may have required more attention by supervisors; the coefficient (not reported) was statistically insignificant and had the wrong predicted sign, and banks per examiner was also statistically insignificant.
77 We also considered the differential in pay between examiners or supervisors and banking-industry executives or managers, which, if large, might influence turnover and experience of supervisory staffs. This variable was also statistically insignificant and had the wrong predicted sign.
These results suggest that state-level differences in the quantity and the quality of the supervisory departments had little effect on the stability of state banking systems during the Depression once other supervisory and regulatory characteristics are taken into account.
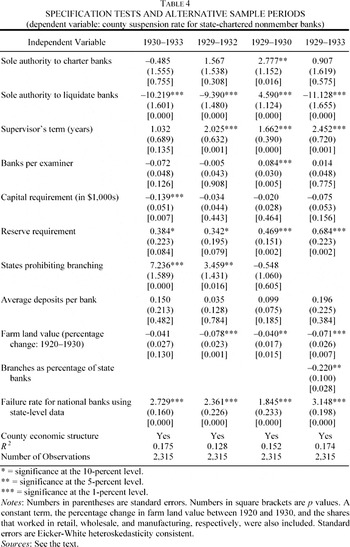
Table 4 displays regressions for alternative sample periods in order to test the robustness of the findings. Some scholars define the start of Depression-era banking distress as beginning in 1930 and view 1929 as a continuation of the banking distress of the 1920s. The statistically significant coefficient on the percentage change in farm land values between 1920 and 1930 provides some evidence that the starting date may not be driving the results. Nevertheless, to test whether this is the case, the dependent variable in column 1 of Table 4 is redefined to be the suspension rate for the period 1930–1933. The size of the coefficients on the regulatory and supervisory variables is somewhat smaller, but the signs do not change and they retain their statistical significance (perhaps with the exception of supervisory term length, which is only statistically significant at the 13-percent level).
Another concern is that the suspensions of 1933 may be considered anomalous because of the federal banking holiday declared by President Roosevelt in March of that year. The cross-sectional regression results with the dependent variable defined as the county suspension rate from 1929–1932 are shown in the second column of Table 4. The estimated coefficients on regulation and supervision are quite similar to the full-sample results. The reported coefficients for a few of the variables are smaller, suggesting that suspensions may have operated somewhat differently in 1933, but the signs on these variables and other control variables do not change. We also considered the period up through the first banking panics of 1930. As column 3 shows, the coefficients for the regulatory and supervisory variables are similar to those reported for the other sample periods (although branching laws appear to be unimportant early in the Depression). Moreover, the coefficient on the dummy variable indicating that state bank supervisors had been given the sole authority to charter banks is again statistically significant. If weak or marginal banks were granted charters by regulators who were given the sole authority to license banks, it appears that these banks had suspended operations prior to 1931. In considering model specification, the results do not appear to be sensitive to the estimation procedure. The signs and statistical significance for the regulatory and supervisory variables do not change measurably using either a log proportions model or count data analysis.78
Results from these specifications are available from the author in a longer working paper version of this article. Although the weighted least squares estimates are easy to interpret, it is possible for some of the predicted proportions to be greater than one or less than zero. A log proportions model can correct for this. Alternatively, count data analysis has the advantage over other estimation procedures of treating the zero values as containing meaningful information; it also recognizes the “granularity” in the data—that suspensions are whole numbers. This is important because 851 of the 3,051 counties experience no state bank suspensions between 1929 and 1933. Moreover, count data analysis is preferred to Tobit because the data are truncated rather than censored at zero (Tobit produces biased estimates in this case). Because of overdispersion in the data, I estimated the count data with a negative binomial distribution and control for the “at risk” population by including an additional regressor, the number of state commercial banks in each county.
Finally, because branch banking has attracted considerable attention in the literature, the last column of Table 4 addresses the issue of whether an alternative measure that computes the extent of branching within a state (relative to total state banking activity) changes the results. The positive and statistically significant coefficient suggests that states with a higher fraction of branched banks relative to all banks had lower suspension rates. A 10-percentage-point increase in state-chartered banks with branches resulted in a suspension rate that was around 2 percentage points lower for a county in that state.79
The average percentage of state banks with branches was 4 percent and the standard deviation was 8 percent. Six states had no law explicitly forbidding branching (New Hampshire, Vermont, North Dakota, South Dakota, Wyoming, and Oklahoma), but several of them effectively prohibited branch banking. I therefore considered two other specifications. Redefining the branching indicator variable so that positive values indicate states that allowed any branching (at the city, county, or state level), but excluded the states without laws, or redefining it to include only those states that permitted statewide branching, yielded negative and statistically significant coefficients—consistent with the findings presented in the tables.
CONCLUDING REMARKS
Responding to pressure from interest groups, states adopted different regulatory and supervisory systems, which often conflicted with those imposed by the Comptroller of the Currency on national banks or with those of Fed member banks. More importantly, however, they affected the incentives and behavior of banks and regulators, which in turn had important implications for the stability of state banking systems during the Great Depression.
A simple model provided an empirical strategy for identifying the sources of variation in failure rates arising from both county and state effects, and the estimation took advantage of previously underutilized data on county bank failures as well as previously untapped information on measures of bank supervisory practices. Even after controlling for differences in the severity of the Depression and county economic characteristics, supervisory and regulatory practices help explain the large differences in suspension rates for state-chartered banks at the county level. More stringent capital requirements resulted in lower rates of suspension for state-chartered commercial banks, while laws prohibiting branching and higher reserve requirements led to greater banking instability. Supervisors, if given the sole authority to liquidate banks, could do so quickly, minimizing contagion effects across banks and credit-channel dislocations. However, those states that granted their supervisors sole power to license new banks or gave them long tenure strengthened the incentives for bank lobbyists to influence supervisory decisions and experienced higher rates of suspension.
Arming governments with “best-practice” supervisory and regulatory policies can potentially improve the stability of banking systems, but the experience of U.S. states during the Depression also shows that implementing such practices may be difficult.80
It is interesting that, with the creation of a common currency and the European Central Bank, EMU members now have a single monetary authority, but supervision and regulation remain decentralized. Similar to U.S. states during the Depression, each national government has its own prudential regulations and supervisory institutions for monitoring financial institutions.
Even if policymakers are able to win the support for reform from vested interests, some institutional design decisions involve trade-offs that complicate policymakers' abilities to choose optimal regulations. In the 1920s and 1930s, policymakers in U.S. states had to choose between granting supervisors greater discretionary power and accepting the lack of oversight and outside influence that came with it, or restricting supervisory powers and acknowledging that it would be more difficult for banking authorities to act decisively, quickly, or flexibly.
I am grateful for comments and suggestions provided by Charlie Calomiris, Brad DeLong, Barry Eichengreen, Cristian Echeverria, Darren Lubotsky, Mark Rodini, Christina Romer, Sally Woodhouse, two anonymous referees, and seminar and conference participants at NBER-DAE, Stanford University, University of California at Davis, and ITAM. I also thank Richard Grossman, Joe Mason, and Gary Richardson for sharing data.