The relationship between democracy and economic inequality has immense practical and scholarly significance. Not only has the promotion of democracy become a defining feature of the international policy agenda, in part because of its supposed capacity to mitigate inequality, but theories in which voting matters (such as the median-voter (MV) model and its offshoots) rest heavily on democracies being different from non-democracies, especially in terms of distribution and redistribution. Yet until the 1996 publication of the World Bank’s ‘high-quality’ inequality dataset, assembled by Deininger and Squire, empirical studies had not reached consensus on the effect of democracy for inequality.Footnote 1 Scholars using the Deininger and Squire dataset (hereafter DS), by contrast, have consistently concluded that more democracy means less inequality.Footnote 2 To quote from a recent literature review: ‘To sum up, while the earlier research failed to detect any significant correlation between democracy and inequality, more recent studies based on improved data sets and bigger data samples typically cautiously suggest [the] existence of a negative relationship between the two.’Footnote 3
This article revisits results based on the DS data in the light of updated and considerably expanded data. Our motivation is two-fold. First, the reported statistical findings about democracy and inequality fly in the face of numerous individual country experiences. Most East Asian countries experienced modest declines in inequality between 1960 and 1990, well before they democratized, while most Latin American countries have experienced only marginal – if any – decreases in inequality since the re-emergence of democracy.Footnote 4 Because DS’s successor – the World Income Distribution Database (WIID, Version 2, May 2007) – has far more observations, especially for post-transition countries, a fresh examination may (and does) yield new conclusions.Footnote 5
Secondly, we are interested in the mechanisms by which democracy affects the distribution of income. While a variety of theories link democracy to reductions in economic inequality, existing research has not separated out the mechanisms in a convincing fashion. To explore the mechanisms, we make our models consistent with the timing implied by different theories.Footnote 6 Our results are unambiguous. We find nothing indicating a systematic relationship between democracy/civil liberties and lower economic inequality. This conclusion holds when the analysis employs the same sample of countries and nearly equivalent specifications as previous studies. It also holds with an expanded sample, different data configurations and more appropriate statistical models. Given the theoretical expectations for democracy, this article’s (non) findings are important.
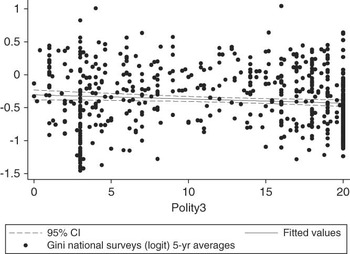
We proceed as follows. The next section reviews the literature. The following section describes the WIID data, explains the sample selection criteria and presents our econometric analysis. The final section concludes. For people who find pictures more illuminating than regressions, Figure 1 provides a snapshot of the findings.
Polity vs. Gini, all national survey, five-year averages Note: Figure 1 presents a simple visual to set up the econometrics that follow. Figure 1 is a scatter plot of Polity (x-axis) against a transformed measure of Gini (logit) using all national surveys from 1960 to 2004, collapsed into five-year averages. The same figure in purely cross-sectional form (with annual data, by five-year interval, or by decade) looks fairly similar. Using other sets of surveys (for example, only those with Quality 1 ratings) also yields a similar graph. The point is that democracy does not map well into inequality in cross-sectional form; the regressions will illustrate the time-series dimension.

The Extant Literature
With lineage that includes Aristotle, Mill, Schumpeter, Key and Lipset, the notion that political equality will reduce economic inequality is deeply rooted in the social sciences.Footnote 7 Amidst this rich literature, three general mechanisms by which democracy might exert a downward pressure on inequality stand out – none of which, it should be noted, can be directly tested with the DS and WIID data. The first and most commonly cited mechanism – taxes and transfers – springs from the MV model. In its standard form, the MV model assumes that politics is played in one dimension (monetary). The state has a single tax instrument, which is proportional to income. Revenue from this tax is then distributed on a per capita basis. The initial distribution of income and median voter’s position determine the tax rate: the greater the distance between the median voter’s income and the mean income, the higher the tax rate and, hence, the level of redistribution. Assuming that the MV is further Left in democracies than in non-democracies and/or that democratization shifts the MV to the Left, the MV model implies that democracies should have lower levels of inequality than non-democracies and, especially, that democratization should reduce inequality.Footnote 8
The second mechanism – political competition – stresses the electoral connection. While there are different stories, the common theme is that the more politicians have to compete for citizen support, the more services the public sector produces for any given level of revenue. Because democracy induces (or is defined by) competition, it improves public services. If lower income groups disproportionately benefit from government activities, notably public education, democracy should reduce the dispersion of human capital, causing inequality to fall. Saint-Paul and Verdier formalize one version of the argument, showing that reductions in inequality via the human capital channel allow for growth with equity over the long run.Footnote 9
The third mechanism – labour market regulation – emphasizes the (potential) consequences of democracy for labour market organization. As Schumpeter noted, democracy lowers the cost of political participation for organized labour, allowing it to obtain a privileged position in the policy process. In an oft-cited paper, Rodrik revived this line of argument, saying that democracies have features – notably freedom of association and collective bargaining – that empower workers. If democracy encourages unionization, centralized bargaining and minimum wages, it might also compress wages.Footnote 10
Empirical Findings
Most of the empirical literature uses the aforementioned mechanisms as motivational springboards, but the connection between theory and evidence is tenuous.Footnote 11 The mismatch between theory and evidence, as well as the econometric shortcomings, can partially be attributed to the paucity of data, which is problematic since different mechanisms call for different dependent variables and different econometric strategies.
To take one example: the MV model’s core predictions concern pre-tax and post-tax inequality, not the level of post-tax inequality. Because taxes and transfers are a unique mechanism connecting democracy to lower levels of economic inequality, the MV model can only be tested properly with pre-tax and post-tax data. Unfortunately, such data only exist for a limited number of countries, virtually all democratic. In the closest thing to a true test, using micro-level data from the Luxembourg Income Studies (LIS), Milanovic found that taxes and transfers do not accord with the MV model; because there are only two non-democracies with LIS data, regime type plays no role in his analysis.Footnote 12
In the absence of the appropriate pre/post tax data, many studies have examined the fiscal channel with samples that include democracies and non-democracies using other proxies, notably spending on supposedly progressive programmes. While these studies have generally found that democracies spend more on cash-based social transfers (for example, Kaufman and Segura-Ubergio), there are few uncontested results (such as Mulligan, Gil and Sala-i-Martin).Footnote 13 The problem is that measures of spending, even partially disaggregated ones, do not provide an accurate account of the fiscal effect of government unless the incidence of taxes and spending is assessed together, a rarity in within-country studies, let alone cross-country work. This concern about the incidence of spending is especially relevant outside the Organization for Economic Co-operation and Development (OECD), where transfers are frequently skewed towards upper income groups.Footnote 14 Examinations of regime type and taxation have (generally) found no systematic differences between democracies and non-democracies in terms of revenue. Few studies have delved into the distributional allocation of the tax burden.
To take another example, the electoral connection emphasizes changes in human capital; since human capital primarily affects the labour market, it should be assessed with pre-tax (wage) inequality, not post-tax data. Furthermore, since education is an asset that accumulates over time, long lags seem appropriate. To date, explorations of the human capital channel are scarce, but suggest some ideas. Some large-N studies (for example, that by Muller) indicate that democracy’s effects are lagged, suggesting a human capital story, while other studies (such as that of Lake and Baum) find that democracy increases educational output.Footnote 15 A complete mapping of democracy onto long-run changes in the distribution of human capital and then onto wage inequality has only been done informally for the Americas and Europe.Footnote 16
Fewer large-N papers have examined the labour channel, which is surprising since inequality probably starts with dispersion in earnings.Footnote 17 In the most compelling study to date, Rodrik found that democracy positively correlates with average wages in manufacturing, controlling for productivity.Footnote 18 He suggested that his findings might carry over to earnings inequality. The catch is that the average wage in manufacturing may not indicate less wage inequality (or gains for the poor), since it could just represent executive pay. We know, for example, that increased skewness in earnings accounts for most of the recent increase in inequality in the United States, largely reflecting higher salaries of chief executive officers (CEOs), popular entertainers and successful athletes.Footnote 19
In lieu of using the exact data required for testing theories, researchers have employed a potpourri of close substitutes, using some form of the Gini coefficient.Footnote 20 Prior to the compilation of the DS data, scholars using Gini coefficients had not reached a consensus about the effects of democracy for economic inequality.Footnote 21 While the most rigorous studies rejected any link, the paucity of data prevented any reliable conclusions (that is, virtually all of the tests relied on cross-sections).Footnote 22 The publication of the DS dataset in 1996 marked a watershed. It provided an off-the-shelf dataset with ‘standardized’ measures of inequality, covering more countries and more years – enough for panel analysis. Furthermore, the data were thought to be cleaner, having received the World Bank stamp of approval, along with some (albeit too few) caveats.Footnote 23 At least three papers in well-regarded journals used the DS data to examine the relationship between democracy and inequality. These papers cut the data differently, used increasingly sophisticated econometric models and different control variables, yet reached a similar conclusion: democracy reduces inequality. Since we found Reuveny and Li more transparent and methodologically sound, we begin our analysis by replicating their models.Footnote 24
Before doing so, we sum up the extant literature: the recent literature indicates that there is an empirical relationship between higher levels of democracy and lower levels of inequality. Those results are based in large part on the DS data. There is uncertainty about how democracy reduces inequality since comprehensive examinations of the mechanisms are scarce. In principle, however, different mechanisms suggest different measurements and different time frames. While we do not have the appropriate pre/post tax data to assess the channels, we can exploit the time dimension. The MV model implies that government policies should change quickly; contemporaneous levels or first differences seem appropriate. The human capital model, by contrast, implies long lags. The labour market channel has not been formalized. Presumably, democracy’s effect could appear either contemporaneous or lagged – so we assess both.
Replication And Extension Of Reuveny And Li
Given the myriad options in terms of data construction and model specification, there are many ways to assess the claim that democracy reduces economic inequality. Reuveny and Li take their Gini data from Easterly, who used DS data from 1960 to 1996 and then sliced it into ten-year averages. Easterly’s data appear to be cleaned on only one dimension (population coverage, national surveys only). The explicit assumption Reuveny and Li make is that differences in measurement blur like white noise.Footnote 25 They transform the dependent variable using the logit transformation (log[Gini/(100-Gini)]) to help ensure that the disturbance term is normally distributed.Footnote 26 They did not adjust for survey type.
Our replication uses the revised WIID. Like DS, the WIID is a compilation of previous studies, rather than original data. The WIID has several virtues vis-à-vis DS: it expands the number of observations, both in time and space; and it is more transparent in terms of standards and documentation. WIID identifies seven main dimensions on which surveys vary: geographical unit (national, urban, rural etc.); population covered (all, economically active etc.); age covered (all, working age etc.); income share unit (household, person, tax unit etc.); the unit of analysis (household, person); the equivalency scale (for example, whether there is an adjustment for household size and its type); and income definition (gross income, net income, consumption etc.). Each dimension typically has multiple categories, led by income definition which has ten separate headings.
As of December 2007, the WIID dataset contained 4,982 observations from 143 counties. Many observations in WIID 2 are identical to those in DS for the same country-years, but not all: WIID deleted low-quality observations when higher quality observations were available; it also revised estimates for LIS countries. Because many countries have multiple observations per year, there are far fewer country-year observations. Once sample selection criteria are applied, the number of observations falls precipitously. Only 1,315 observations (covering fifty-one countries) obtain a quality rating of 1, a number that falls to 1,092 if we require national scope and uniform population coverage (for quality ratings, see definition below).Footnote 27 Including Quality 2 surveys expands the sample to 2,773 observations and doubles the number of countries. Once the same country/same year surveys are averaged and matched with Polity, there are only 853 country-year observations (for ninety-nine countries) with Q1 and Q2 ratings, national scope and uniform population coverage.Footnote 28
Whatever data are employed, there is (presumably) some trade-off between sample size, comparability and reliability. The more that is done to ensure uniformity, the smaller the N. That said, even high-quality surveys that are comparable on all reported dimensions have different estimates for the same year.Footnote 29 Because there are myriad options in terms of data construction, we created multiple samples from the underlying data (detailed in the working-paper version), only two of which are presented here.
SAMPLE 1: All national surveys, regardless of quality – roughly the equivalent of Easterly – with no match on other dimensions.
SAMPLE 2: All national surveys with a quality rating of 1 and 2, no match on other dimensions.
To be consistent with the literature, reduce the number of missing datapoints, mitigate serial correlation and make the data compatible with right-hand side variables, we created five-year and ten-year averages from the aforementioned samples of the underlying data.Footnote 30 Because there were still a large number of missing values for the inequality measures and for the right-hand side variables introduced later, we also used multiple imputation to ensure that selection bias was not contaminating our conclusions.Footnote 31 For our analysis, we used the WIID’s ‘preferred’ Gini measure as our benchmark-dependent variable, but also tested with other permutations of the dependent variable (such as taking into account the recommended income and tax adjustments).Footnote 32
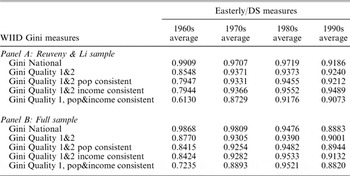
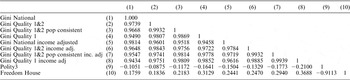
Table 1 presents pairwise correlation matrices. Panels A and B compare the WIID Gini measures with different samples of the underlying data vis-à-vis Easterly’s measure (decade averages), using Reuveny and Li’s country sample and the full country sample. Table 2 shows the pairwise correlations between our various measures of inequality (five-year averages, all countries) and different common measures of democracy, Polity and Freedom House.Footnote 33 The measures of inequality from the various samples are highly correlated with each other, but not with the two measures of democracy; for there to be a systematic relationship between democracy and inequality, most of the work must come from the econometric model and/or conditioning variables.
Democracy and Inequality, Pairwise Correlations: Panels A and B

Democracy and Inequality: Correlation Matrix, WIID Gini Measures & Democracy, Full Sample, Five-year Averages

The Baseline Statistical Model
We start with Reuveny and Li’s specification and measures.Footnote 34 Their model asks whether higher levels of democracy (and globalization) are contemporaneously associated with lower levels of inequality – in effect, an MV-style analysis. They run the following OLS model with clustered standard errors:

where Y = Gini; X 1 = democracy (Polity 0–20); X 2 = globalization controls (FDI/gdp, trade/gdp, portfolio inflows/gdp);Footnote 35 and X 3 = economic controls (GDPPC, GDPPC2).
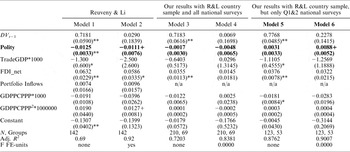
Their sensitivity analysis includes fixed effects for units and decade. Table 3 shows their econometric model with WIID’s preferred Gini measure and the logit transformation. Columns 1 and 2 present their original results with and without country fixed-effects; Columns 3 and 4 present our equivalent specifications with the same countries they report and the same underlying sample of surveys (all national surveys), but with an additional decade of data; Columns 5 and 6 present the equivalent models with more restrictive sample criteria for the surveys (all national, only quality 1 and 2).Footnote 36 In no case (with the reported or not reported models) is Polity negative and significant, even without the lagged dependent variable or Eastern Europe countries. In fact, Polity is positive much of the time, especially with the sample restricted to higher quality observations.Footnote 37
Replicating Reuveny and Li with the Updated WIID Data, Same Country Sample

Notes: + significant at 10%; * significant at 5%; ** significant at 1%. OLS models with clustered standard errors. Models 1 and 2 present Reuveny and Li’s main reported results in their Table 1, Column 1 and Table 2, Column 4. Models 3 and 4 present the results we obtain using the same countries as they report, using all national surveys. Models 5 and 6 present our results with one sample restriction (only Quality 1 and 2 surveys). As noted in the text, we could not include Portfolio Inflows. To make the results appear as something besides zeros in the table, the coefficients and standard errors for Trade and GDPPCPPP have been multiplied by 1,000; GDPPCPPP2 has been multiplied by 1,000,000. A list of countries in each model is available from the author. Results from other samples and with other permutations of the dependent variable are available.
It is certainly possible that these models are incorrectly specified: most of the variables are insignificant; many of the variables that could explain the causes of economic inequality have not been included; it is not clear whether the dependent variable is stationary; and different theories suggest different tests. Hence, we modify the econometric framework and control variables and add alternative measures of democracy. Our benchmark measure of democracy remains the (0–20) Polity scale since it is standard in this literature; we also used several binary measures derived from the Polity scale (using 6, 11 and 14 on the Polity scale as thresholds for democracy), and Freedom House’s combined political rights and civil liberties indices divided by two.Footnote 38
We now estimate the following models using five-year averages:
(1) levels regressions with contemporaneous and lagged values of Polity, allowing for deferred/cumulative effects, along the lines of the human capital story;Footnote 39
(2) instrumental variables with 1 lag of the independent variables as instruments; and
(3) an error correction model (ECM), allowing us to assess whether the variables change simultaneously and/or converge in equilibrium.
Of the three available options, we prefer the ECM.Footnote 40 While endogeneity is not addressed, the ECM rests primarily on the relatively mild assumption that the first differences are stationary; the levels regressions, by contrast, will be biased because of the lagged DV and short-time series, while the IV regressions are probably not identified, given persistence in the disturbance term.Footnote 41 Our model is:

where Xit is a measure of democracy; Zit is a vector of economic, demographic and social factors linked to inequality; δt are fixed effects for years (generally insignificant); and ζi are fixed effects for countries.
Conditioning Variables
While there are myriad causes of inequality, the general framework that is thought to offer the most traction – the human capital model – posits that inequality is driven by mismatches between the supply and demand of factors of production, notably skills.Footnote 43 While neither demand nor supply can be observed, the literature suggests some proxies. To capture human capital, we use several measures of education, notably the percentage of people age 15+ who have completed secondary education.Footnote 44 This measure is largely a stock variable, but it is correlated with Polity (0.60) and might be causally related to democracy, biasing the democracy coefficient downward. We run the models with secondary education on the right-hand side. We also use a two-stage model in which we regress democracy on secondary education and use the residual for the second stage; the democracy coefficient now includes any indirect effects that work through education.Footnote 45
Controls for the economy (arguably, the demand for labour) include: per capita income (logged), as well as industry and manufacturing value-added as a percentage of GDP. Controls used, but not shown here, include: urban population (percentage), the dependency ratio (percentage), the migration stock (percentage) and female labour participation rates (percentage).Footnote 46 Finally, the literature on the determinants of inequality strongly implicates the financial system.Footnote 47 Less developed financial systems inhibit the poor from borrowing to invest in skills or undertake entrepreneurial activities, exacerbating inequality. Likewise, high inflation may increase inequality because the poor have less access to institutions that index earnings/assets, notably banks and formal sector jobs. To capture such stories, we included: inflation (logged), bank credit (% GDP) and monetary aggregates (M2, M3, % GDP, logged). Only inflation proved to add value.Footnote 48
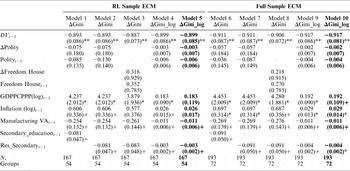
Table 4 presents the main results with our preferred controls, using only fixed-effects specifications.Footnote 49 Models 1–5 use Reuveny and Li’s country sample; Models 6–10 use all countries with at least two consecutive observations. We only present models with Sample 1; it is (generally) most favourable to the proposition that democracy reduces economic inequality and is the only one which yields consistent results. In Table 4, the point estimates on Polity are negative in both levels and first differences, but they are far from significant. A handful of the control variables one might link to inequality – secondary education, value-added in manufacturing and inflation – by contrast, are generally significant at or around the 10 per cent level, even with jackknifed models (Columns 5 and 10).Footnote 50 These results/non-results are also fairly similar in levels (not shown) and IV specifications.Footnote 51
Democracy and Inequality, ECM, WIID Gini Indicator, Data Sample 1 (national surveys), Five-year Averages, with First Differences for Democracy

Notes: + significant at 10%; * significant at 5%; ** significant at 1%. All models use data sample 1. Error correction models (1–10) estimated with clustered standard errors and unit fixed effects. Models 1–5 only use countries in the Reuveny–Li sample. Models 6–11 use all countries with at least 2 consecutive observations. _log indicates a logit transformation of the dependent variable. Res_Secondary represents the component of education that is uncorrelated with the relevant measures of democracy (the first stage results are available). Models 5 and 10 have been jackknifed. For space reasons, the constants have been omitted. A variety of alternative specifications can be found in the SSRN version of this article.
Conclusions
This article has asked whether and how democracy reduces economic inequality. We did so because the most recent statistical findings about democracy and inequality seemed incongruent with numerous country experiences. It would be hard to find a young democracy in which inequality has declined significantly, especially an abrupt fall along the lines of the MV model.Footnote 52 If anything, most of the rapid changes – from Eastern Europe – go in the other direction.Footnote 53 Nevertheless, a series of articles – all based on the DS data – reported that democracy reduces inequality. While trusting the scholars, we doubted the results. Our finding is clear: the updated WIID does not indicate a systematic relationship between democracy and inequality in either pooled cross-sections (Table 3, Models 1, 3 and 5) or panels (all other models). This conclusion is consistent across a variety of measures of democracy, samples and statistical models, regardless of whether contemporaneous levels, lagged levels or first differences are employed.
One question is what would alter these ‘non-findings’? Besides the most obvious answer – more data – several possibilities spring to mind. First, one could structure the data differently. We cut it a variety of ways – including most (if not all) of the ways used in the literature to report a negative and significant finding – but did not exhaust the possibilities. Secondly, one could address selection problems, caused by the fact that democracy may not be randomly distributed and/or by missing data. We imputed datasets with different selection criteria (for example, all countries with one Gini observation, all countries with more than four observations).Footnote 54 Using imputed data increased the likelihood of finding Polity positive and significant, but establishing consistent results proved difficult. Because the imputations provided no reason to alter our main conclusion, they are not shown here but can be seen in the SSRN version. Thirdly, one could make better use of instrumental variables (with more data or ingenuity). We used three-stage least-squares and tried the generalized method of moments (GMM), but our GMM models did not satisfy the requisite technical criteria.
A second question is, so what? This exercise matters for several reasons. First, it captures the relationship between democracy and economic inequality, as reflected in the existing data, more accurately. Democracy has many virtues, but reducing inequality may not be one of them. Secondly, it teaches prudence. The WIID data is, arguably, the best source for comparisons along the lines of those executed here, but it is still thin for reliable inferences: With just an additional decade of data, we obtained considerably different results using the same countries and nearly identical specifications.Footnote 55
Given these (non) findings and others along the same lines, we end with some questions.Footnote 56 Is democracy really a distributional game? If so, why doesn’t it show up more readily in the data? There are myriad possibilities. Four stand out. One possibility is that the quantity, quality and level of aggregation in the data obscure the realities on the ground. Democracy may well alter the distributional composition of taxes and public spending in ways that reduce post-tax inequality, especially in terms of consumption; these changes may even be large in magnitude, but too subtle to be captured by relatively aggregated data. One can readily find cases (such as Brazil) where the consumption of public services clearly became more progressive following democratization.Footnote 57 Whether there is a systematic relationship would clearly be worth exploring with micro-level data.
A second possibility is that the relationship between democracy and inequality is not just a question of whether or how, but when. That is, perhaps democracy mitigates (or increases) inequality in conjunction with factors we have not considered, such as the initial distribution of preferences over outcomes, the level of social trust, the quality of governance, and the nature and initial distribution of assets. To take just one example: the assumption of the median-voter model is that people maximize money (as opposed to, say, social solidarity); if that assumption were true sometimes, but not other times, we would expect different outcomes even with the same institutions. While the fixed effects and lagged dependent variable in our models should capture the effects of any persistent variables, such as preferences over outcomes, a more conceptually sophisticated analysis might identify interactions that we have overlooked. As such, the next logical step in this research agenda might be to identify the conditions under which democracy changes the distribution of income and assets, thereby answering when, not just whether and how.
A third possibility is that whatever gains democracy may make on the net side, markets may offset on the gross side: democracy implies that individuals have more freedom both to achieve and to fail. If there were considerable heterogeneity in initial talents (broadly defined), democracy might well increase pre-tax inequality as a small group of skilled, but heretofore constrained, earners leverage new opportunities. One can find cases (as in Eastern Europe) where this is almost certainly the case.
A fourth possibility is that our understanding of how democracy works is flawed. The power of the MV model resides in its simplicity, but the model caricatures democracy (and non-democracy), a point that has been made before, but bears reiterating.Footnote 58 The empirical literature indicates that politics is rarely a one-dimensional game.Footnote 59 And as soon as we move into multi-dimensional space, the distributional predictions of the MV model break down.Footnote 60 Even when politics gets reduced to one dimension, the ability of the government to command is limited, especially in developing countries. Simply put: even if governments can identify the MV, they face multiple constraints, not least of which is obtaining compliance from people above the median. Moreover, real-world democracies have numerous features – districts, primaries, electoral systems, supreme courts – that blur the mapping of votes into seats and the translation of preferences into outcomes. As any student of comparative politics knows, these features may matter more than does the level of democracy for many outcomes, including inequality.Footnote 61 Finally, the standard regime type/redistribution hypothesis hinges on strong assumptions about non-democracies – assumptions that are simply not consistent with the empirical record. In other words, the primary problem may not be data; it may be the expectation that a change in regime type will instantly alter the distribution of income, along the lines predicted by the median-voter model.