Implications
The increase in milk yield has been accompanied by declining fertility, increasing metabolic problems and reduced longevity. Selection for long-living cows is hampered by the generally low heritability of functional traits, but due to the large amount of genetic variance in most dairy cattle populations great opportunities exist for selection. Genome-wide association studies (GWAS) are a powerful tool for unraveling the genetic background of complex traits. The availability of high-density marker panels, consisting of almost 800 thousand polymorphic markers, together with data recording of many cows under selection, allow for the use of estimation methods which might contribute to remodel selection schemes to be adopted by breeding organizations in their goal to improve longevity and welfare.
Introduction
Longevity is one of the most important traits determining dairy cow profitability: improved longevity results in increased proportion of more productive mature cows and reduced cost of replacement (Vollema and Groen, Reference Vollema and Groen1996; Sewalem et al., Reference Sewalem, Miglior, Kistemaker, Sullivan and van Doormaal2008; Morek-Kopec and Zarnecki, Reference Morek-Kopec and Zarnecki2012). However, Oltenacu and Broom (Reference Oltenacu and Broom2010) called attention to the increase in milk yield in the last 40 years for its association with declining longevity, this association being endorsed by Abfalter et al. (Reference Abfalter, Brade and Distl2016) who compared breeding values of cows with exceptional longevity with their contemporary herdmates (61 988 German Holstein cows): exceptional cows had on average significantly lower breeding value for milk, fat and protein yield but significantly higher breeding value for somatic cell score and functional longevity.
On the other hand, Pinedo et al. (Reference Pinedo, Daniels, Shumaker and De Vries2014) underlined that the main cause of culling of Holstein cows is low production. The risk of being culled in first lactation for low milk yield was confirmed by a recent longevity study on 12 045 Polish Holstein cows in 1371 herds (Sawa and Bogucki, Reference Sawa and Bogucki2017); these authors pointed out that age at culling in high producing herds (>8000 kg) was less than 3.93 years for cows yielding less than 7000 kg in first lactation, while age at culling ranged from 5.33 to 5.46 years for cows yielding more than 7000 kg in first lactation.
De Vries et al. (Reference De Vries, Olson and Pinedo2010) reported that in the United States, during the years 2001–2006, 37% of cows in large herds were culled in their first parity and 83% within the first three parities.
As both direct longevity (actually observed length of productive life) and functional longevity (adjusted for production) are only known when cows have completed their life, survival analysis, which combines records of culled and living animals (Ducrocq, Reference Ducrocq2005) was proposed to obtain earlier indicators of longevity. It is known that some traits are significantly related to longevity and that conformation traits and fertility represent reliable predictors of survival (Vukasinovic et al., Reference Vukasinovic, Moll and Casanova2001). In recent years, direct and indirect selection for calving ease, fertility, longevity, feet and legs, and indirect health traits have become common, and there has been an increase in genetic trends of functional traits (Egger-Danner et al., Reference Egger-Danner, Cole, Pryce, Gengler, Heringstad, Bradley and Stock2015).
Selection for long-living cows enjoyed considerable scientific and commercial interest but few GWAS were yet performed on longevity: in a recent study, Nayeri et al. (Reference Nayeri, Sargolzaei, Abo-Ismail, Miller, Schenkel, Moore and Stothard2017) targeted daughter survival of the proof bulls from the North American Holstein population, while Zhang et al. (Reference Zhang, Guldbrandtsen, Thomasen, Lund and Sahana2016), used the longevity breeding value of progeny-tested bulls from three Nordic cattle breeds of Denmark, Finland and Sweden. Aim of the present work was therefore to use data on direct longevity from over 900 dairy cows to identify candidate genes for longevity, through a GWAS performed with the high-density single nucleotide polymorphisms (SNPs) panel.
Material and methods
Animals and traits
The used data set, composed by one thousand herdbook registered Holstein cows from 302 herds of the most specialized dairy farming area of Northern Italy (Lombardia), was chosen for performing a GWAS on direct longevity, so to have the highest variability in this trait. The cows were in fact chosen in the two tails of the distribution of a longevity index calculated by the Italian National Holstein Breeders Association (ANAFI). Details of this index, estimated by a sire-maternal grandsire model which includes milk yield, somatic cell scores and scores for udder, legs and feet, weighed by the genetic correlations between trait and longevity, are given in the Supplementary Table S1. However, selection in the Italian Holstein is performed based on a productive index (productivity, functional traits, morphology) and the longevity index is provided to the farmers merely to help decisions on the choice of the replacements.
All cows were genotyped with the Bovine High Density (777 K) BeadChip (Illumina Inc., San Diego, CA, USA). As the aim of the present work was to investigate the genomics of direct longevity, the following traits were defined and analyzed: (1) ‘days in production,’ expressing the days from first calving to culling, which is the most commonly used longevity measure (Zavadilova and Štípková, Reference Wu Xiaoping, Liu, Wang, Liu, Ding, Zhang, Zhang, Zhang, Qiao, Lund, Su and Sun2012); (2) ‘days in herd,’ that is, the days from birth to culling, which also takes into account growth and health of replacements (Heinrichs and Heinrichs, Reference Heinrichs and Heinrichs2010); (3) ‘calvings,’ that is, the number of calvings of a cow during lifespan, as true expression of productivity according to Vollema and Groen (Reference Vollema and Groen1996). All experimental females calved at least once, therefore in this study ‘direct longevity’ actually is ‘direct longevity conditional on first calving.’ The parameter ‘days in herd’ was then considered only for the cows which had already calved at least once.
Dates of birth, dates of all calvings during lifespan and culling date were collected and provided by the Italian Breeders Association (AIA), while genotypes were provided by Istituto Sperimentale Italiano Lazzaro Spallanzani (Rivolta d’Adda, Italy). DNA of all cows was sent for genotyping in a single batch; genotyped cows which had already been culled before the beginning of the present work were 946, belonging to 297 farms, born from 1999 to 2009, calving from 1 to 12 times in lifespan and had the following mean values for the traits to be analyzed: days in production: 1578.88±665.07; days in herd: 2413.80± 670.32; calvings: 3.77±1.65.
Genome-wide association
Pruning for Linkage Disequilibrium (LD) was performed as recommended by Price et al. (Reference Price, Weale, Patterson, Myers, Need, Shianna, Ge, Rotter, Torres, Taylor, Goldstein and Reich2008) who demonstrated that strong LD at a particular locus has a confounding effect on the global genome-wide variation and might reflect genetic variation only at that specific locus. Pruning was performed with PLINK (Purcell et al., Reference Purcell, Neale, Todd-Brown, Thomas, Ferreira, Bender, Maller, Sklar, de Bakker, Daly and Sham2007) using a variance genomic inflation factor =2, a window of 50 SNPs and shifting the windows by 5 SNPs at each run. Furthermore, markers with missing data (⩾10%) and minor allele frequency ⩽1% were also excluded using PLINK. As all cows were successfully genotyped at >80% of the SNP, no further filtering on the cows was applied.
As a consequence of the selective genotyping, half of the herds in the data set had only one genotyped cow, and several herds had only two genotyped cows. As it was not possible to consider herd and year of calving in the model, in order to take into account herd management the following two factors were considered: (1) average daily milk yield of each herd/year classified in the following five classes:<26 kg; 27 to 29 kg; 30 to 31 kg; 32 to 35 kg; >35 kg. (2) Average number of cows of each herd/year classified in the following four classes: <60; 61 to 130; 131 to 200; >200.
Genome-wide association analysis was performed with the GenABEL package in R (Aulchenko et al., Reference Aulchenko, Ripke, Isaacs and van Duijn2007) which performs a simple linear regression marker-phenotype analysis. Phenotypes were trait deviations from the overall mean values of the raw phenotypes: days in production, days in herd and calvings. The following model was used:
 $${\bf Y}_{i} {\equals}{\bf X}_{i} \beta _{i} {\plus}{\bf w}_{i} h_{i} {\plus}{\bf Z}_{i} a_{i} {\plus}{\bf e}_{i} $$
where Y
i
is the observation vector for the ith trait: days in production, days in herd and calvings; β
i
the vector of fixed effects for trait ith ( herd/year class of milk yield of each cow at time of her first calving: five levels; herd/year class of herd size of each cow at time of her first calving: four levels), X
i
the matrix of incidence of n × p order associating each observation (n) to the pertinent level of fixed effects (p); h
i
the effect size of marker,
w
i
a n by 1 vector of marker genotypes; a
i
the vector of random polygenic effects
 $$(a_{i} \,\sim\,N(0,G\sigma _{a}^{2} )$$
), where
 $$\sigma _{a}^{2} $$
is the estimated polygenic variance component, and
G
the n × n genomic relationship matrix, Z
i
the n x n matrix of incidence associating each animal;
e
i
a n by 1 vector of errors
e
i
~N(0,
I
 $$\sigma _{e}^{2} $$
) where
 $$\sigma _{a}^{2} $$
is the environmental variance component, and I the n×n identity matrix.
Regression was performed using the ‘egscore’ function of the GenABEL package for taking into account the population substructure likely induced by selective genotyping. The ‘egscore’ function is based on the EIGENSTRAT method (Price et al., Reference Price, Patterson, Plenge, Weinblatt, Shadick and Reich2006) and accounts for population stratification by adjusting for the principal components of variation of genomic kinship matrix, using as default the first ten components. The Genomic Control (GC) approach was also used to correct for the inflated null distribution of the ‘egscore’ test statistics, using the inflation factor λ which is the observed median value of the χ 2 statistic for the null markers divided by the expected median value of the χ 2 statistic (Hinrichs et al., Reference Hinrichs, Larkin and Suarez2009). P-values of each marker effect after GC are directly produced as results of the analysis by the ‘egscore’ function of the GenABEL package.
Finally, to control the increased type I error rising from the multiple hypotheses simultaneously tested in the above model, the P-values of the effects of each SNP corrected for GC were further corrected using the Proc Multtest of SAS software (SAS Institute Inc., 2007), by applying the false discovery rate (FDR) test (Benjamini and Hochberg, Reference Benjamini and Hochberg1995) which controls also the probability of erroneously rejecting even one of the true null hypotheses. Only the markers reaching a threshold level <0.05 after FDR test were taken into consideration as signals of longevity.
The variance associated to the significant SNPs was estimated using the formula V=2pqa 2 (Falconer and Mackay, Reference Falconer and Mackay1996), where p and q are the frequencies of the minor and major alleles and a is the allelic substitution effect. This value was then divided by the total genomic variance of the model provided by the GenABEL package.
To verify whether significant SNPs, located on the same chromosome, encompassed the same quantitative trait loci (QTL), measure of LD between them was calculated using the Proc Allele of SAS software (SAS Institute Inc., 2007).
As Hinrichs et al. (Reference Hinrichs, Larkin and Suarez2009) warned that the GC method has the disadvantage of unintentionally including true positives in the null set, so biasing association tests conservatively, the SNPs pruned out because of their LD with a significant one were retrieved from the PLINK file and reconsidered when falling in a region 500 Kbp upstream or downstream the significant one (Wu et al., Reference Wu Xiaoping, Liu, Wang, Liu, Ding, Zhang, Zhang, Zhang, Qiao, Lund, Su and Sun2013). This region was assumed to potentially encode a QTL for longevity.
Gene network analysis
The genomic regions encoding QTLs were explored and the annotated genes within these regions were retrieved from the NCBI database. Location and gene annotation were based on the UMD 3.1 genome assembly (https://www.ncbi.nlm.nih.gov/; annotation release 104).
Functional annotation tool of PANTHER classification System (Version10.0, Mi et al., Reference Mi, Muruganujan and Thomas2013) was used to inspect Gene Ontology (GO) terms mapping to protein-coding genes and assign the genes to the three main categories, Biological Process (BP), which includes broad biological goals; Molecular Function (MF), which describes the tasks performed by individual gene products and Cellular Component (CC), which involves subcellular structures, locations and macromolecular complexes.
Results
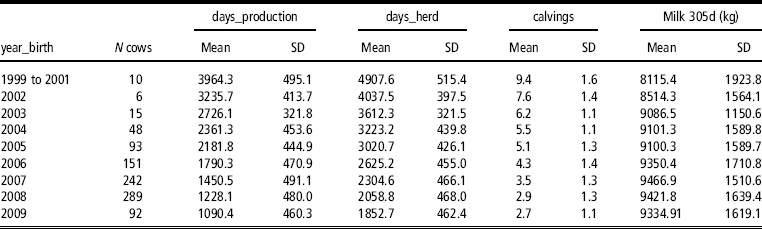
The first finding of this study was that phenotypic values for direct longevity of cows born from 1999 to 2009 registered a continuous decrease (Table 1), while 305 days milk yield in first lactation increased till 2007 then remained constant (Table 1). This suggests that, beyond first lactation yield, other events have contributed to culling.
Average parameters of true longevity and 305 days first lactation by year of birth of the analyzed cows

Genome-wide association analysis
The working data set after pruning for LD and quality control of the genotypes obtained with the SNP panel (777 962 SNPs) contained 946 samples and 135 992 SNPs.
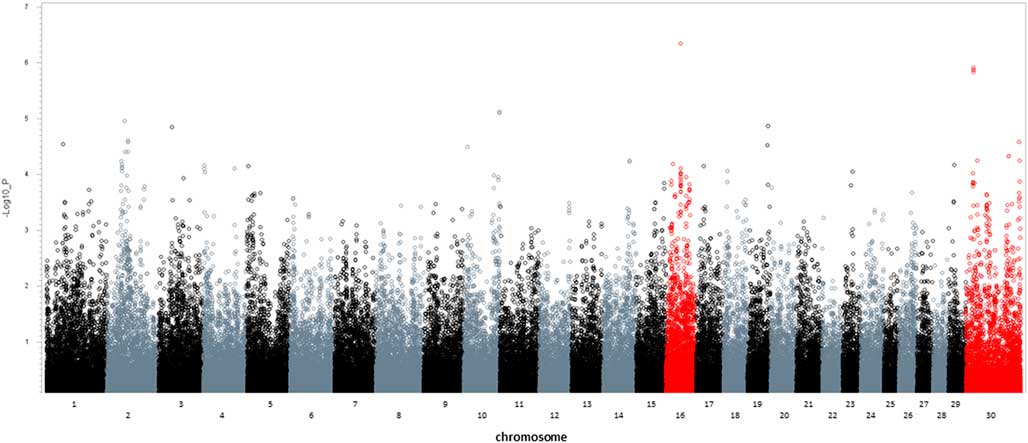
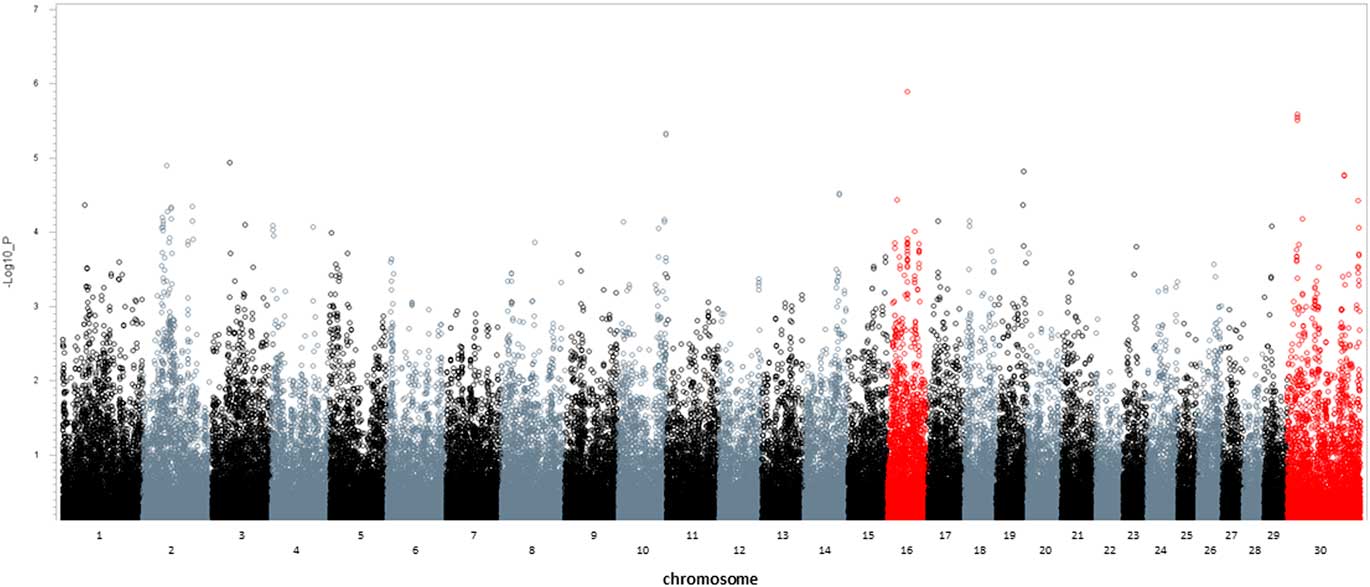
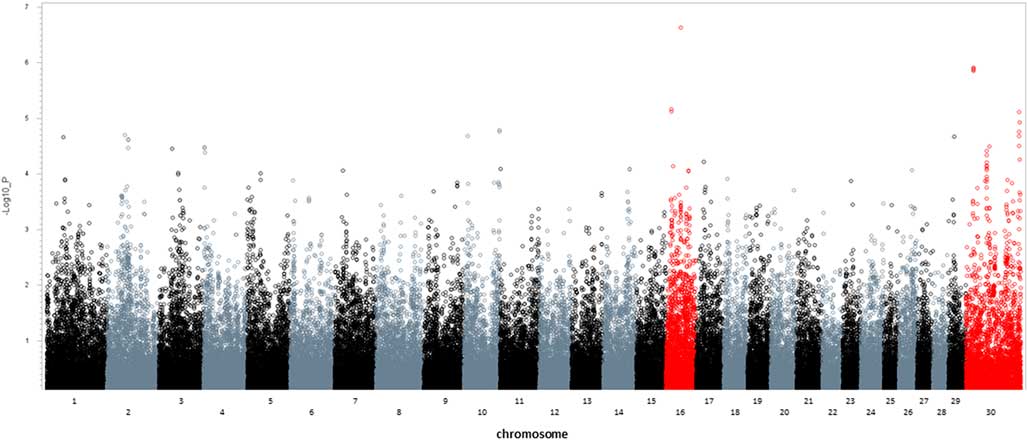
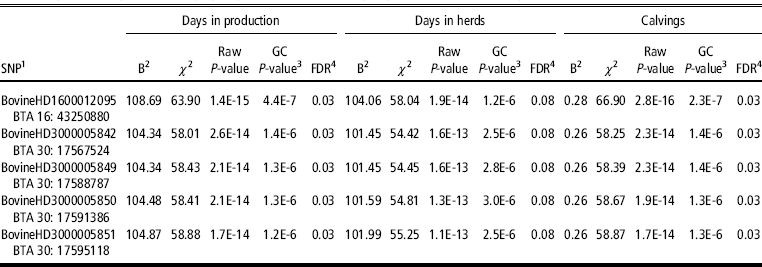
Genome-wide Manhattan plots displaying the GWAS results (−log10 of P-value of each SNP) with respect to their genomic position were shown in Figures 1 to 3 for the three analyzed traits. The five most significant SNPs – one on Bos taurus autosome (BTA) 16, four on BTA 30 – were the same for all three traits, though ranking differently, and were reported in Table 2. In the table, beyond the name of the SNP, the chromosome and the position on the assembly UMD v3.1, the allelic substitution effect with corresponding χ 2 values were reported for each of the three traits. Raw P-values, as well as P-values corrected for GC and for FDR were also reported in Table 2. The five SNPs showed significant effects (FDR-corrected P-value <0.05) on ‘days in production’ and ‘calvings’ while they only tended to significance (FDR-corrected P-value<0.08) for ‘days in herd,’ this likely reflecting the higher variability of the latter trait which is also affected by the age at first calving. Average allelic substitution effects (absolute values) for the significant SNPs were 105.34±1.88 and 102.49±1.11 days for ‘days in production’ and ‘days in herd,’ respectively; and 0.26±0.01 for ‘calvings.’ Minor allele frequency was 0.11 for SNPs on both BTA 16 and 30. Linkage disequilibrium between each pair of the four SNPs of chromosome 30 varied between 99.3% and 100%; moreover, since the effect of the four SNPs as well as the values of χ 2 were very similar (Table 2), they should be considered a unique QTL. Therefore, the variance explained by one marker of each QTL, calculated as in Falconer and Mackay (1996) and divided by the total genomic variance of the model, was 9.3% and 8.5% for days in production, 8.5% and 8.1% for days in herd and 10% and 8.7% for calvings, for BovineHD1600012095 and BovineHD3000005850, respectively.
Manhattan plot displaying the results of the genome wide association with respect to the genomic position for ‘days in production’, in the analyzed cows. On the Y axis, −log10 of raw P-value of each single nucleotide polymorphism (SNPs) are reported. Significant SNPs after genomic control and False Discovery Rate corrected have −log10 P-value >5.84. Alternate black and gray color were used to distinguish chromosomes 1 to 30. The chromosomes 16 and 30 in red color are those presenting significant SNPs.

Manhattan plot displaying the results of the genome wide association with respect to the genomic position for ‘days in herd’, in the analyzed cows. On the Y axis, −log10 of raw P-value of each single nucleotide polymorphism (SNPs) are reported. Significant SNPs after genomic control and False Discovery Rate corrected have −log10 P-value >5.84. Alternate black and gray color were used to distinguish chromosomes 1 to 30. The chromosomes 16 and 30 in red color are those presenting significant SNPs.
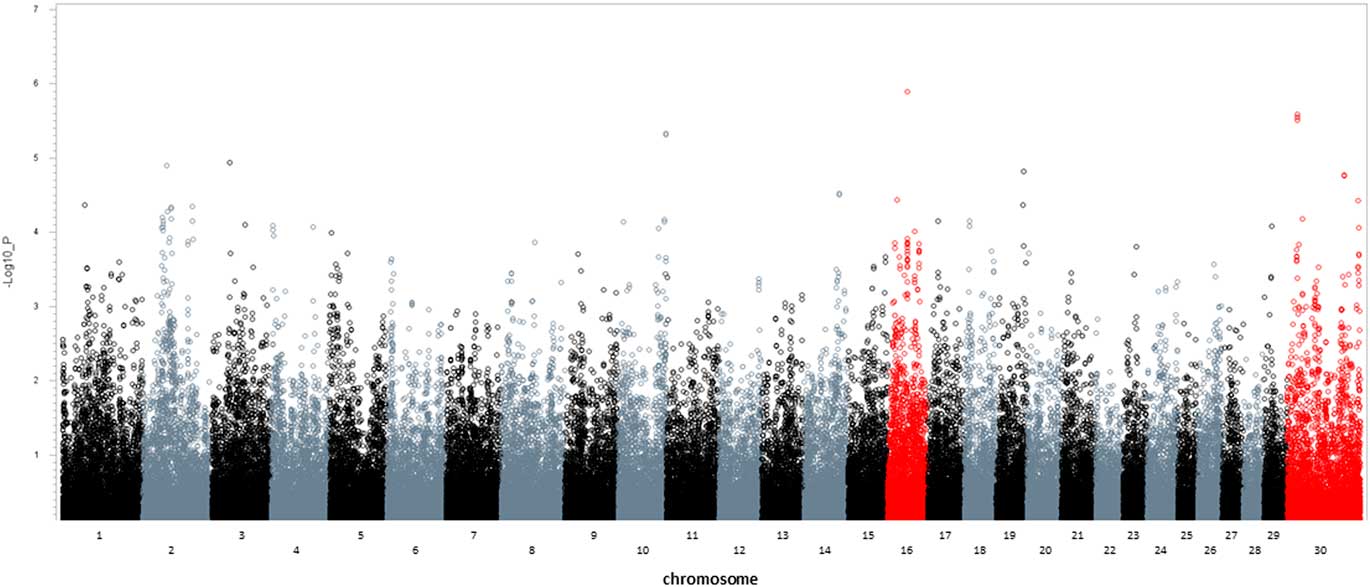
Manhattan plot displaying the results of the genome wide association with respect to the genomic position for ‘calvings’, in the analyzed cows. On the Y axis, −log10 of raw P-value of each single nucleotide polymorphism (SNPs) are reported. Significant SNPs after genomic control and False Discovery Rate corrected have −log10 P-value >5.84. Alternate black and gray color were used to distinguish chromosomes 1 to 30. The chromosomes 16 and 30 in red color are those presenting significant SNPs.

Significant single nucleotide polymorphisms for the three longevity traits, found in the analyzed cows

For each effect, Raw P-value, P-value corrected after genomic control, and False Discovery Rate (FDR) P-value are reported.
1 Single nucleotide polymorphism name (SNP), Bos taurus autosome (BTA) and position on BTA.
2 Allelic substitution effect.
3 P-value corrected after genomic control (GC).
4 P-value corrected for FDR.
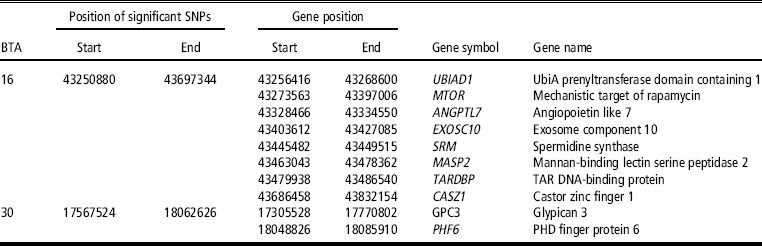
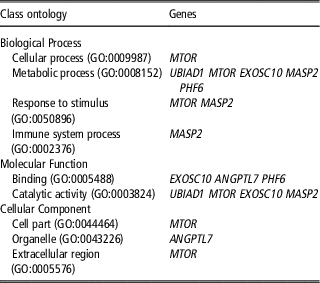
The pruned out SNPs located in a genomic region spanning 500 Kbp upstream or downstream the significant SNPs were reconsidered and were reported in the Supplementary Table S2, with indication of their position on the chromosome. In that Table, the five significant SNPs of Table 2 were evidenced in bold. The two genomic regions on BTA 16 and 30 encompassing the significant SNPs of Table 2, as well as the SNPs in LD with them of Table S2, encoded ten genes (Table 3) which were analyzed through PANTHER’s functional annotation tool to inspect GO terms mapping to protein-coding genes in Bos Taurus. Genes were classified in the GO categories BP, MF and CC (Table 4). Under the BP classification, the detected genes are involved in cellular processes, metabolic process, response to stimuli and immune system process. Under the MF classification (Table 4), the detected genes are involved in binding and catalytic activity; under the CC classification genes belonged to cell part, organelle and extra cellular region categories.
Summary of the most interesting candidate genes for longevity traits found in the analyzed cows

BTA=Bos taurus autosome; SNP=single nucleotide polymorphism name.
Gene Ontology (GO) classification of putative longevity genes found in the analyzed cows

Discussion
While GWAS for economic traits – fertility, mastitis susceptibility, production – in dairy cows has been enjoying considerable scientific interest in the past 10 years (Pryce et al., Reference Pryce, Bolormaa, Chamberlain, Bowman and Savin2010; Wu et al., Reference Wu Xiaoping, Liu, Wang, Liu, Ding, Zhang, Zhang, Zhang, Qiao, Lund, Su and Sun2013), only recently longevity has been targeted in GWAS, using either the 50 K SNP panel (Zhang et al., Reference Zhang, Guldbrandtsen, Thomasen, Lund and Sahana2016) or the 777 K SNP panel (Nayeri et al., Reference Nayeri, Sargolzaei, Abo-Ismail, Miller, Schenkel, Moore and Stothard2017). Both authors used longevity breeding values of progeny-tested bulls as phenotype for the GWAS, while the present study analyzed direct longevity data of cows from the two tails of the distribution of a composite index made of proxy traits for longevity.
As the use of the high-density marker panel (777 K) might increase the confounding effect of LD on the global genome-wide variation, also considering that the sampled cows were likely affected by sub-population stratification, pruning for LD was considered an appropriate solution. The working data set was made by 135 992 SNPs, and the percentage of pruned out SNPs was similar to other GWAS performed on humans (Tassi et al., Reference Francesca, Ghirotto, Mezzavilla, Vilaça, Santi and Barbujani2015), horses (Petersen et al., Reference Petersen, Mickelson, Cothran, Andersson, Axelsson, Bailey, Bannasch, Binns, Borges, Brama, da Câmara Machado, Distl, Felicetti, Fox-Clipsham, Graves, Guérin, Haase, Hasegawa, Hemmann, Hill, Leeb, Lindgren, Lohi, Lopes, McGivney, Mikko, Orr, Penedo, Piercy, Raekallio, Rieder, Røed, Silvestrelli, Swinburne, Tozaki, Vaudin, Wade and McCue2013) and pigs (Lopes et al., Reference Lopes, Silva, Harlizius, Duijvesteijin, Lopes, Guimaraes and Knol2013).
Each of the two QTLs on chromosomes 16 and 30, common to the three longevity traits, explains between 8% and 10% of the genomic variability of each trait; however, de los Campos et al. (Reference de los Campos, Sorensen and Gianola2015) warn against the use of marker-based regressions for inferences about population parameters such as the genomic variance; these authors showed that the genomic heritability and the trait heritability parameters are equal only when all causal variants are typed. Using both simulated and real data Yang et al. (Reference Yang, Benyamin, McEvoy, Gordon, Henders, Nyholt, Madden, Heath, Martin, Montgomery, Goddard and Visscher2010) have used whole-genome regression models with the purpose of obtaining inferences of genomic parameter that resemble more closely to those based on pedigrees, concluding that the different scenarios, involving distantly or more closely related individuals, as well as the LD between the markers and the QTLs highly affect the estimation. Speed et al. (Reference Speed, Hemani, Johnson and Balding2012) emphasized that contributions of markers to h 2 are overestimated from causal variants in regions of high LD and are underestimated in regions of low LD. By acknowledging such warnings, the five significant SNPs will be taken simply as an indication of two QTLs associated to longevity, and the genes encoded by the QTLs will be examined under the assumption that they might have a role in influencing longevity in cows.
Moreover, the five significant SNPs were in LD with a number of consecutive SNPs (Supplementary Table S2) which further support the existence of two QTLs affecting longevity on BTA 16 and 30.
The GO (Table 4) was helpful in ascribing the contribution of the 10 detected genes (Table 3) encoded by the QTLs to different functional pathways, so to elucidate the potential role they might play in longevity. Under the BP classification, the identified categories – cellular processes, metabolic process, response to stimuli, immune system process – were also the most represented categories within the highly scored target genes of up-regulated and down-regulated microRNAs in cows with metritis and normal uterus (Kasimanickam and Kastelic, Reference Kasimanickam and Kastelic2016), corroborating the connections between longevity, fertility and reproductive disorders. Moreover, metabolic process, and response to stimulus were also the most abundant sub-categories of the differentially expressed genes in response to heat stress in mammary epithelial cells of river buffalo (Kapila et al., Reference Kapila, Sharma, Kishore, Sodhi, Tripathi, Mohanty and Mukesh2016), suggesting further connections between stress, welfare and longevity.
Under the MF classification, the detected genes were involved in binding and catalytic activity, and these sub-categories were the most represented by the copy number variation (CNV) genes identified by Keel et al. (Reference Keel, Lindholm-Perry and Snelling2016) who explored exome sequence from 175 influential sires representing 10 breeds, with the aim to investigate evolutionary mechanisms of variation in the bovine genome. Interestingly, of the 110 CNV genes identified by these authors 35% were involved in binding and 23% in catalytic activity. Furthermore, CNVs are prone to be subjected to selective constraints (Keel et al., Reference Keel, Lindholm-Perry and Snelling2016), therefore genes influencing longevity are likely to be more susceptible to selective pressure and are presumably affected by the strong selection pressure on productive traits in dairy cows.
The detected genes under the CC classification belonged to cell part, organelle and extra cellular region categories, which were the most represented categories by the differentially expressed genes in ovaries of two local Chinese sheep breeds, characterized by high-fecundity and low-fecundity, respectively, suggesting a potential role of the genes of this category in influencing fertility (Chen et al., Reference Chen, Shen, Jia, Zhang, Wang and Zeng2014).
The significant marker of chromosome 16 identified in the present study – BovineHD1600012095 and the immediately downstream following marker – BovineHD1600012099 – located at position 43250880 and 43267903, respectively (Table 3), encompass the UBIAD1 gene (Table 3), which is a K2 vitamin biosynthetic enzyme. Performing a GWAS by the 50 K SNP Chip on fertility traits and reproductive disorders on Simmental cows in Austria, Rauter (Reference Rauter2014) identified a marker on chromosome 16: 43.33 Mbp significantly associated to stillbirth. Therefore, Rauter (Reference Rauter2014) suggested that UBIAD1 gene has a role in causing stillbirth. It is remarkable that mice lacking of this gene die as embryos (Nakagawa et al., Reference Nakagawa, Sawada, Hirota, Uchino, Suhara, Hasegawa, Amizuka, Okamoto, Tsugawa, Kamao, Funahashi and Okano2014). Moreover, the QTL of chromosome 16, consisting of eight consecutive SNPs in LD (Table 3), encompasses also the MTOR gene, implicated in the regulation of both the innate and adaptive immune responses (Soliman, Reference Soliman2013).
Conclusion
To our knowledge, this is the first GWAS performed on three indicators of direct longevity. GWAS was performed on a sample of Holstein cows showing the broadest variability in longevity; the high-density marker panel, 14 times more dense than the commonly used 50 K panel, was used and novel regions affecting longevity were observed. Some of the putative genes for longevity identified in this study have been already associated to fertility in cattle, while most of them play a role in basic cellular processes also described, through the GO analysis categories, in gene expression studies focusing on fertility, reproductive disorders, heat stress and welfare. The present study therefore, through genomic data, might suggest that culling is associated to reduced reproductive and productive efficiency and resilience of cows.
Acknowledgements
This study was supported by the research program ‘WELL4DOP’ funded by the Italian Ministry of Agriculture (D.M. 6126/7303/15 of 20 March 2015). Data were provided by the research program ‘RIPROWEL’ (Ministry of Agriculture DM 13576 of 24/05/2011). The authors thank Graziella Bongioni and Caterina Cambuli of the Istituto Sperimentale Italiano Lazzaro Spallanzani (ISILS, Rivolta d’Adda, Italy), and the Italian Holstein Breeders Association (ANAFI, Cremona, Italy) and the AIA (Roma, Italy) for providing genetic data and phenotypes.
Declaration of interest
The authors declare no conflicts of interest
Ethics statement
No new ethical approval was required since the data for this study were provided by the research program ‘RIPROWEL’ (Ministry of Agriculture DM 13576 of 24/05/2011).
Software and data repository resources
None of the data were deposited in an official repository.
Supplementary material
To view supplementary material for this article, please visit https://doi.org/10.1017/S1751731118003191