

1. Introduction
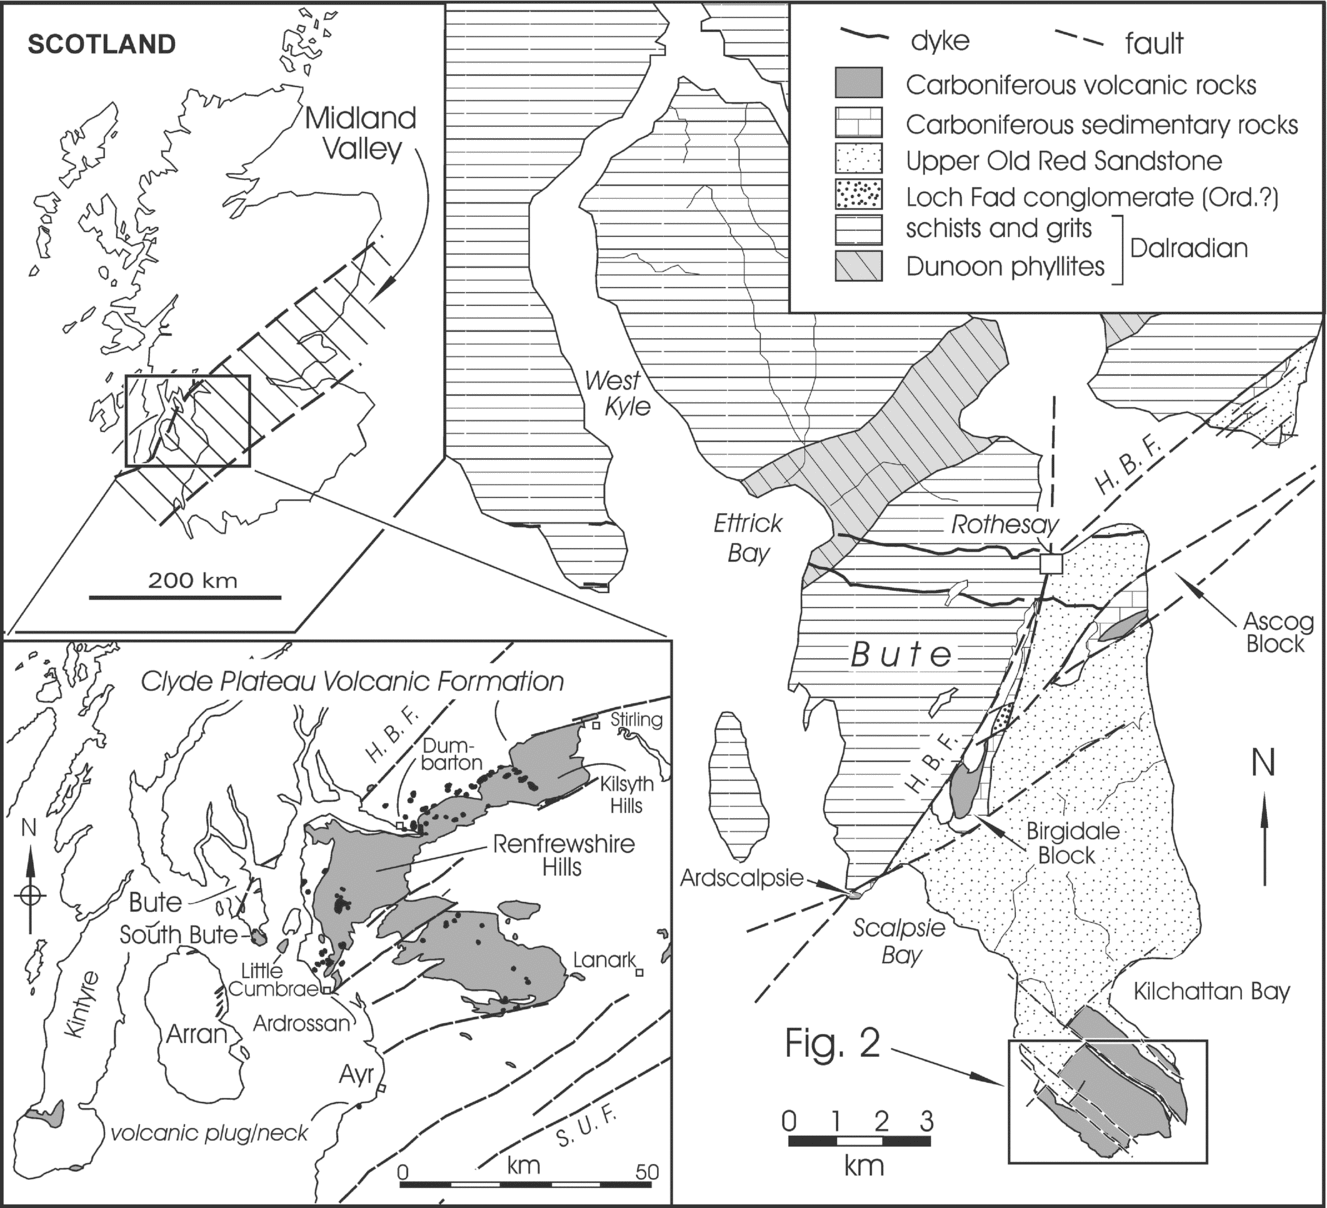
The rugged topography of south Bute (Fig. 1) is largely due to the presence of Carboniferous igneous rocks (MacCulloch, Reference MacCulloch1819, Reference MacCulloch1824; Boué, Reference Boué1820; Bryce, Reference Bryce1872; Geikie, Reference Geikie1897; Gunn et al. Reference Gunn, Geikie, Peach and Harker1903; Smellie, Reference Smellie1916; McCallien, Reference McCallien1938; Cameron & Stephenson, Reference Cameron and Stephenson1985; Hill & Buist, Reference Hill and Buist1994, Reference Hill and Buist2006). The island of Bute is transected by the Highland Boundary Fault, a major structure that separates the Highlands and Lowlands of Scotland. The nature of this structure is still being debated but some believe that two terranes have been juxtaposed along its length. For a summary of the history of ideas on the Highland Boundary Fault see Bluck (Reference Bluck and Trewin2002). There are still questions as to whether the fault continues to the SW beyond Bute (Tanner, Reference Tanner2008) and as to where it should be placed, for there is a special (Lower Palaeozoic) ophiolitic assemblage in many places along its length (the Highland Border Complex), and whereas some have included these rocks with the mainly Neoproterozoic Dalradian Supergroup, others have excluded them (Bluck, Reference Bluck and Trewin2002). The nature of the basement beneath the Midland Valley of Scotland is also problematic, for the surface rocks are mainly Upper Palaeozoic and older rocks (mainly Lower Palaeozoic) are exposed near its borders. The study of xenoliths caught up in deeply-rooted intrusions (Upton, Aspen & Chapman, Reference Upton, Aspen and Chapman1983; Downes et al. Reference Downes, Upton, Connolly, Beard and Biodinier2007) and a variety of geophysical investigations, summarized in Trewin & Rollin (Reference Trewin, Rollin and Trewin2002), suggest that the basement rocks under the Midland Valley of Scotland may differ from and dip under those of the neighbouring Highlands and Southern Uplands.
Sketch map showing the location of the Isle of Bute and the Carboniferous volcanic rocks at the south end of the island. Note that Carboniferous rocks are also preserved in two small fault blocks near the Highland Boundary Fault (H. B. F.), which separates metasedimentary rocks of the Dalradian Supergroup from mainly Devonian and Carboniferous rocks to the south. Note location of Figure 2. Inset (bottom left) shows the location and areal extent of the volcanic rocks of south Bute relative to the mainland exposures of the Clyde Plateau Volcanic Formation. See http://journals.cambridge.org/geo for a colour version of this figure.

Virtually all of the southern peninsula of Bute is underlain by volcanic rocks, which form a distal part of the Clyde Plateau Volcanic Formation (Paterson & Hall Reference Paterson and Hall1986; Caldwell & Young, in press), which is a voluminous outpouring of mainly mafic lavas that occupies large areas in the western Midland Valley of Scotland (Fig. 1, inset) and is up to 1000 m thick in the Renfrewshire Hills (Paterson, Hall & Stephenson, Reference Paterson, Hall and Stephenson1990; Read et al. Reference Read, Browne, Stephenson, Upton and Trewin2002, p. 263). In the Midland Valley of Scotland the lower part of the Lower Carboniferous (Mississippian Subsystem) is represented by the Inverclyde Group (Courceyan–Chadian) which, in ascending order, comprises the Kinneswood, Ballagan and Clyde Sandstone formations (Paterson & Hall, Reference Paterson and Hall1986; Browne et al. Reference Browne, Dean, Hall, McAdam, Monro and Chisholm1999; Waters et al. Reference Waters, Browne, Dean and Powell2007). The overlying Strathclyde Group includes thick and extensive rocks of the Clyde Plateau Volcanic Formation, for brevity hereafter called the Clyde Plateau Formation. Geochronological investigations by Monaghan & Parrish (Reference Monaghan and Parrish2006) confirmed the Viséan (Holkerian) age of these rocks. Near the Highland Boundary Fault in the central part of Bute, and in NE Arran, volcanic rocks are locally preserved in small fault-bounded basins where they are conformably underlain by fine siliciclastic rocks and thin coal seams of the Birgidale and Laggan Cottage Mudstone formations, which were included by Paterson & Hall (Reference Paterson and Hall1986) in the Strathclyde Group. In most other parts of the western Midland Valley of Scotland the Clyde Plateau Formation is the lowest unit of the Strathclyde Group. According to Paterson & Hall (Reference Paterson and Hall1986), accumulation of the Strathclyde Group was preceded, in many areas, by earth movements that resulted in a regional unconformity at its base. In south Bute volcanic rocks of the Clyde Plateau Formation lie on a sandstone-dominated succession that, from its nature and stratigraphic context, is considered to belong to the lower part of the Clyde Sandstone Formation. The contact is irregular and is considered to be disconformable. Recent geochronological studies of the Clyde Plateau Formation by Monaghan & Pringle (Reference Monaghan, Pringle, Wilson, Neumann, Davies, Timmerman, Heeremans and Larsen2004) and Monaghan & Parrish (Reference Monaghan and Parrish2006) in adjacent parts of the mainland have yielded ages between 334.7 ± 1.7 Ma and 335.2 ± 0.8 Ma, but there are no comparable geochronological data from Bute. The volcanic rocks are transitional to slightly alkaline and include a variety of basaltic rocks, mugearites, trachytes and trachyandesites (e.g. Francis, Reference Francis and Craig1965; P. L. Smedley, unpub. Ph.D. thesis, Univ. Edinburgh, 1986; Smedley, Reference Smedley1986; Reference Smedley1988a,Reference Smedleyb; Read et al. Reference Read, Browne, Stephenson, Upton and Trewin2002; Stephenson, Reference Stephenson and Monro1999; Stephenson et al. Reference Stephenson, Loughlin, Millward, Waters and Williamson2003; Upton et al. Reference Upton, Stephenson, Smedley, Wallis, Fitton, Wilson, Neumann, Davies, Timmerman, Heeremans and Larsen2004; Macdonald & Fettes, Reference MacDonald and Fettes2007). There is no detailed stratigraphical description of the volcanic succession, and the only modern chemical analyses were carried out by P. L. Smedley (unpub. Ph.D. thesis, Univ. Edinburgh, 1986) as part of a regional investigation. Analyses reported by P. L. Smedley (unpub. Ph.D. thesis, Univ. Edinburgh, 1986) and Smedley (Reference Smedley1986, Reference Smedley1988a,Reference Smedleyb) included some trace elements from the Bute lavas, but in this report, analyses of a more complete suite of trace elements, including rare earth elements (REEs), are presented. The purposes of this paper are to provide a description of the field character of the volcanic rocks in south Bute, to place them in a stratigraphic context of associated Carboniferous sedimentary rocks, and to present and interpret the results of geochemical analyses of a representative suite of samples. Petrographic aspects of these rocks and related igneous rock suites on the Cumbrae islands to the east have been described in considerable detail by Smellie (Reference Smellie1916) and Tyrrell (Reference Tyrrell1918), and the interested reader should consult these works and Caldwell & Young (in press).
2. Field description and stratigraphy
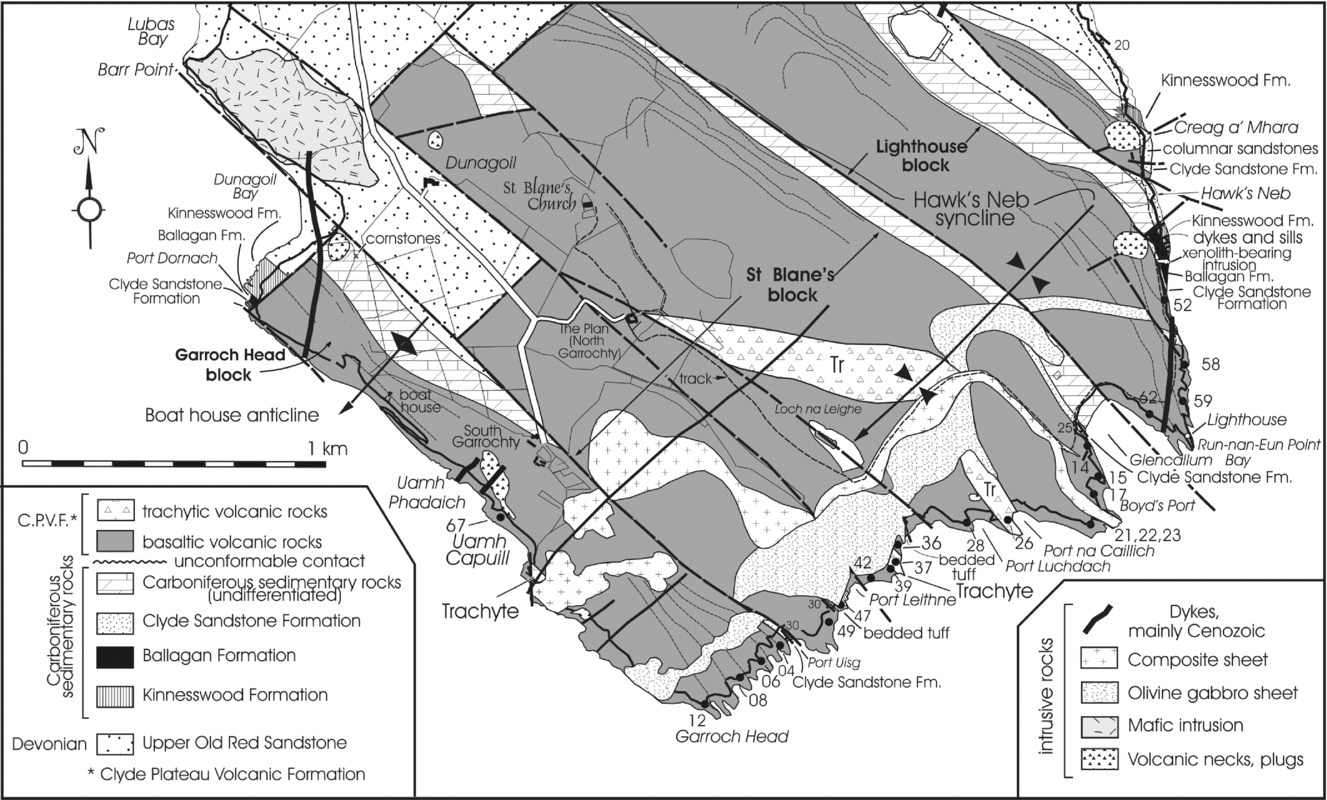
The area underlain by volcanic rocks in south Bute (Fig. 2) is about 5 km2. The igneous rocks are mainly preserved in small areas defined by a rectilinear fault array. The northwestern boundaries of the fault-blocks are interpreted as parts of a large NE-trending fault with consistent southeasterly downthrow. Younger, NW-trending faults downthrow to the NE but many have also undergone transcurrent movements, which are dominantly sinistral. The best-exposed portion of the large NE-trending fault is on the south side of Dunagoil Bay on the west side of south Bute (Fig. 2), where volcanic rocks are juxtaposed against sedimentary rocks of the Upper Old Red Sandstone (UORS) and the Carboniferous Inverclyde Group. Geological maps of this area (e.g. Smellie, Reference Smellie1916; British Geological Survey, 2008) show volcanic rocks overlying the UORS, especially in the northern portion of south Bute. The presence of Carboniferous rocks beneath the lavas at Dunagoil Bay and south of Hawk's Neb (Fig. 2) and along the NE margins of the major fault-blocks (Fig. 2) makes this interpretation unlikely. It is probable that all of the northern margins of the blocks are parts of a single fault that has subsequently been displaced by NW-trending fractures. Within these fault-blocks the structure is relatively simple with rocks dipping between c. 20 and 30° to the SW. There is, however, evidence of a gentle SW-plunging syncline, near the south coast of the island (Hawk's Neb syncline, Fig. 2). This structure is apparent from the attitude of lava flows in that area. A similarly oriented open anticline is also recognized just south of Dunagoil Bay: the Boat House anticline. Although there are numerous minor faults in the area (Fig. 2), the volcanic rocks are conveniently considered in terms of three fault-blocks as follows: (1) The Lighthouse block, which is best exposed on the SE coast of the island, NW of the small (now disused) lighthouse on the NE side of Glencallum Bay (Fig. 2); (2) The St Blane's block, which is the largest and is named for an historic ruined church (Fig. 2); (3) The Garroch Head block, at the SW side of the southern promontory of Bute, which is named after the southernmost point of the island.
Geological map of part of south Bute. Volcanic rocks mainly occur in three areas bounded by NW–SE faults (the Lighthouse, St Blane's and Garroch Head blocks). Throughout most of the map area dips are consistently to the SW at about 20–30°. Approximate locations of samples analysed for this study are shown along the south coast. See also stratigraphic columns shown in Figures 3 and 4. See http://journals.cambridge.org/geo for a colour version of this figure.

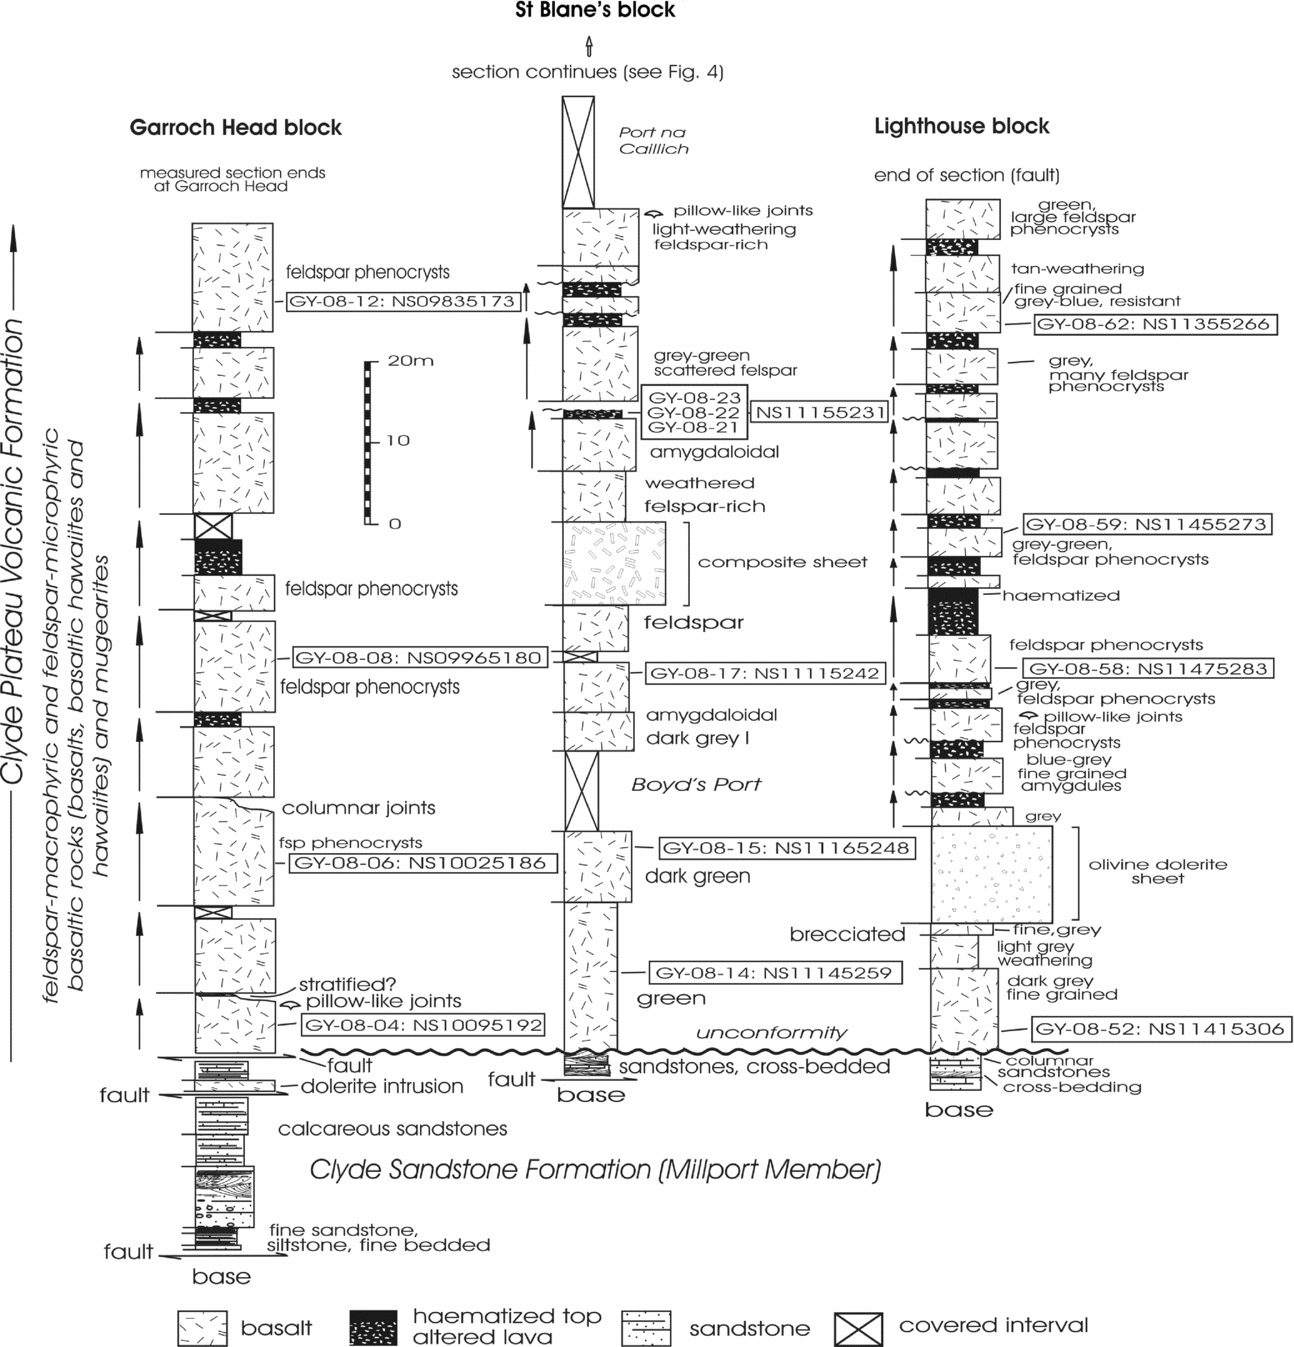
Measured stratigraphic sections from the well-exposed southeastern margins of these fault-bounded blocks are shown in Figures 3 and 4.
Measured stratigraphic sections showing the succession of lavas present in the eastern (Lighthouse) and western (Garroch Head) blocks, together with the lower division in the medial St Blane's block. In all three fault-blocks sedimentary rocks beneath the volcanic succession (Clyde Plateau Volcanic Formation) belong to the lower part of the Clyde Sandstone Formation. The contact between the lavas and underlying sedimentary rocks is considered to be a disconformity. The lavas in all three fault-blocks are dominantly feldspar-macro- and microphyric basaltic rocks (basalts, basaltic hawaiites and hawaiites) and mugearites. Sample locations and National Grid numbers are shown. Arrows at the left side of the columns indicate lavas with brecciated, pyroclastic or weathered tops. Note intrusive sheets in the St Blane's and Lighthouse blocks (see Fig. 2).

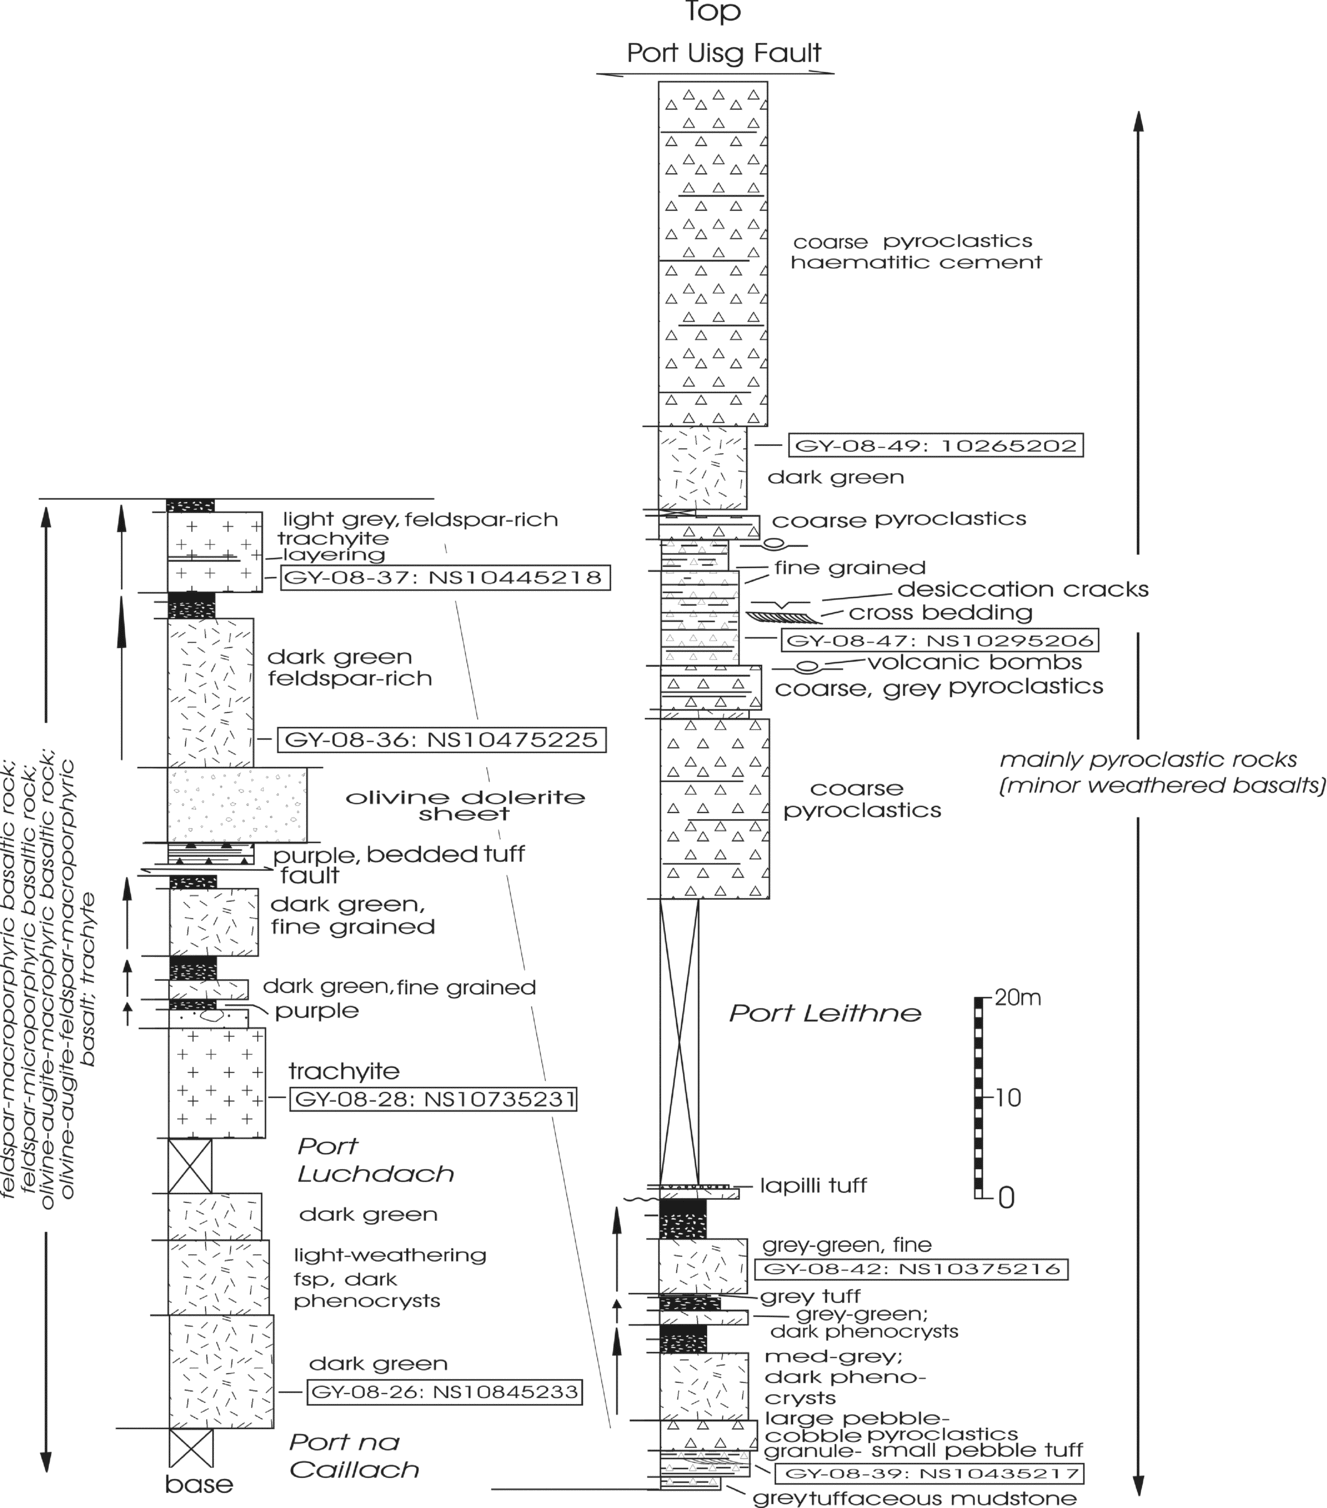
Measured section through the middle and upper divisions of the St Blane's block. These rocks are not represented in the other two fault-blocks. They include both more felsic lavas (trachytes-trachyandesites) and, in addition to the feldspar-macro- and microphyric basaltic rocks like those of the lower division, contain more mafic basalt varieties such as olivine-augite- and olivine-augite-feldspar-macrophyric varieties. Locations of analysed samples and National Grid numbers are shown. Coarse and fine pyroclastic rocks are common in the middle and upper parts of the St Blane's block. Pyroclastic rocks – small triangles; trachytes – crosses. Other symbols as those in Figure 3.

2.a. The Lighthouse block
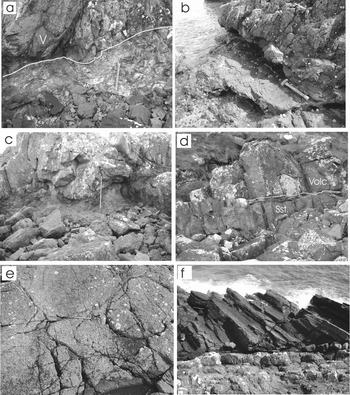
Stratigraphic relationships with underlying sedimentary rocks are most clearly displayed in this block. On its northern margin, south of Hawk's Neb (Fig. 2), there is continuous exposure from red sandstones of the UORS into a cornstone (caliche)-bearing succession of sandstones and siltstones assigned to the Kinnesswood Formation. These rocks and an overlying grey mudstone-dominated succession (Ballagan Formation) are cut by many dolerite intrusions. The recessive mudstones and thin light-grey limestones (‘cementstones’ in the older literature) of the Ballagan Formation are overlain by a thin succession of white, grey and buff cross-bedded sandstones, red and purple mudstones, and minor carbonate clast-bearing breccias, assigned to the basal part of the Clyde Sandstone Formation. The contact between the first lava flow and these sandstones is abrupt and irregular (Fig. 5a). Apart from the excellent exposures on the south side of Dunagoil Bay, this is the only locality where there is a continuous and well-exposed succession of sedimentary rocks from the UORS to the base of the lavas in south Bute.
(a) Disconformable contact between basal lava flow of the Clyde Plateau Volcanic Formation (V) and brecciated siltstones, mudstones and sandstones of the Clyde Sandstone Formation at the east end of the Lighthouse block, near sample 52 (Fig. 2). Hammer in all pictures is about 40 cm long. (b) Contact between hard, grey, blocky lava (above hammer) and purple, recessive rock forming the upper part of an alteration profile developed on the underlying lava; St Blane's block, east of Port Leithne, near sample 42 (Fig. 2). (c) Irregular contact between resistant lava flow and underlying light-grey-weathering alteration zone developed on a flow near the base of the lava succession in the Lighthouse block. The altered material was probably not fully consolidated at the time of emplacement of the succeeding flow. Measuring staff is 1.5 m long. Photo was taken near sample 52 (Fig. 2). (d) Contact (white line) between basal basaltic lava flow (Volc.) of the St Blane's block and underlying light-grey, calcareous, parallel- and cross-bedded sandstones (Sst.) of the Clyde Sandstone Formation on the west side of Glencallum Bay near sample 15 (Fig. 2). Immediately below the contact there are a few cm of pyrite-rich mudstone. (e) Lava with pillow-like joints, south of Port Dornach at the NW tip of the Garroch Head block. Pen is 15 cm long. (f) Finely bedded tuffs (dark) cut by crinanite sheet (lower part of photograph), west of Port Leithne, near sample 47 (Fig. 2). Stratigraphic thickness of tuffs in the photograph is about 3 m.

The thickness of the succession of lavas in the Lighthouse block was determined on the well-exposed coastal section between Hawk's Neb and the NE side of Glencallum Bay (Fig. 2). According to the field classification of Smellie (Reference Smellie1916) and subsequent workers, most of these lavas are feldsparphyric Markle and Jedburgh basalts (now known as feldspar-macrophyric and feldspar-microphyric basaltic rocks, including basalts, basaltic hawaiites and hawaiites), together with mugearites. Measurement of this and other sections was accomplished using a 1.5 m long measuring staff. A total thickness of 95.6 m was obtained, comprising 15 flows. Marine erosion along the coast helps to delineate separate flows in a way that cannot be duplicated inland, where only the grosser aspects of the volcanic stratigraphy are apparent and much of the succession is obscured by erosional talus and vegetation. The lower portion of each flow is resistant and tends to form a small headland, whereas the brecciated or pyroclastic tops of many flows are more recessive and many display evidence of alteration (Fig. 5b). Some contacts between flows and the underlying altered material are highly irregular (Fig. 5c). If the massive portion and the brecciated and altered top are considered as parts of a single flow, the average thickness of flows in the Lighthouse block is 6.6 m.
2.b. The St Blane's block
This large block contains the thickest and most complete succession of volcanic rocks in south Bute. St Blane's block is bounded on the NE by the Glencallum Bay fault and on the SW by the Port Uisg fault (Fig. 2). The succession comprises ~ 340 m of volcanic rocks, as measured along the south coast of the promontory. Although exposure is excellent, the succession is interrupted in places by a southeasterly dipping sheet of olivine dolerite (crinanite) and a similarly disposed but younger composite sheet (Smellie, Reference Smellie1916). The block is also cut by NW-trending faults (of unknown throw) at Port Leithne and at Loch na Leighe (Fig. 2), so that there may be some undetected repetition of stratigraphy. The basal contact is exposed on the west side of Glencallum Bay where a thin succession of light-grey and buff cross-bedded calcareous sandstones, minor siltstones and carbonate clast-bearing granule and small pebble conglomerates is exposed. The contact between the lavas and sedimentary rocks is slightly irregular, and there is evidence of pyritization of the topmost sandstones (Fig. 5d). Columnar joints (Young, Reference Young2008a) are developed in some sandstones near the contact with the lowest lava. By comparison with the thicker, more complete sedimentary succession exposed below the lavas of the Lighthouse block (about 700 m to the NE), these sandstones are assigned to the Clyde Sandstone Formation. In this block the volcanic rocks are considered to form three divisions.
The lavas making up the lower division resemble those of the Lighthouse block and comprise feldspar-macrophyric and feldspar-microphyric basaltic rocks, together with mugearites (British Geological Survey, 2008). As in the Lighthouse block, the tops of several flows show evidence of alteration, with development of distinctive red, purple and grey recessive zones. In some, there are highly irregular contacts between the altered flow top and succeeding lava flow. Most lava flows are massive, but some display structures that resemble pillows (Fig. 3, near the top of central column; Fig. 5e), but they may be cooling fractures and joints. The top of the lower division is taken at the first exposures on the SW side of Port na Caillach (Figs 2, 3), which mark the beginning of a transition into more highly differentiated lavas and abundant pyroclastic deposits. The lower division is about 120 m thick and comprises 11 measured flows. There are, however, three small gaps in the section. This part of the succession is presumably equivalent to that exposed in the Lighthouse block, but pyroclastic and altered tops are less obvious (Fig. 3).
The middle division (Fig 4, left column) is about 90 m thick. It contains feldspar-macrophyric and feldspar-microphyric basaltic rocks, together with mugearites, but is differentiated by the presence of light-grey-weathering, grey- and tan-coloured flows of trachyte, together with dark-green lavas of more mafic appearance than most of those in the underlying division. The dark-green varieties are olivine-augite-macrophyric and olivine-augite-feldspar-macrophyric basaltic rocks (Craiglockhart and Dunsapie basalts of the old field classification). Several flows display reddened, weathered tops (Fig. 4). In the upper part of the second division (Fig. 4, left column), there is a thin unit of finely stratified, purple-weathering, grey tuff. Similar rocks are present higher in the succession (Fig. 5f) but these outcrops mark their lowest occurrence. The tuffaceous rocks are faulted against the large olivine-dolerite sheet that traverses the south end of south Bute, so that their exact stratigraphic position is uncertain.
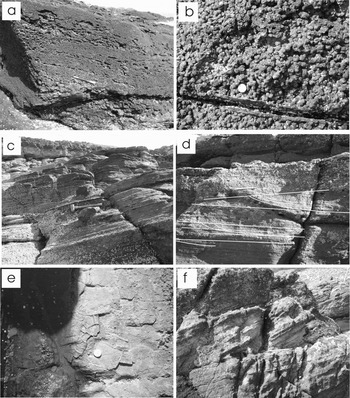
The uppermost part of the St Blane's block consists mainly of pyroclastic rocks, ranging from purple- and grey-weathering grey tuffaceous mudstones to coarse fragmental volcanic rocks. There are a few thin lava flows near the base (Fig. 4, right column). On the NE side of Port Leithne, there is a bed made up of small dark sub-spherical bodies (Fig. 6a, b) comprised of ash aggregates, including accretionary lapilli and ash pellets (Fisher & Schmincke, Reference Fisher and Schmincke1984; Brown et al. Reference Brown, Branney, Maher and Davila-Harriss2010). Such lapilli are believed to form by accretion of small volcanic particles about a nucleus during transportation in an ash plume or cloud following violent eruptions. An alternative origin by accretion during emplacement of an ignimbritic flow was suggested by Brown et al. (Reference Brown, Branney, Maher and Davila-Harriss2010) for similar lapilli on SE Tenerife in the Canary Islands. Scattered accretionary lapilli are also present on the west coast of south Bute, near the top of the volcanic succession in the Garroch Head block. A 17 m thick succession of well-bedded, purple-weathering, light-grey tuffs is exposed on the foreshore just west of Port Leithne (Fig. 2). Most of the tuffaceous succession is cut by a large crinanite sheet (Fig. 5f), but near the top, the intrusive body changes direction to become sub-parallel to the layering of the host rocks. Most of the fine-grained (ash- to lapilli-sized) tuffs exhibit parallel bedding (Fig. 6c), and near the base and top there are some outsize volcanic clasts (up to 20 cm across) that depress underlying layers (Fig. 6c), suggesting that they were emplaced as ejecta.
(a) Stratified lapilli tuff in the upper part of the volcanic sequence of the St Blane's block just east of Port Uisg, near sample 49 (Fig. 2). Pen is ~ 15 cm long. (b) Close up of part of the ash aggregate tuff shown in (a). Coin is about 2 cm in diameter. (c) Finely stratified tuffs in the upper division of the St Blane's block, near sample 47 (Fig. 2). Note large volcanic clasts (bombs?) below and above hammer. Hammer is 40 cm long. (d) Cross-bedding (highlighted by white lines) in finely bedded tuffs west of Port Leithne. Pen is 15 cm long. (e) Desiccation cracks (near coin) in finely bedded tuffs in the upper division of the St Blane's block, west of Port Leithne in the vicinity of sample 47 (Fig. 2). Coin is about 2 cm across. (f) Cross-bedded light-grey calcareous sandstones (lower part of the Clyde Sandstone Formation) beneath lavas of the Garroch Head block at Port Uisg. Pencil is about 16 cm long.

Some beds are graded, and flame structures are locally developed between fine and overlying coarse material. Most of the tuffs are parallel-bedded, but there are some cross-beds up to 25 cm in thickness (Fig. 6d). Most exposures of cross-beds are two dimensional so that precise measurement is difficult, but their general orientations suggest transportation from the east. At one place the tuffs display desiccation cracks (Fig. 6e), indicating subaerial exposure. The exact mechanism of emplacement remains unknown but most of the bedded tuffs were probably deposited as fallout deposits from explosive volcanism. Some may be base surge deposits (Fisher & Schmincke, Reference Fisher and Schmincke1984), and cross-bedding indicates the activity of traction currents. The youngest rocks exposed at the SW end of the St Blane's block are coarse massive pyroclastic deposits, some of which have a red, haematitic cement.
2.c. The Garroch Head block
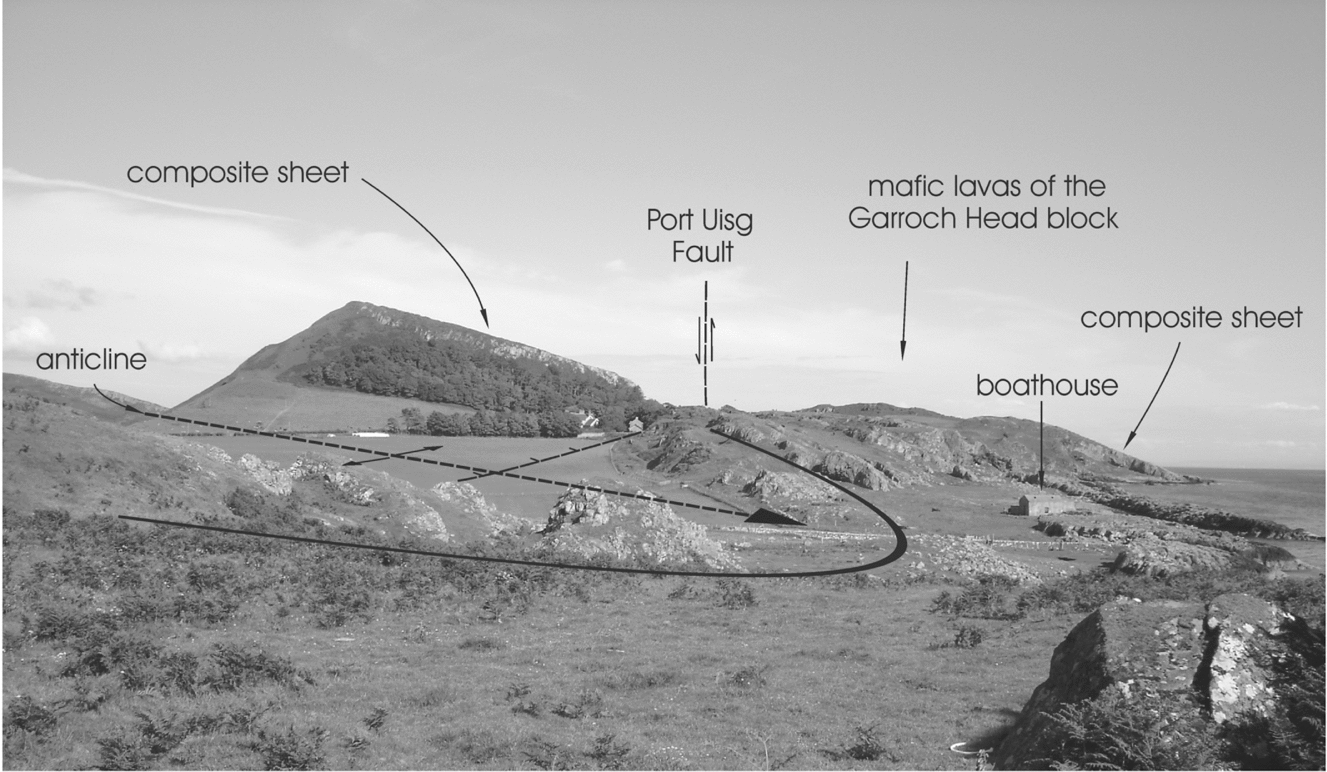
At Port Uisg, sedimentary rocks are exposed beneath the lavas on the SW side of a NW-trending fault, so that the westerly block must have undergone significant uplift relative to the thick lava succession of the St Blane's block (Figs 2, 7). Assuming that the fault is vertical, and the thickness estimate of the volcanic succession in the St Blane's block is accurate, the throw on the Port Uisg Fault must be c. 390 m. The sedimentary rocks comprise 27 m of medium- to coarse-grained, calcareous, light-grey, parallel- and cross-bedded sandstones, quartz-pebble conglomerates and minor grey, fine-grained sandstones and siltstones (Fig. 6f). Fine sedimentary breccias with clasts of micritic carbonate are present. These rocks are similar to those at the base of the Lighthouse block and, although their stratigraphic affinity cannot be confirmed in this area by identifying underlying formations, they resemble rocks locally assigned to the lower part of the Clyde Sandstone Formation. The contact is complicated by small-scale faults and minor intrusions (Fig. 3). A measured section in the Garroch Head block comprises nine mafic lava flows similar in composition to those of the Lighthouse block, which, together with subordinate pyroclastic rocks, have a total thickness of about 126 m. The flows are mainly massive but, as in the Lighthouse block and in the lower division of the St Blane's block, some have pyroclastic, brecciated and altered tops. The basal flow has structures that resemble pillows, and the third flow displays columnar jointing (Fig. 3).
View, looking SE from near the south shore of Dunagoil Bay, showing volcanic rocks of the Garroch Head block. A composite sheet forms the high hill (St Blane's Hill) on the horizon at left, where it intrudes volcanic rocks of the St Blane's block and reappears across the Port Uisg Fault near the coast (see Fig. 2 for map). The Boat House anticline is also highlighted.

2.d. Summary of stratigraphy
The volcanic rocks in the Lighthouse and Garroch Head blocks are considered to be equivalent to the lower division of the St Blane's block. They include feldspar-macrophyric and feldspar-microphyric basaltic rocks, together with mugearites and are considered to be correlative with the Carboniferous lavas of Little Cumbrae, a few kilometres to the east, where some 240 m of similar lavas are preserved in about ten mafic flows (Caldwell, Reference Caldwell and Campbell1975; Caldwell & Young, in press). Stratigraphically higher, more differentiated volcanic units, including trachytes, are present in south Bute in the middle division of the St Blane's block. Abundant pyroclastic rocks are restricted to the upper part of the Carboniferous volcanic succession of this area. It has been reasoned (Caldwell & Young, in press) that the volcanic rocks of Little Cumbrae and those comprising the lower division of the south Bute succession are equivalent to the lower Strathgryfe Member of the Clyde Plateau Formation in the Renfrewshire–Kilbirnie Hills area of the mainland to the east (Fig. 1, inset).
Three completely separate occurrences of Carboniferous volcanic rocks are preserved just SE of the Highland Boundary Fault zone, which transects the central part of Bute (Fig. 1). In the Ascog Block, there is about 60 m of lavas, whereas in the Ambrisbeg Block, near the Highland Boundary Fault, the preserved volcanic rocks are estimated to be about 21 m thick. The volcanic rocks have a conformable (interbedded) relationship with poorly exposed sedimentary rocks of the Birgidale Formation, which is younger than the Carboniferous sedimentary rocks of south Bute (Paterson & Hall, Reference Paterson and Hall1986; Young, Reference Young2008b). An unconformable relationship between the Birgidale Formation and the underlying Clyde Sandstone was tentatively inferred by Paterson & Hall (Reference Paterson and Hall1986) and the former was included in the Strathclyde Group, together with the Clyde Plateau Formation. Thus the relationship between the Clyde Plateau Formation and underlying sedimentary rocks is different in south Bute from that in the two down-faulted blocks to the north. It is possible that the volcanic rocks of the two areas were never physically joined, but if volcanism were initiated at the same time in both areas, then there must have been a considerable hiatus in the southern area, representing most of the time during which the Clyde Sandstone and Birgidale formations were deposited.
At Ardscalpsie, on the north shore of Scalpsie Bay (Fig. 1), mafic volcanic rocks are associated with cornstone-bearing sandstones that are probably Carboniferous, but because of poor exposure and structural complexities in the vicinity of the Highland Boundary Fault it is difficult to ascertain their precise relationships or identity.
3. Geochemistry
To investigate the nature and genesis of the volcanic rocks of south Bute, a suite of samples was collected for chemical analysis. The stratigraphic positions of the analysed samples are shown in Figures 3 and 4. These logs were produced from excellent shoreline exposures at the south end of the promontory of south Bute. The approximate geographical locations of the analysed samples are shown on Figure 2 and National Grid Reference co-ordinate numbers are listed with the sample numbers in Figures 3 and 4. A total of 23 samples was analysed for major and trace elements (including REEs). The samples were mainly taken from lavas, but two tuff samples were also analysed and three samples were taken to investigate the nature of alteration zones (‘boles’) developed in the upper portion of some lava flows. Samples were prepared for analysis by removing weathered surfaces, crushing with mild steel (to minimize contamination), pulverizing and splitting. Analyses were carried out at Activation Laboratories in Ancaster, Ontario. Both major and trace elements were determined by lithium metaborate/tetraborate fusion ICP-MS techniques. Normalizing factors for REE plots are from Masuda, Nakamura & Tanaka (Reference Masuda, Nakamura and Tanaka1973) and Taylor & McLennan (Reference Taylor and McLennan1985). Accuracy and precision of the analyses were determined by analysing standards and duplicates.
3.a. Major elements
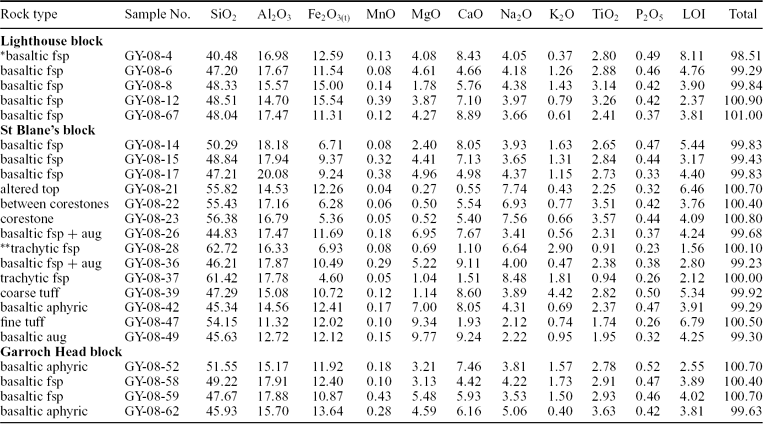
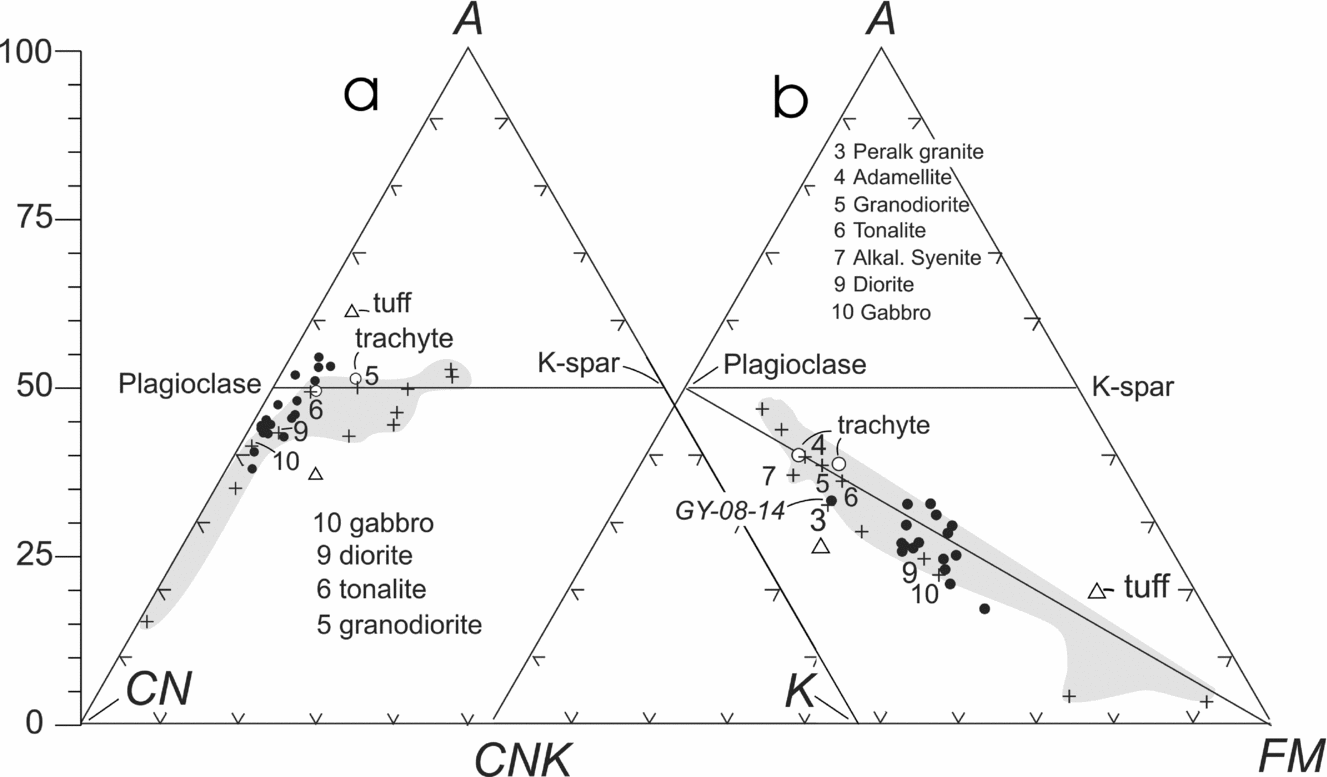
Results of major element analyses are listed in Table 1. The A–CN–K plot (Nesbitt & Young, Reference Nesbitt and Young1984, Reference Nesbitt and Young1989) was introduced as a means of quantifying the degree of weathering to which rocks have been subjected. It can be illustrated in a triangular plot showing molar proportions of Al2O3 (A), CaO* + Na2O (CN) and K2O (K) (Fig. 8a). Details of the technique are given in Nesbitt & Young (Reference Nesbitt and Young1984) and Fedo, Nesbitt & Young (Reference Fedo, Nesbitt and Young1995). Most fresh (feldspar-rich) igneous rocks plot close to the plagioclase–K-spar join on the diagram. Because they have a high proportion of Ca and Na, mafic rocks plot closer to the CN apex, whereas more felsic rocks (richer in K) plot close to the feldspar join and to the right of the A–CN join. This is illustrated by the shaded area and crosses on Figure 8a, which show the distribution of average values from fresh igneous rocks (after Nockolds, Reference Nockolds1954). The analysed samples from south Bute mostly plot in a small area close to Nockolds’ average values for fresh gabbro, diorite and tonalite, indicating their general affinity and the fact that they have not undergone significant weathering or metasomatic alteration. The two tuff samples, which fall outwith the main group, have probably been subjected to alteration processes. Two felsic lava samples fall close to the feldspar join, and one has a composition close to that of Nockolds’ average granodiorite. High values of CaO and LOI in samples GY-08–04 and -14 confirm that they are calcite-rich (also shown by acid reaction).
Major element composition (wt %) of samples from the Clyde Plateau Volcanic Formation, south Bute
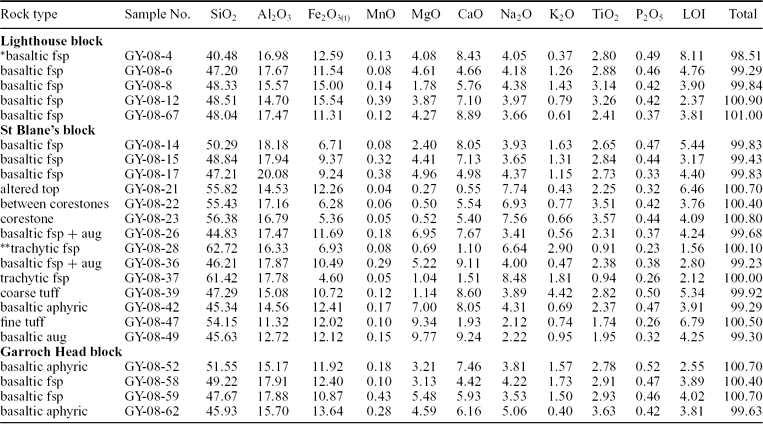
*basaltic may include basalt, basaltic hawaiite and hawaiite; fsp – feldspar phenocrysts; aug – augite phenocrysts.
**trachytic may include trachyte and trachyandesite.
(a) A–CN–K diagram (after Nesbitt & Young, Reference Nesbitt and Young1984; Reference Nesbitt and Young1989) showing the distribution of analysed samples of volcanic rocks from south Bute. Average igneous rocks are represented by crosses and shaded area. Most of the samples of volcanic rocks from south Bute plot near the A–CN join, typical of mafic igneous rocks. Most also fall below the plagioclase–K-spar join, indicating that they are unaltered. Note the tuffs and two trachytic samples. (b) A–CNK–FM plot (Nesbitt & Young, Reference Nesbitt and Young1984; Reference Nesbitt and Young1989). Symbols and shading are as in (a). Note bimodal distribution of the analysed volcanic rocks, with trachytes having a lower Fe + Mg content than the basaltic rocks. See text for discussion.

Figure 8b shows molar proportions of Al2O3 (A), CaO* + Na2O + K2O (CNK) and FeO(t) + MgO (FM) for the analysed samples. This plot was named the ‘mafics triangle’ by Nesbitt & Young (Reference Nesbitt and Young1989). The shaded area again shows the distribution of average igneous rock compositions (from Nockolds, Reference Nockolds1954). Note that most of the fresh igneous rocks plot close to the plagioclase–K-spar join. During weathering, compositions tend to be displaced upwards from the plagioclase–FM join, but most of the analysed samples are relatively fresh. This plot provides a clearer differentiation of the felsic lava samples. Again the tuffs plot separately. One has high CaO and LOI values and the other high MgO and LOI values, suggesting that they both contain carbonate minerals, as confirmed by acid reaction.
3.b. Classification
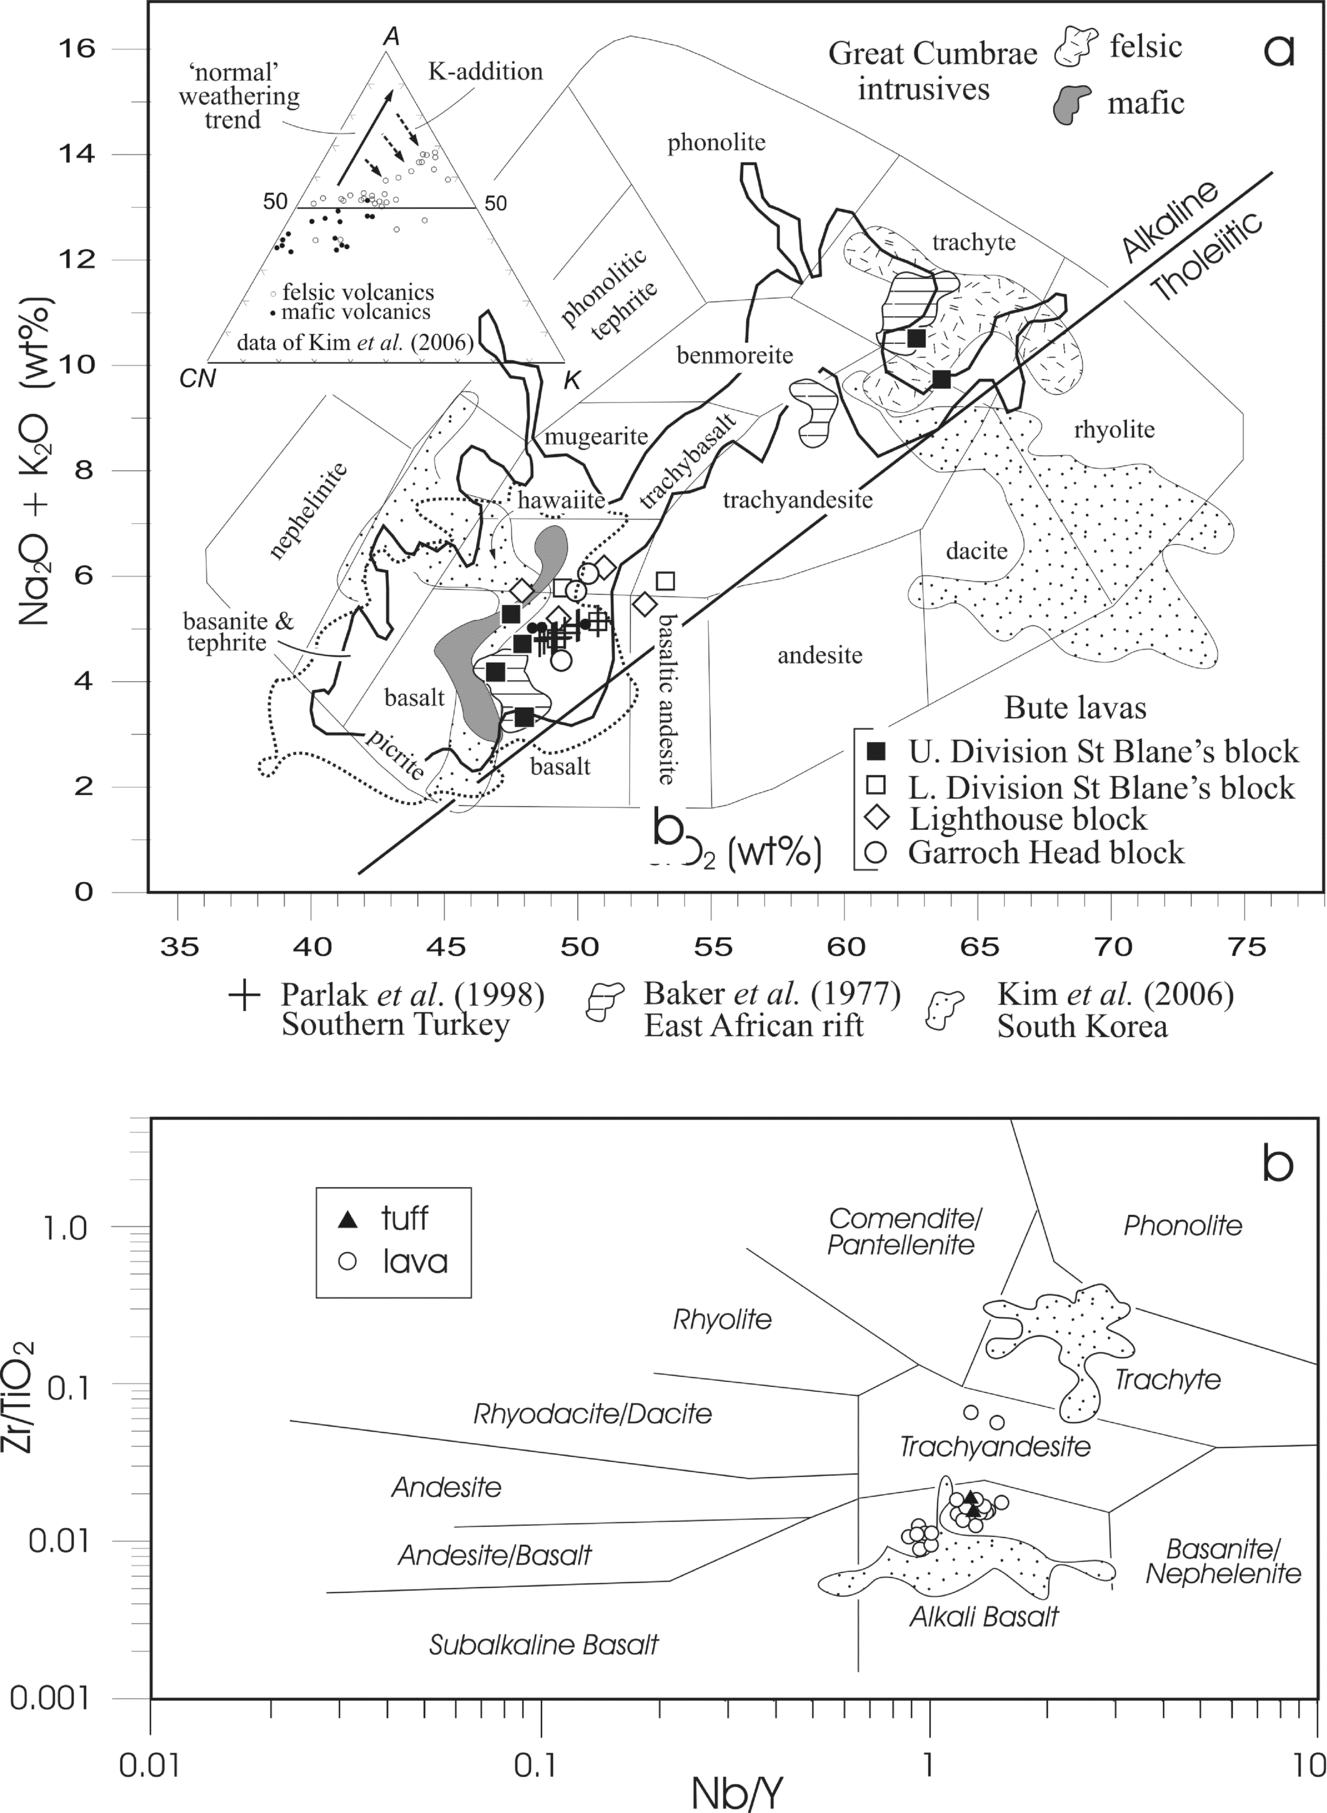
On the total alkalis versus silica (TAS) diagram of Cox, Bell & Pankhurst (Reference Cox, Bell and Pankhurst1979) the analysed samples show a bimodal distribution, reflecting that shown by the mafics triangle. Most of the samples are mildly alkaline and fall into the basalt/hawaiite, trachyte/trachyandesite fields. Almost all of the samples from the lower division of the St Blane's block and from the other two fault blocks are basaltic. Two samples from the middle division of the St Blane's block (Fig. 4) fall into the trachyte field (Fig. 9a). The four most mafic samples in Figure 9a are also from the middle-upper part of the succession in the St Blane's block, indicating that the younger lavas are more highly differentiated than those of the lower division. Samples from Carboniferous intrusive rocks of Great Cumbrae (fields based mainly on data from P. L. Smedley, unpub. Ph.D. thesis, Univ. Edinburgh, 1986) show a similar bimodal distribution, as do samples of much younger lavas from the Gregory Rift in east Africa (Baker et al. Reference Baker, Goles, Leeman and Lindstrom1977) and samples from a Neoproterozoic rift environment in South Korea (Kim et al. Reference Kim, Oh, Ryu, Williams, Sajeev, Santosh and Rajesh2006). Unlike the others, the more felsic samples from South Korea fall into the rhyolite and dacite fields, but this is probably because these samples are altered (see A–CN–K diagram; inset in Fig. 9a). Samples of Pliocene–Quaternary volcanic rocks from Karasu graben at the north end of the Dead Sea transform fault (Parlak et al. Reference Parlak, Kop, Ünlügenç and Demirkol1988) plot in the alkaline basalt field and have compositions similar to those making up the lower division of the Clyde Plateau Formation in Bute (Fig. 9a). A large number of ‘basaltic’ samples from the Midland Valley of Scotland, reported by Fitton (Reference Fitton, Foulger and Jurdy2007) (original data from P. L. Smedley, unpub. Ph.D. thesis, Univ. Edinburgh, 1986 and S. M. Wallis, unpub. Ph.D. thesis, Univ. Edinburgh, 1989) fall into a field similar to that of the mafic Bute samples (Fig. 9a). Two hundred and eighteen analyses of Early Carboniferous lavas (MacDonald, Reference MacDonald1975) show a great compositional spread, but most fall into the basaltic or benmoreite/trachyte fields. It is not known whether after closer sampling of the south Bute lavas the bimodal distribution would be maintained or whether there would be evidence of more samples with ‘intermediate’ compositions. A similar compositional spread was described by Whyte & MacDonald (Reference Whyte and MacDonald1974) and MacDonald & Whyte (Reference MacDonald and Whyte1981) from the Clyde Plateau Formation in the Campsie Fells area. They considered the more salic rocks of that area to have formed as a result of low-pressure differentiation in a shallow, crustal magma chamber, like that beneath large, central-type volcanoes such as Meikle Bin. The most likely candidate for a source of the more differentiated, upper parts of the volcanic succession in south Bute, is the larger Misty Law volcano in the Renfrew Hills (Caldwell & Young, in press).
(a) Total alkalis–silica (TAS) plot (Cox, Bell & Pankhurst, Reference Cox, Bell and Pankhurst1979) to show the distribution of analysed samples from south Bute. Most samples from the lower division (all three blocks) plot in the basalt and hawaiite fields. Samples from the middle and upper divisions (St Blane's block only) are either more mafic or more felsic (trachyte-trachyandesite). Note the similar bimodal distribution of analysed intrusive rocks from the adjacent island of Great Cumbrae (unpub. data and Smedley, Reference Smedley1986). Samples from the Gregory Rift in east Africa (Baker et al. Reference Baker, Goles, Leeman and Lindstrom1977) also show a similar distribution, whereas samples from a continental transcurrent fault zone in southern Turkey have basaltic compositions similar to those of the lower division of the volcanic succession in south Bute. Samples of volcanic rocks from a rift zone in South Korea (Kim et al. Reference Kim, Oh, Ryu, Williams, Sajeev, Santosh and Rajesh2006) show a similar bimodal distribution, but most of the felsic rocks fall into the rhyolite and dacite fields. This is probably due to their being somewhat altered, as shown in the A–CN–K triangle (inset). Heavy dotted line shows the area occupied by 554 ‘basaltic’ samples from the MVS (data from GSA data repository item 2007092, as listed in Fitton, Reference Fitton, Foulger and Jurdy2007; original data from Smedley, Reference Smedley1986a and Wallis, 1989). Heavy black line shows the range of 218 analyses of Permo-Carboniferous rocks in the MVS from Macdonald (Reference MacDonald1975). (b) Plot of Zr/TiO2 versus Nb/Y (Winchester & Floyd, Reference Winchester and Floyd1977) to show the classification of volcanic rocks from south Bute. Most (including two tuff samples) are alkali basalts but two fall into the trachyandesite field. Note that the felsic samples from South Korea (dotted ornament) fall into the trachyte field in this diagram.

Using the trace elements Zr, Nb and Y, together with TiO2, in the classification of Winchester & Floyd (Reference Winchester and Floyd1977), a similar result is obtained, with most samples falling into the alkali basalt field except for the two more felsic samples, which are trachyandesites according to this plot (Fig. 9b). Two tuff samples (39 and 47) plot in the basalt field. The felsic lava samples from South Korea (data of Kim et al. Reference Kim, Oh, Ryu, Williams, Sajeev, Santosh and Rajesh2006) fall into the trachyte field in this plot (compare their positions in Fig. 9a).
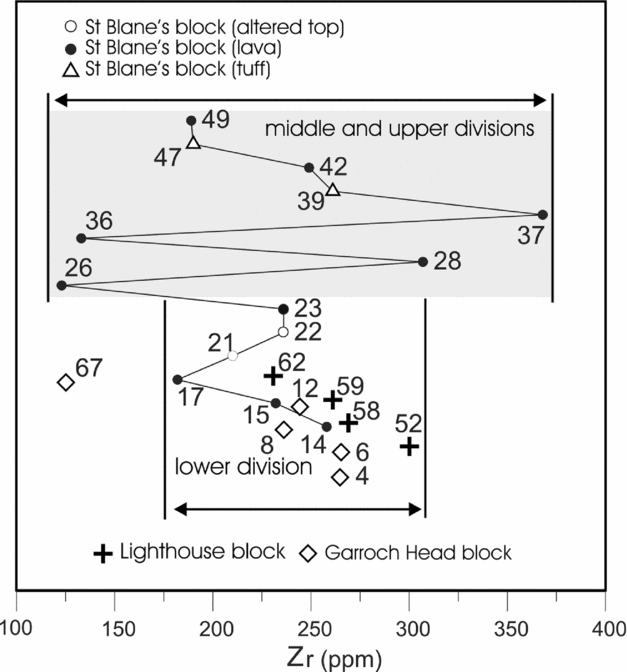
The wide compositional range of samples from the middle and upper division of the St Blane's block is confirmed by a plot of zircon content against stratigraphic position (Fig. 10). Samples from the lower part of the succession have Zr values between about 160 and 300 ppm, whereas samples from the middle and upper divisions of the St Blane's block show a wider range, from about 125 to about 375 ppm.
Distribution of Zr (ppm) in analysed samples from the lower division of all three fault-blocks and from the middle and upper divisions of the St Blane's block. Note that the range of values is much greater in rocks of the higher parts of the succession, illustrating their more differentiated nature.

3.c. Trace elements
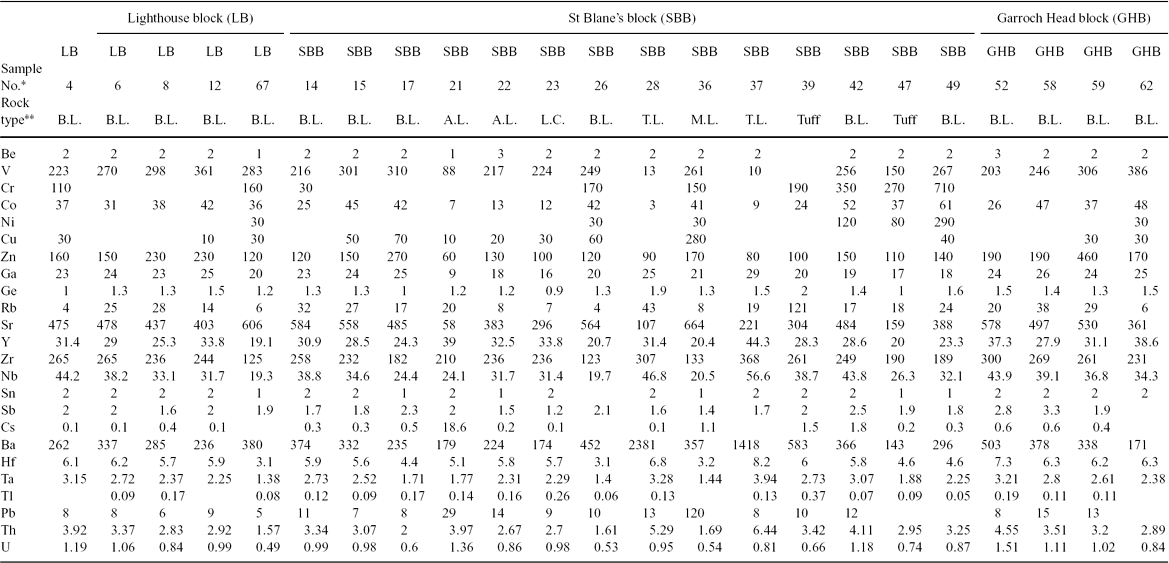
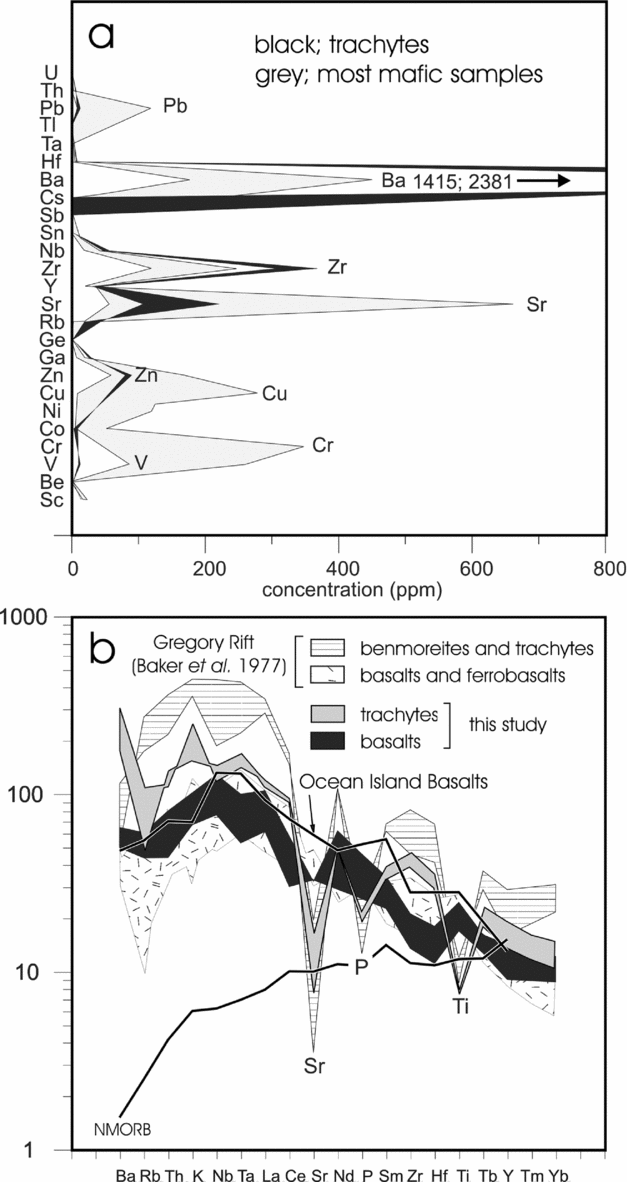
Trace element compositions of 23 analysed samples (with the exception of the REEs, which are listed in Table 3) are shown in Table 2. The most abundant trace elements in all three fault blocks are Ba, Sr and Zr, but Zn and V are also fairly abundant in some samples. Figure 11a shows the distributions (ppm) of trace elements in the two most felsic samples (trachytes of Fig. 9a) and the four associated mafic samples from the upper division of the St Blane's block. The trachytes are significantly enriched in Ba and Zr, whereas the mafic samples are richer in Sr (associated with plagioclase feldspars) and Pb, Zn, Cu, Cr and V.
Trace element content of samples from the Clyde Plateau Volcanic Formation, south Bute (ppm)
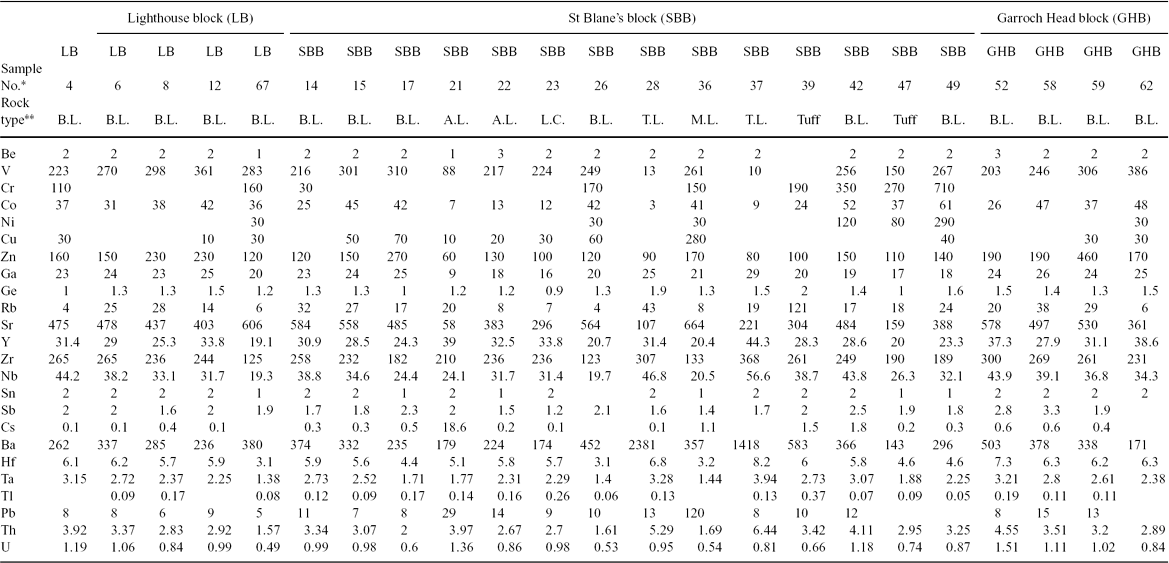
*Sample number; abbreviation for GY-08–04 etc.
**B.L. – basaltic lava; A.L. – altered lava; L.C. – lava corestone; T.L. – trachytic lava. See Table 1 for phenocryst assemblages.
Blank fields – values below detection limits.
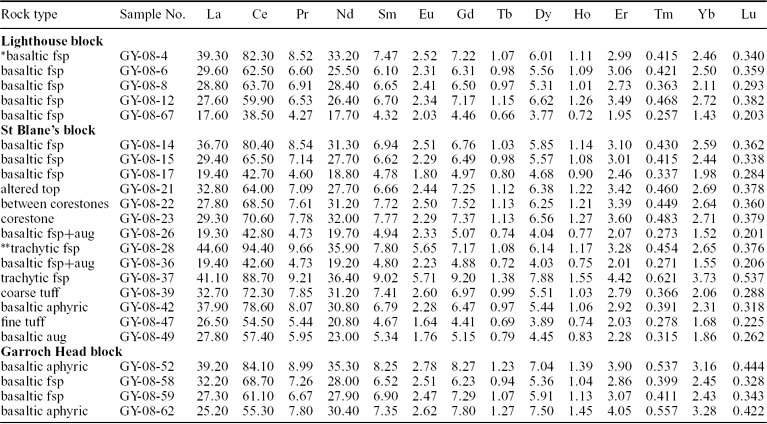
Rare earth element composition of samples from the Clyde Plateau Volcanic Formation, south Bute (ppm)
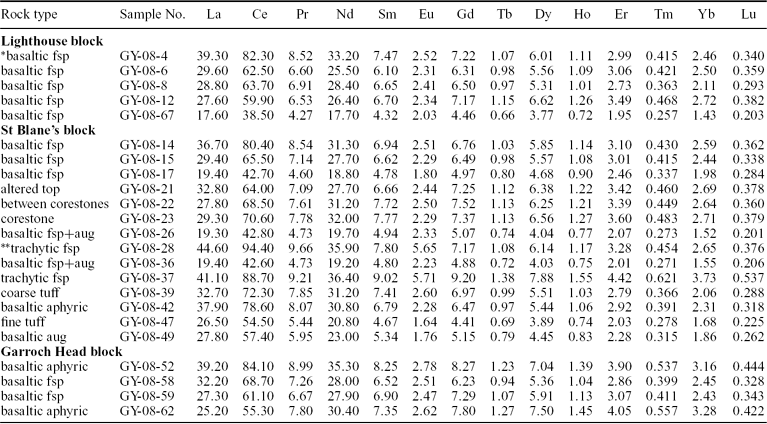
*basaltic may include basalt, basaltic hawaiite and hawaiite; fsp – feldspar phenocrysts; aug – augite phenocrysts.
**trachytic may include trachyte and trachyandesite.
(a) Comparison of the trace element compositions (ppm) of the most mafic (four samples) and felsic (two samples) rocks in the middle-upper division of the St Blane's block. Note the high Ba and Zr contents of the trachytic rocks and enrichment in Sr, Cu and Cr in the mafic samples. See text for discussion. (b) Chondrite-normalized multi-element plot (after Thomson et al. Reference Thomson, Morrison, Dickin, Hendry, Hawkesworth and Norry1983; Rollinson, Reference Rollinson1993) of basaltic (black) and trachytic (grey ornament) samples from south Bute. For comparison, samples of basalts and trachytic rocks of the Gregory Rift area are also shown. All of the plots resemble that of ocean island basalts but the more felsic samples from south Bute and the Gregory Rift are depleted in Sr, P and Ti. See text for discussion.

To compare the analysed samples with others of known tectonic setting, a multi-element plot (spidergram) was constructed (after Thomson et al. Reference Thomson, Morrison, Dickin, Hendry, Hawkesworth and Norry1983; Rollinson, Reference Rollinson1993). This plot show abundances of a series of chondrite-normalized trace (and some major) elements, listed in order of increasing compatibility from left to right on Figure 11b. On this diagram, normal mid-ocean ridge basalt (NMORB) plots as a fairly smooth curve, showing depletion of the least compatible elements, whereas ocean island basalts (OIB) show increasing concentrations of incompatible elements, with a ‘hump’ in the vicinity of Nb and Ta. Basaltic samples from south Bute have a generally similar distribution to average OIB, as do also basalt and ferrobasalt samples from the Gregory Rift in east Africa (Baker et al. Reference Baker, Goles, Leeman and Lindstrom1977). The pattern representing samples of more felsic lava (trachytes) from south Bute is generally similar in shape but most elements are somewhat more enriched, with the significant exceptions of Sr, P and Ti. Felsic rocks from the East African Rift are even more enriched in most of the trace elements but display the same depletions in Sr, P and Ti. The results from volcanic rocks of the East African Rift are very similar to those from south Bute. Samples from a South Korean sample suite, interpreted as having formed in a continental rift setting, show a near-identical pattern with similar depletions in Sr, P and Ti (Kim et al. Reference Kim, Oh, Ryu, Williams, Sajeev, Santosh and Rajesh2006, fig. 7). The depleted elements probably reflect changes in the composition of the magma during fractional crystallization of such phases as plagioclase feldspars, apatite, magnetite and ilmenite.
High field strength elements (HFSE) are incompatible elements with small atomic radii. They have high charge densities and are relatively insoluble in aqueous solutions, so they are commonly (but not universally) considered useful as geochemical markers in situations where more mobile elements, such as large ion lithophile (LIL) elements, may be unsuitable. High field strength elements are commonly used in attempts to identify the tectonic environments of igneous rocks.
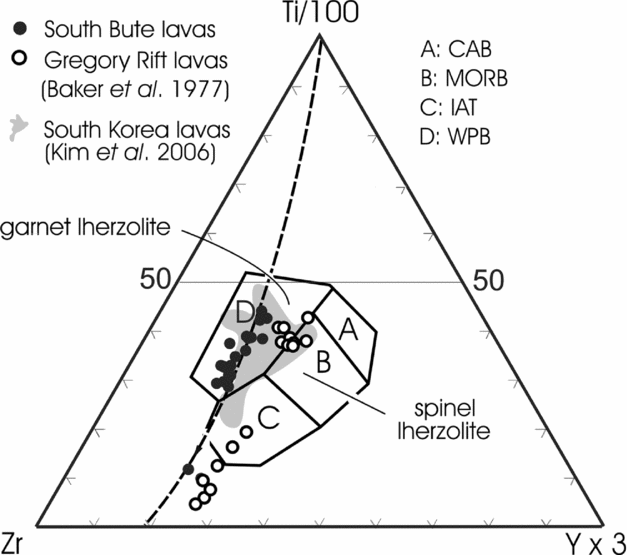
A triangular diagram representing relationships among Ti, Zr and Y (all ppm) has been used to identify tectonic settings of volcanic rocks (Pearce, Reference Pearce and Thorpe1982). On this diagram, all analysed mafic samples from south Bute fall into the ‘within-plate basalts’ field (Fig. 12). This field is characterized by high Zr/Y ratios, relative to those of calc-alkaline basalts, MORB and island arc tholeiites. These high Zr/Y ratios may indicate that the parent magmas had a relatively deep mantle source (garnet lherzolite), as suggested by Upton et al. (Reference Upton, Stephenson, Smedley, Wallis, Fitton, Wilson, Neumann, Davies, Timmerman, Heeremans and Larsen2004) for Carboniferous volcanic rocks elsewhere in the Midland Valley of Scotland. Some samples from south Bute, excluded from the within-plate basalt field on the Ti–Zr–Y triangle, probably reflect loss of Ti from the magma during crystal fractionation. Data from mafic lavas in the Gregory Rift of east Africa (Baker et al. Reference Baker, Goles, Leeman and Lindstrom1977) also plot as ‘within-plate basalts’. The differentiation trend is parallel to that of the Bute lavas but is slightly displaced towards the Y apex on the triangle, suggesting perhaps a somewhat shallower mantle source for the younger rocks. Samples of Neoproterozoic lavas formed in a continental rift setting in South Korea (Kim et al. Reference Kim, Oh, Ryu, Williams, Sajeev, Santosh and Rajesh2006) (shaded area in Fig. 12) are comparable to those from south Bute.
Ti/100–Zr–Yx3 plot (after Pearce, Reference Pearce and Thorpe1982) for lavas from south Bute. Abbreviations: CAB – calc-alkaline basalt; MORB – mid-ocean ridge basalt; IAT – island arc tholeiite; WPB – within-plate basalt. Note that all the samples from south Bute, except one, fall in the within-plate field, as do many samples from South Korea (Kim et al. Reference Kim, Oh, Ryu, Williams, Sajeev, Santosh and Rajesh2006) and the Gregory Rift area (data from Baker et al. Reference Baker, Goles, Leeman and Lindstrom1977).

3.d. Rare earth elements
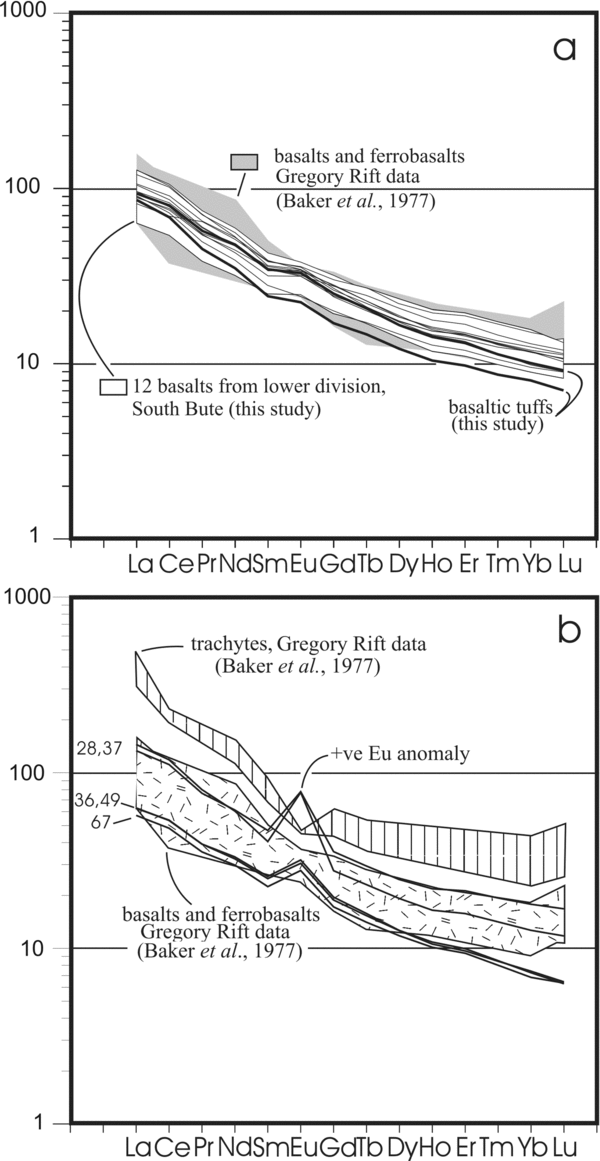
Both Zr and REEs are more abundant in the felsic than mafic lavas of south Bute. There is a strong positive correlation between the sum of REEs and Zr abundance in the analysed samples, suggesting that the rocks underwent fractional crystallization processes (Murphy, Reference Murphy2007). Chondrite-normalized REE plots of basalts from the Lighthouse and Garroch Head blocks and the lower division of the St Blane's block define a fairly narrow field showing some enrichment in light rare earth elements (LREEs). Some samples show a weak positive Eu anomaly (Fig. 13a). All of these samples fall within, or close to, the field representing basalts and ferrobasalts from the Gregory Rift (Fig. 13a). Two samples of bedded tuff from the middle division of the St Blane's block have similar REE patterns, confirming that they are probably basaltic in nature (see Fig. 9b), although they show a slight depletion in heavy rare earth elements.
(a) Chondrite-normalized REE plots of basalt samples from south Bute (white area and fine lines), samples from the Gregory Rift (shaded area; data of Baker et al. Reference Baker, Goles, Leeman and Lindstrom1977) and from two tuff samples from south Bute (heavy lines). (b) REE plots (chondrite-normalized) from trachytes (upper heavy lines) and mafic lavas (lower heavy lines) from the middle and upper divisions of the St Blane's block. Numbers at left side are sample numbers (see Fig. 4). Note that all show positive Eu anomalies. For comparison the ranges of similar plots of mafic and felsic lavas from the Gregory Rift of east Africa (Baker et al. Reference Baker, Goles, Leeman and Lindstrom1977) are shown. Note that the latter lack +ve Eu anomalies; see text for discussion.

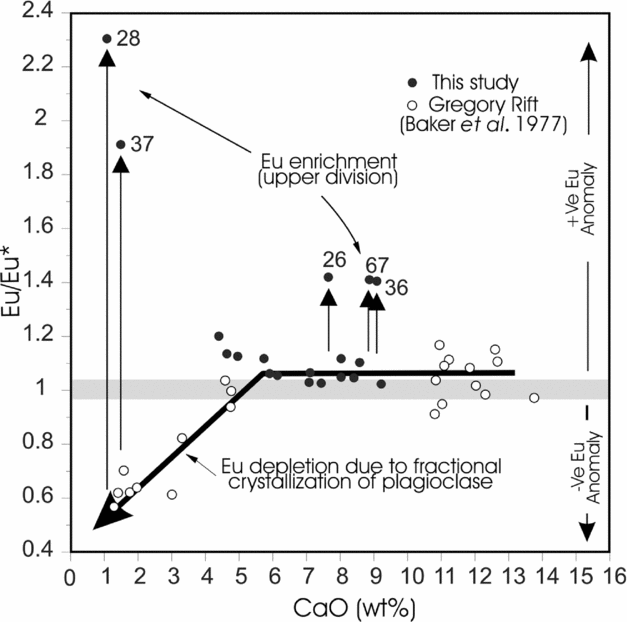
Two trachyte samples from the middle division of the St Blane's block show a high content of REEs relative to most of the sampled basalts and display a similar slope, with near-identical enrichment in LREEs (Fig. 13b). The most striking characteristic of these REE plots is the presence of a positive Eu anomaly. This is in marked contrast to chondrite-normalized plots of trachytes from the Gregory Rift (data of Baker et al. Reference Baker, Goles, Leeman and Lindstrom1977) and rift-related felsic volcanic rocks from South Korea (Kim et al. Reference Kim, Oh, Ryu, Williams, Sajeev, Santosh and Rajesh2006), all of which display distinct negative Eu anomalies. Such anomalies are commonly attributed to crystallization of plagioclase feldspars and concomitant loss of Eu under oxygen fugacities that promote the conversion of Eu+++ to Eu++ and substitution for Ca++ in feldspar lattices (Taylor & McLennan, Reference Taylor and McLennan1985; Murphy, Reference Murphy2007). In the case of the Gregory Rift data, as CaO decreases, there is progressive development of a negative Eu anomaly (Fig. 14). Eu appears to have been removed, together with Ca, as predicted by the substitution mechanism mentioned above. The opposite relationship appears to prevail in the Bute samples, suggesting that a different process is responsible for the positive anomalies observed in some samples. Mafic rocks interbedded with the trachytes have similar chondrite-normalized REE patterns. They have lower overall concentrations of REEs but display similar strong positive Eu anomalies (Fig. 13b). Eu anomalies are weak or absent from most Ca-rich samples from both the Gregory Rift and south Bute (Fig. 14). More Ca-depleted samples from the East African Rift area show development of negative Eu anomalies. In contrast, trachytes from the middle division of the St Blane's block in Bute (Fig. 4, left column) show strong positive Eu anomalies, as also do some interbedded mafic (Ca-rich) samples. In a study of trachytes and phonolites from the eastern part of the Midland Valley of Scotland, Upton, Stephenson & Ellam (Reference Upton, Stephenson and Ellam2007) noted that these rocks have weak positive Eu anomalies. Citing the suggestion (Smedley, Reference Smedley1986) that the magmas evolved under relatively oxidizing conditions, they proposed that Eu would have been in the trivalent rather than divalent state, and therefore would have been less likely to substitute for Ca++ in plagioclase, leaving strong negative Eu anomalies in the more-differentiated felsic rocks. The samples from south Bute (mostly from the middle division of the St Blane's block) are clearly anomalous in having strong positive Eu anomalies. Those with the highest REE contents and strongest Eu anomalies are samples 28 and 37, which have a trachytic composition. The mafic rocks display weaker positive Eu anomalies. These Eu anomalies may indicate that the magmas that were precursors to the more highly differentiated middle division of the south Bute volcanic succession may have formed under conditions of higher oxygen fugacity than those below. The St Blane's block includes abundant pyroclastic rocks, attesting to the volatile-rich nature of magmatism during this phase of volcanic activity, and it is possible that Eu-enrichment may be explained, in part, by hydrothermal processes. Similar positive Eu anomalies have been noted in many rocks affected by hydrothermal activity where Eu was leached from some rocks and precipitated in others (e.g. Bolhar et al. Reference Bolhar, Kamber, Moorbath, Fedo and Whitehouse2004; Edmonds & German, Reference Edmonds and German2004; Klein, Reference Klein2005).
Plot of CaO (wt %) versus Eu/Eu* for samples from south Bute (black dots) and the Gregory Rift area (white circles). Note that when CaO values fall below about 6 % there is a good correlation between CaO content and the Eu anomaly for samples from the Gregory Rift. Five samples from the middle and upper divisions in south Bute show unusually high values for Eu/Eu*. See text for discussion.

4. Alteration of lavas
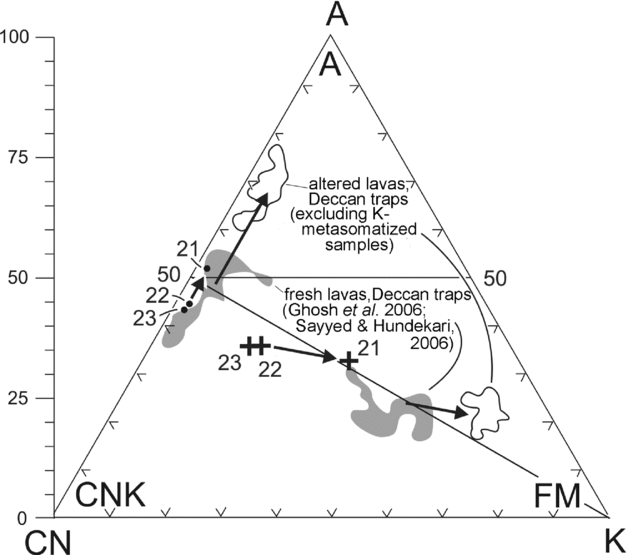
Whereas most of the lavas in south Bute are grey or dark green, the upper parts of some have a pink or purple-red colouration and exhibit textural changes involving a transition from hard, crystalline, fresh lava to a softer, altered-looking fine-grained material. Similar colour and textural variations in lava flows of the Clyde Plateau Formation in other areas have been interpreted as alteration zones or ‘boles’ (e.g. Cameron & Stephenson, Reference Cameron and Stephenson1985). In south Bute, some relatively unaltered portions of these boles resemble ‘corestones’ floating in a matrix of fine-grained, altered material. In the most extreme examples, the fresh igneous rock has been transformed into a homogeneous, fine-grained, purple rock that resembles mudstone (Fig. 5b). Irregular contacts with overlying lavas (Fig. 5c) indicate that the altered material was not completely consolidated at the time of emplacement of the succeeding flow. In order to investigate the nature of these ‘boles’, which are present on many of the lava flows in south Bute (Fig. 3), samples were taken from a corestone (sample 23), pink-coloured matrix between two ‘corestones’ (sample 22) and from homogeneous reddish-purple material at the top of an alteration profile (sample 21).
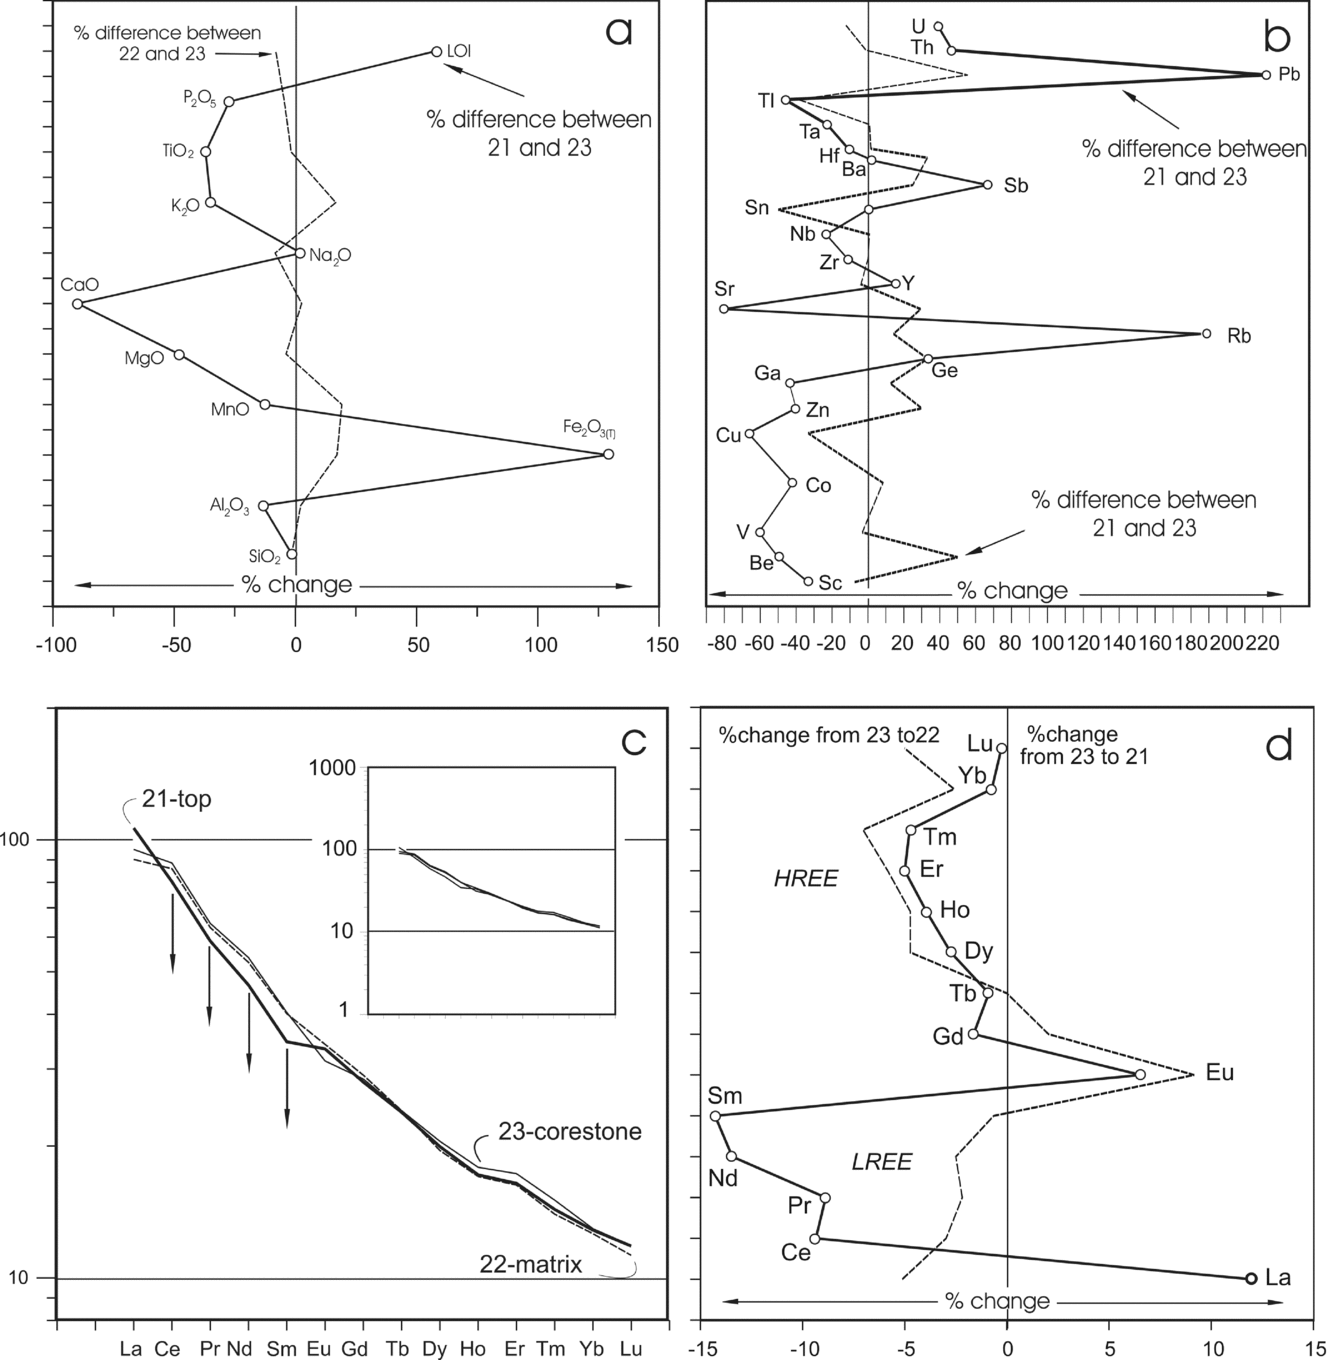
In the A–CN–K triangular diagram, most of the analysed samples (black dots in Fig. 15) plot near the A–CN join, typical of basaltic lavas. Samples 22 and 21 plot higher on the diagram, indicating some chemical alteration (Nesbitt & Young, Reference Nesbitt and Young1984, Reference Nesbitt and Young1989). In A–CNK–FM space the most altered sample (21) is displaced from the presumed original composition (sample 23) towards the FM apex. This is mostly due to an increase in Fe2O3(t) content, from 5.36 (wt %) in sample 23 to 12.26 in sample 21 (Table 1). These changes are similar to those in boles developed on Deccan lava flows in India (Sayyed & Hundekari, Reference Sayyed and Hundekari2006; Ghosh et al. Reference Ghosh, Sayeed, Islam and Hundekari2006). To investigate differences in major element content between the fresh and altered materials in the south Bute lavas, a percentage change diagram was constructed (Fig. 16a). Differences between corestone and matrix material are small, but the most altered (uppermost) sample (21) shows depletion in most major elements, especially Ca and Mg. The exceptions are Fe2O3(t) and LOI, which both show significant increases over their abundance in the unaltered sample (23). The matrix material close to the corestone shows little change in trace element content (Fig. 16b) but most trace elements are depleted in the altered red top (heavy line in Fig. 16b). There is some enrichment in Sb, U and Th, but the strongest concentrations involve Rb and Pb. Chondrite-normalized REE patterns from the altered lava top are similar to those from other mafic lavas in the area (Fig. 16c, inset). They display some enrichment in LREEs but show no significant Eu anomalies. As with the other trace elements, the REE plots from corestone and matrix are virtually indistinguishable. The most altered sample, from the top of the flow, shows some loss of most LREEs relative to the other two samples (arrows in Fig. 16c). The preferential depletion in LREEs (with the exception of La) is shown in Figure 16d, which depicts the percentage differences in REE content among the three samples. Whereas these differences are small, there is a systematic removal of LREEs, presumably during the weathering process. Reddened tops are common on many lavas on the south coast of Bute but they are rarely seen inland. They are interpreted as the products of tropical weathering, following emplacement of the lava flows. The palaeolatitude of the Midland Valley of Scotland appears to have been tropical, about 5° south of the equator, at the time of extrusion of the lavas of the Clyde Plateau Formation (Turner & Tarling, Reference Turner and Tarling1975). The absence of cornstones in these alteration profiles suggests that precipitation exceeded evaporation, in contrast to the semi-arid conditions that prevailed during deposition of the underlying formations of the Inverclyde Group (Paterson & Hall, Reference Paterson and Hall1986; Browne et al. Reference Browne, Dean, Hall, McAdam, Monro and Chisholm1999; Read et al. Reference Read, Browne, Stephenson, Upton and Trewin2002).
A–CN–K plot (black dots) representing three samples taken from an alteration profile developed on a lava flow near the top of the lower division in the St Blane's block (see central column in Fig. 3, middle column, for location). Sample 23 is from a corestone of fresh lava; 22 is from matrix material between corestones; 21 is from the top of the altered zone. Note progressive shift upward on the A–CN–K plot. When the samples (crosses) are plotted on the A–CNK–FM triangle (after Nesbitt & Young, Reference Nesbitt and Young1984, Reference Nesbitt and Young1989) they show progressive increase in FM component. This is mostly due to an increase in Fe content (Table 1). Similar changes are shown in samples of altered tops (boles) developed in lava flows of the Deccan traps in India (Ghosh et al. Reference Ghosh, Sayeed, Islam and Hundekari2006; Sayyed & Hundekari, Reference Sayyed and Hundekari2006).

(a) Percentage change diagram for major elements in the three samples from an alteration profile. There is little difference between samples 22 and 23, but sample 21 shows significant loss of most major elements (particularly Ca and Mg but it is enriched in Fe and has a high LOI value. (b) Percentage change diagram to show variations in trace element content during formation of an alteration profile. Sample 21 shows a marked enrichment in Rb and Pb and is depleted in Sr. (c) Chondrite-normalized plots representing samples from the alteration profile. All three plots are similar (especially those from samples 23 and 22) but sample 21, which is the most altered, shows slight depletion in most light rare earth elements. Note that the y-axis has a different scale from that used in other REE plots (e.g. Fig. 15) but the inset (using the same scale as Fig. 15) shows the strong similarity between these plots and those from other basalts from the lower division. (d) Percentage change diagram comparing REE contents of corestone (23), matrix (22) and highly altered material from the top of the profile (21). Both matrix and the highly altered sample show a slight increase in Eu and slight decreases in most heavy rare earth elements but the most marked change is depletion of most light rare earth elements (La being the exception) in the most highly altered sample (21).

5. Conclusions
Volcanic rocks of south Bute are part of the Viséan Clyde Plateau Formation. Throughout the area volcanic rocks lie disconformably on the sandstone-dominated lower part of the Clyde Sandstone Formation. They are mainly preserved in three fault blocks, with the lower (basalt-rich) part of the succession (lower Strathgryfe Member of the mainland area) forming the eastern and western blocks, and the lower part of the large, medial St Blane's block. Rocks of the lower division are mostly alkali basalts, hawaiites and mugearites, but the middle part of the St Blane's block (correlative to the Misty Law Trachytic Centre) includes trachytes and trachyandesites. The youngest part of the Bute volcanic succession, preserved only in the western part of the St Blane's block, is thought to be equivalent to the upper Strathgryfe Member of the mainland (Caldwell & Young, in press).
Chondrite-normalized multi-element plots from samples of mafic lavas show patterns similar to those of OIBs, with enrichment in incompatible elements. The felsic lavas have similar-shaped patterns but display strong depletions in Sr, P and Ti, reflecting loss of such minerals as plagioclase, apatite and magnetite/ilmenite during fractional crystallization of the parent magmas. The distribution of HFSE confirms a previously inferred within-plate origin for the Bute lavas and also supports derivation from a relatively deep source (garnet lherzolite). Volcanic rocks from other continental rift zones are geochemically similar to those of south Bute and possibly for the Clyde Plateau Formation throughout the western part of the Midland Valley of Scotland. Chondrite-normalized REE plots for the basaltic lavas of the lower division show some enrichment in LREEs, and Eu anomalies are absent or weak. By contrast, some volcanic rocks of the middle and upper divisions display positive Eu anomalies. These may indicate that fractionation took place under high oxygen fugacities during evolution of the parent magmas, or they may have been produced by hydrothermal activity. Red alteration profiles are common in the upper portions of lava flows, testifying to the intermittent nature of flow emplacement and the existence of tropical climatic conditions. The alteration profiles are strongly enriched in iron and show a weak depletion in most LREEs.
Acknowledgements
Financial support for this research was provided by the Natural Sciences and Engineering Research Council of Canada. We are grateful to Dr Wayne Nesbitt for invaluable help with geological and geochemical problems. We also wish to acknowledge valuable comments from two anonymous journal referees.