Introduction
The basic structural element in all kaolin-group minerals, which include kaolinite, dickite, nacrite, and halloysite, is a 1:1 layer of the composition Al2Si2O5(OH)4 consisting of a tetrahedral sheet and an octahedral sheet linked together by a common plane of oxygens and hydroxyls. The defect-free structures of kaolinite, dickite, and nacrite are based on the regular stacking of layers related either by a simple translation, as in kaolinite (Brindley and Robinson Reference Brindley and Robinson1946; Newnham and Brindley Reference Newnham and Brindley1956; Brindley and Nakahira Reference Brindley and Nakahira1958; Zvyagin Reference Zvyagin1960, Reference Zvyagin1967; Brindley et al. Reference Brindley, Kao, Harrison, Lipsicas and Raythatha1986; Bish and von Dreele Reference Bish and von Dreele1989; Neder et al. Reference Neder, Burghammer, Grasl, Schulz, Bram and Fiedler1999), or by glide planes, as in dickite (Newnham and Brindley Reference Newnham and Brindley1956; Newnham Reference Newnham1961; Rozhdestvenskaya et al. Reference Rozhdestvenskaya, Bookin, Drits and Finko1982; Joswig and Drits Reference Joswig and Drits1986; Bish Reference Bish1993; Bish and Johnston Reference Bish and Johnston1993) and nacrite (Bailey Reference Bailey1963; Zvyagin Reference Zvyagin1967, Zvyagin et al. Reference Zvyagin, Soboleva and Fedotov1972; Zheng and Bailey Reference Zheng and Bailey1994). The relationships between the structural features of kaolinite, dickite, and nacrite were discussed in an excellent review by Bailey (Reference Bailey, Murray, Bundy and Harvey1993). The structural features of kaolinite were investigated most extensively because of its geological and industrial importance. In particular, the crystal structure of defect-free Keokuk kaolinite was refined at room (Suitch and Young Reference Suitch and Young1983; Bish and von Dreele Reference Bish and von Dreele1989; Neder et al. Reference Neder, Burghammer, Grasl, Schulz, Bram and Fiedler1999) and low (Bish Reference Bish1993) temperatures. A characteristic feature of natural kaolinites formed in various geological environments is a wide diversity of structural imperfections (Brindley et al. Reference Brindley, Kao, Harrison, Lipsicas and Raythatha1986; Plançon et al. Reference Plançon, Giese, Snyder, Drits and Bookin1989).
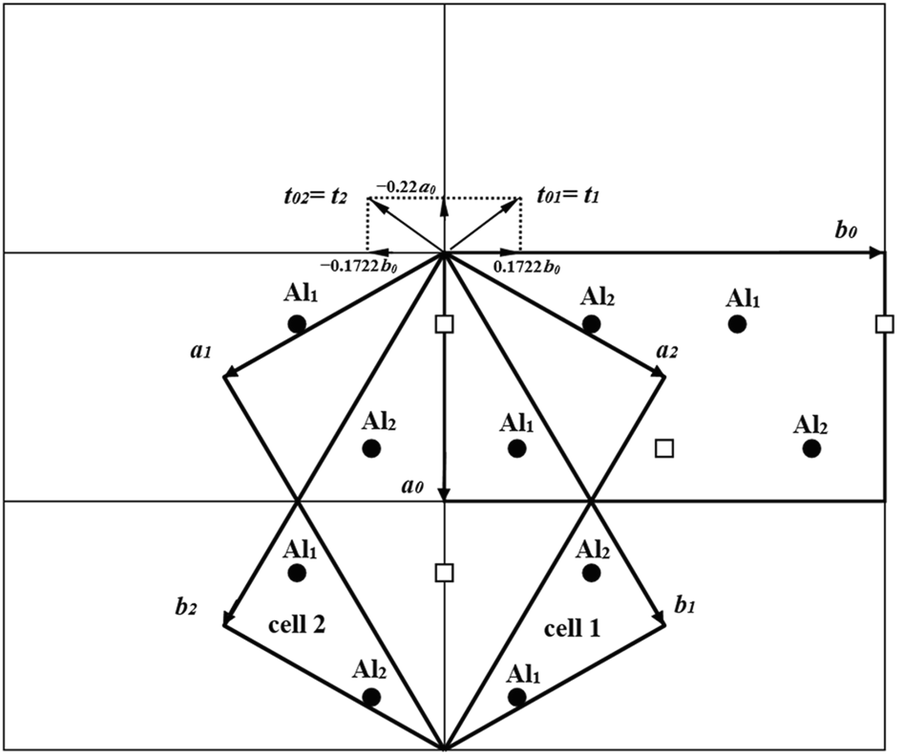
The nature of defects in kaolinite structures has been the subject of intense discussion for a long time. A comprehensive analysis of the possible defects in the kaolinite structure (Bookin et al. Reference Bookin, Drits, Plançon and Tchoubar1989) showed that the distortions of the actual 1:1 layer structure allow neither ±120° mutual layer rotations nor ±b/3 layer translations, nor vacancy displacements that were previously suggested in the literature (Murray Reference Murray1954; Brindley and Robinson Reference Brindley and Robinson1946; Plançon and Tchoubar Reference Plançon and Tchoubar1977, Tchoubar et al. Reference Tchoubar, Plançon, Ben Brahim, Clinard and Sow1982, Brindley et al. Reference Brindley, Kao, Harrison, Lipsicas and Raythatha1986, Plançon and Zacharie Reference Plançon and Zacharie1990). According to Bookin et al. (Reference Bookin, Drits, Plançon and Tchoubar1989), the two-dimensional periodicity of the layers forming a defect-free 1Tc kaolinite structure can be described equally well by an orthogonal unit cell {a 0, b 0, γ0 = 90°} and by two enantiomorphic oblique cells {a 1, b 1, γ1} and {a 2, b 2, γ2}, related by a mirror plane that is normal to the ab plane and passes through the vacant octahedral sites and the centers of the ditrigonal rings of the tetrahedral sheet along the a 0 axis (Fig. 1). The numerical values of unit-cell parameters for the oblique layer cells deduced from the orthogonal layer cell coincide with those determined for the defect-free Keokuk kaolinite sample (Suitch and Young Reference Suitch and Young1983; Bookin et al. Reference Bookin, Drits, Plançon and Tchoubar1989), indicating that the obliquity (γ1,2 ≠ 90°) of the refined unit cell of kaolinite is associated only with the choice of the layer unit cell.
Mutual arrangement of two oblique layer unit cells (cell 1 and cell 2) and the orthogonal unit cell describing the two-dimensional periodicity of the kaolinite layer. Cells 1 and 2 are related by a mirror plane passing through the a 0 axis and normal to the b 0 axis of the orthogonal layer unit cell. The layer displacement vectors t 1 and t 2 form the right- and left-handed kaolinite enantiomorphs, respectively

Two oblique layer unit cells and two layer displacement vectors, t 1 and t 2 , correspond to individual defect-free 1Tc kaolinite enantiomorphs related by a mirror plane. Random interstratification of these layer displacements within individual kaolinite crystallites leads to the formation of right-hand and left-hand kaolinite structure fragments, which consist of the same layers, and determines most of the structural disorder in kaolinite. Simulation of the experimental X-ray diffraction (XRD) patterns of natural kaolinite samples based on this model (Plançon et al. Reference Plançon, Giese, Snyder, Drits and Bookin1989) showed that, as a rule, the studied samples consisted of a physical mixture of two distinct populations of kaolinite crystallites having high-ordered and medium- to low-ordered structures. Direct evidence of the validity of the Bookin et al. (Reference Bookin, Drits, Plançon and Tchoubar1989) model was provided by high-resolution transmission electron microscopy (HRTEM) and selected-area electron diffraction (SAED) of natural kaolinite samples of different origins and degrees of structural disorder (Kogure and Inoue Reference Kogure and Inoue2005a, Reference Kogure and Inoue2005b; Kogure et al. Reference Kogure, Johnston, Kogel and Bish2010; Kogure Reference Kogure2011). In addition, the coexistence of both right- and left-hand micro- and macro-crystals of kaolinite formed by weathering of ancient crust was visualized experimentally by vacuum decoration (Samotoin and Bortnikov Reference Samotoin and Bortnikov2011).
Because kaolinite occurs as fine particles, powder XRD should be the most convenient and helpful technique for comprehensive characterization of defective structures of samples of different origins. The nature of defects in disordered kaolinite structures was first studied, using XRD, by Plançon and Tchoubar (Reference Plançon and Tchoubar1977), Tchoubar et al. (Reference Tchoubar, Plançon, Ben Brahim, Clinard and Sow1982), Plançon et al. (Reference Plançon, Giese, Snyder, Drits and Bookin1989), and Artioli et al. (Reference Artioli, Belloto, Gualtieri and Pavese1995). In the late 1990s and early 2000s, significant progress was achieved in the modeling of the experimental XRD patterns of highly dispersed and disordered structures of various clay minerals (Drits et al. Reference Drits, Środoń and Eberl1997, Reference Drits, Lindgreen, Sakharov, Jakobsen, Salyn and Dainyak2002a, Reference Drits, Sakharov, Dainyak, Salyn and Lindgreen2002b, Reference Drits, Lindgreen, Sakharov, Jakobsen and Zviagina2004, Reference Drits, Derkowski and McCarty2011a, Reference Drits, Derkowski and McCarty2011b , Reference Drits, Sakharov and Hiller2018; Ferrage et al. Reference Ferrage, Lanson, Sakharov, Geoffroy, Jacquot and Drits2007; Lanson et al. Reference Lanson, Sakharov, Claret and Drits2009; Sakharov et al. Reference Sakharov, Lindgreen, Salyn and Drits1999, Reference Sakharov, Lindgreen, Salyn and Drits2004; McCarty et al. Reference McCarty, Sakharov and Drits2009). Sakharov et al. (Reference Sakharov, Drits and McCarty2016) were the first to include in the study of kaolinite structures calculations of the intensity distribution for the whole XRD pattern, including the 00l and hkl reflections in terms of the same set of structural parameters. This approach ensured successful modeling of the experimental XRD patterns of The Clay Minerals Society kaolinite Source Clays KGa-1, KGa-1b, and KGa-2. Good agreement between the experimental and simulated XRD patterns was achieved for these samples using the same model consisting of high- and low-ordered phases differing in terms of the contents of the layer displacement vectors, t 1 and t 2 , with the oblique unit-cell parameters and atomic coordinates refined by Bish and von Dreele (Reference Bish and von Dreele1989).
Kaolinite has two different types of OH groups. The intra-layer OH group, referred to as the inner OH group, is located within the layer and is affected only weakly by changes in the layer stacking. In contrast, the three non-equivalent interlayer OH groups, referred to as inner-surface OH, are located on the basal surface of the octahedral sheet. According to the structural data (Bish and von Dreele Reference Bish and von Dreele1989; Bish Reference Bish1993), in the defect-free kaolinite structure these OH groups are inclined at high angles (60–73o) to the layer plane. They form weak hydrogen bonds with the basal tetrahedral oxygen anions of the adjacent layer and are highly sensitive to changes in the layer stacking. As XRD is weakly sensitive to variations in the H positions, Fourier-transform infrared (FTIR) and Raman spectroscopies are used widely to obtain information on the structural OH groups (Farmer and Russell Reference Farmer and Russell1964; Farmer Reference Farmer and Farmer1974, Reference Farmer1998, Reference Farmer2000; Johnston et al. Reference Johnston, Sposito and Birge1985, Reference Johnston, Agnew and Bish1990, Reference Johnston, Elzea-Kogel, Bish, Kogure and Murray2008; Post and Bish Reference Post, Bish, Bish and Post1989; Brindley et al. Reference Brindley, Kao, Harrison, Lipsicas and Raythatha1986; Balan et al. Reference Balan, Allard, Boizot, Morin and Muller2000, Reference Balan, Saitta, Mauri and Calas2001, Reference Balan, Lazzeri, Saitta, Allard, Fuchs and Mauri2005, Reference Balan, Delattre, Guillaumet and Salje2010).
The OH-stretching region of the IR spectrum of kaolinite consists of four bands at ~3697, ~3670, ~3652, and ~3620 cm–1, labeled ν 1, ν 2, ν 3, and ν 4, respectively. The ν 4 band at ~3620 cm–1 is commonly assigned to the inner OH groups. The identification of the inner-surface OH bands, however, has been more controversial (Balan et al. Reference Balan, Delattre, Guillaumet and Salje2010). One of the interpretations is based on the assumption that the OH-stretching modes are notably anharmonic, i.e. the bands correspond to independent vibrations of the three inner-surface OH groups (Tosoni et al. Reference Tosoni, Doll and Ugliengo2006; Shoval et al. Reference Shoval, Yariv, Michaelian, Boudeulle and Panczer2001, Shoval et al. Reference Shoval, Yariv, Michaelian, Boudeulle and Panczer2002; Johnston et al. Reference Johnston, Elzea-Kogel, Bish, Kogure and Murray2008). The alternative approach (Farmer Reference Farmer and Farmer1974, Reference Farmer1998, Reference Farmer2000) takes into account the contradiction between the almost identical orientation of these OH groups and the wide variation in intensity among the three absorption bands, and suggests that the inner-surface OH vibrations are coupled to give a strong in-phase absorption band at ~3697 cm–1 with the transition moment almost normal to the layers and two weak out-of-phase vibrations at ~3670 and 3652 cm–1 with the transition almost parallel to the (001) plane. This interpretation is in agreement with that of Balan et al. (Reference Balan, Saitta, Mauri and Calas2001), who simulated the IR spectrum of kaolinite using ab initio quantum-mechanical calculations. Effective-medium modeling of the kaolinite spectra obtained at different temperatures (Balan et al. Reference Balan, Delattre, Guillaumet and Salje2010) demonstrated the quasi-harmonic nature of the OH-stretching modes and showed that the coupling of the OH-stretching modes can be related to the macroscopic electrostatic properties of the composite medium made of kaolinite particles and the KBr matrix, but not to the microscopic anharmonic mechanisms.
Johnston et al. (Reference Johnston, Helsen, Schoonheydt, Bish and Agnew1998, Reference Johnston, Elzea-Kogel, Bish, Kogure and Murray2008) studied various sedimentary kaolinite samples using low-temperature FTIR spectroscopy at 15 K and discovered that the spectra of some samples, especially those of their fine fractions, contain, along with kaolinite absorption bands, additional bands assigned to dickite- and nacrite-like structural sequences. The FTIR data were unclear, however, as to whether these sequences existed as separate phases or as stacking disorder.
The objective of the present work was to resolve the existing ambiguities in the interpretation of the data by establishing relationships between the structural and spectroscopic features for a set of kaolinite samples which differ in terms of the amounts of the coexisting high- and low-ordered phases. For this purpose: (1) a representative collection of kaolinites differing in origin, particle size, and degree of disorder was studied by powder XRD and FTIR spectroscopy; (2) the contents of the high- and low-ordered phases in defective kaolinite samples were evaluated, thus providing new insight into the definition of the structural disorder of kaolinite; (3) close relationships were revealed between the degree of structural disorder and specific FTIR features; and (4) special attention was paid to the identification of the inner-surface OH-stretching vibrations coupled to provide the anti-phase ν3 and ν2 bands in kaolinite samples with the given amounts of the high-ordered structural phase (HOK) in accordance with the Cm symmetry of the kaolinite layer.
Materials and Methods
Samples
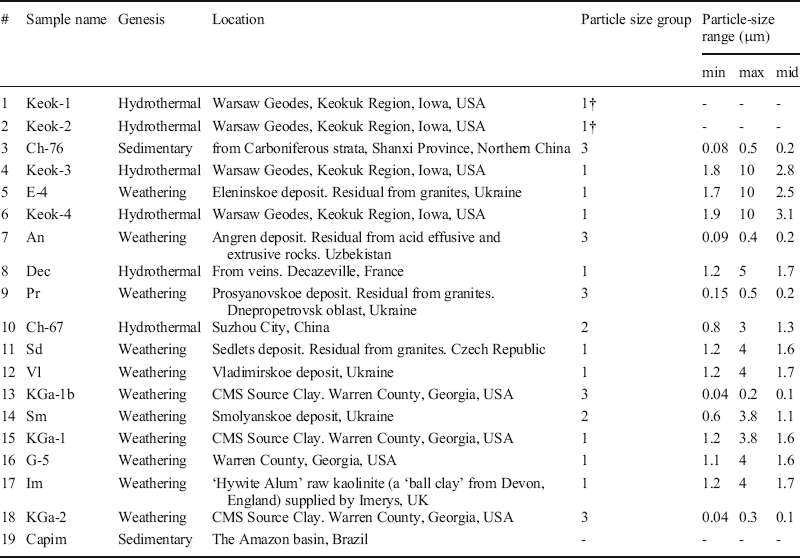
method to remove Fe impuritiesA representative collection of 18 kaolinite samples was studied by XRD, FTIR spectroscopy, and particle-size distribution (PSD) analysis (see Table 1 for the genesis and locations). All the samples were mono-mineralic, except sample Im, which contained a noticeable amount of impurities.
Sample description

†The coarse-particle samples Keok-1 and Keok-2 were included into group 1 without determination of their particle size distribution
The Keok-1, 2, 3, 4, Dec, and An samples were separated by crushing gently and passing through a <0.1 mm sieve. Sample Dec was treated initially by the De Endredy (Reference De Endredy1963) method to remove Fe impurities. Sample Pr was the <1 μm fraction obtained by water-column sedimentation. Samples Ch-76, Ch-67, E-4, Sd, Sm, Vl, KGa-1, KGa-1b, KGa-2, G-5, and Im were not subjected to any sample pretreatment except short-term grinding with a rubber pestle. In addition, the <0.5 μm fraction of sample Capim studied previously by Johnston et al. (Reference Johnston, Elzea-Kogel, Bish, Kogure and Murray2008) and Kogure et al. (Reference Kogure, Johnston, Kogel and Bish2010) was analyzed by FTIR spectroscopy only, as the small amount of sample was not sufficient for XRD and PSD analyses.
Particle-size Distribution (PSD)
The PSD of the studied samples was determined using a Beckman Coulter LS 13 320 laser diffraction particle sizing analyzer, equipped with an aqueous liquid module (ALM) (Beckman Coulter Eurocenter S.A., Nyon, Switzerland). The ALM presents the entire sample to the instrument by re-circulating the sample and does not allow it to aggregate due to constant ultrasonic blending. For the analysis, ~1 mL of a 2% aqueous suspension of kaolinite was used, which was previously ultrasonicated for 1 min at 22 kHz using the UZDN-2T device. The measurements were repeated twice using a new portion of the kaolinite suspension; for each repetition, two scans were performed. The data presented are an average of 2 to 3 scans, which were without bubbles.
X-ray Diffraction
Experiment.
Powder XRD patterns were obtained using a Bruker D-8 X-ray diffractometer (Bruker AXS, Karlsruhe, Germany) under the following conditions: CuKα radiation, scanning interval 2–80o2θ, scanning step 0.05o2θ, a 150 s counting time per step, fixed 0.5o divergence and anti-scattering slits, 0.5o receiving slits, and two 2.5o Soller slits. For each specimen, a flat rectangular sample holder, with dimensions of 3.0 cm × 2.5 cm × 0.3 cm, containing the same mass of sample was used.
Structural components describing defect-free kaolinite.
The phase composition and structural features of tubular halloysite (7Å) were investigated by Drits et al. (Reference Drits, Sakharov and Hiller2018) using modeling of the experimental XRD patterns to determine quantitatively the amounts and structural features of each of the coexisting phases in the studied samples. Both flat kaolinite and tabular halloysite (7Å) varieties were shown to be built of the same fundamental structural unit corresponding to the orthogonal layer unit cell containing a mirror plane. Layer displacements along the t 01 and t 02 vectors are responsible for the formation of the kaolinite enantiomorphs. The parameters and atomic coordinates of the orthogonal layer cell were obtained by a transformation of the oblique unit-cell parameters of the defect-free kaolinite of Bish and von Dreele (Reference Bish and von Dreele1989). This procedure, used in the present work for the determination of the unit-cell parameters and atomic coordinates of the kaolinite orthogonal unit cell and layer displacements, as well as the algorithm for modeling the experimental XRD patterns, is described in detail in the Supplementary Materials 1 (Section I, Table S1, Fig. S1; Section II).
FTIR Spectroscopy
The IR absorption spectra were obtained using a Bruker VERTEX 80v FTIR spectrometer (Bruker Optics, Ettlingen, Germany) equipped with a deuterated triglycine sulfate KBr detector and KBr beam splitter. To control the homogeneity of the kaolinites studied and recovery rate of their spectra, for each sample, 3–6 KBr pellets were prepared, using pure potassium bromide from Uvasol®, Merck, with a minimum amount of adsorbed water. To obtain a KBr-pellet, first, a drop of alcohol was added to 0.5 mg of kaolinite to form a thin film on the surface of the mortar, then 200 mg of KBr was poured on and ground in an agate mortar for 2–3 min; the resulting mixture was placed in a 13 mm pellet die and pressed under vacuum for 5 min under the pressure of 1 ton and then another 15 min under the pressure of 10 tons. In order to remove the adsorbed molecular water, the pellets were placed in a glass desiccant box with CaCl2 and heated in a furnace at 150°C for at least 20 h. After cooling, for each KBr-pellet, 256 scans were recorded under vacuum in the MIR region (4000–400 cm–1) with a resolution of 1 cm–1. Only spectra with the minimum contribution of the band corresponding to vibrations of adsorbed water were included in the work.
The OH-stretching region of each spectrum (3800–3550 cm–1) was cut, and then baseline-corrected using the OPUS 7.2 software package (Bruker Ltd.). Baseline correction was made in interactive mode using the Straight lines function and one iteration for additional concave rubber and correction.
The OH-stretching region of each spectrum (3800–3550 cm–1) was decomposed and fitted using the Fityk 1.3.1 software package. For the FTIR spectra under study, the best fits were obtained assuming a symmetric Lorentzian peak shape for all four OH bands:

where H is the height, C is the center, HWHM is the half-width at half-maximum (HWHM = FWHM/2, where FWHM stands for full width at half-maximum). The variables were position C, HWHM, and H. In the spectra of samples Sd and Vl, an additional small band at ~ 3598 cm–1 corresponding to Al-for-Fe substitutions was added.
For all four bands, the area values (A) were calculated using the equation:

where IB is the integral width, which is proportional to FWHM: IB = (π/2)FWHM = 1.5708⋅FWHM. Taking into account the Lorentzian shape of the bands, all the studied spectra were normalized to the same area of inner OH-group bands (~3620 cm–1) = 5. As the FWHM of a band is constant with the varying height, the height H(ν 4 ) of the normalized band of the inner OH-group is

where H′(ν 4 ) and A′(ν 4 ) are the height and area of the 3620 cm–1 OH band in the non-normalized FTIR spectrum. The normalized areas A(ν n ) for the other three bands are then given by

where H ′ (ν n) is the band height in the non-normalized spectrum.
Results
Particle-size Distribution
Among the 16 samples analyzed by the technique described above, three groups were identified: for group 1, the particle size varies from 1.1 to 10.0 μm; for group 2, from 0.6 to 3.8; and for group 3, from 0.04 to 0.5 μm (Table 1). Two coarse-particle samples, Keok-1 and Keok-2, were included into group 1 without determination of their particle-size distribution.
Simulation of XRD Patterns
Based on the preliminary estimated parameters, the XRD patterns were calculated for a defect-free model and a model in which the layer displacement vectors t 01 and t 02 occurred in similar proportions and were interstratified at random. In agreement with Plançon et al. (Reference Plançon, Giese, Snyder, Drits and Bookin1989) and Sakharov et al. (Reference Sakharov, Drits and McCarty2016), the studied samples were shown to consist of two phases with different contents of stacking faults, whereas the peak positions of the 02l and 11l reflections almost coincided in the experimental XRD pattern and that of the defect-free model. The highly ordered population of CSDs in the sample, termed the HOK phase, therefore, contained either few or no stacking faults (Table S2). The positions of the 11l and 02l reflections corresponding to the HOK phase were very sensitive to the contents of the layer displacement vector t 02 . The modeling results showed that an increase in the contents of the t 02 layer displacements above 3% shifted noticeably the positions of the 02l and 11l reflections in the XRD patterns of the HOK phase with respect to those observed in the experimental XRD pattern. A significant background, which separates individual 02l, 11l reflections from the baseline of the experimental XRD pattern, resulted from the contribution of the low-ordered population of crystallites termed the LOK phase.
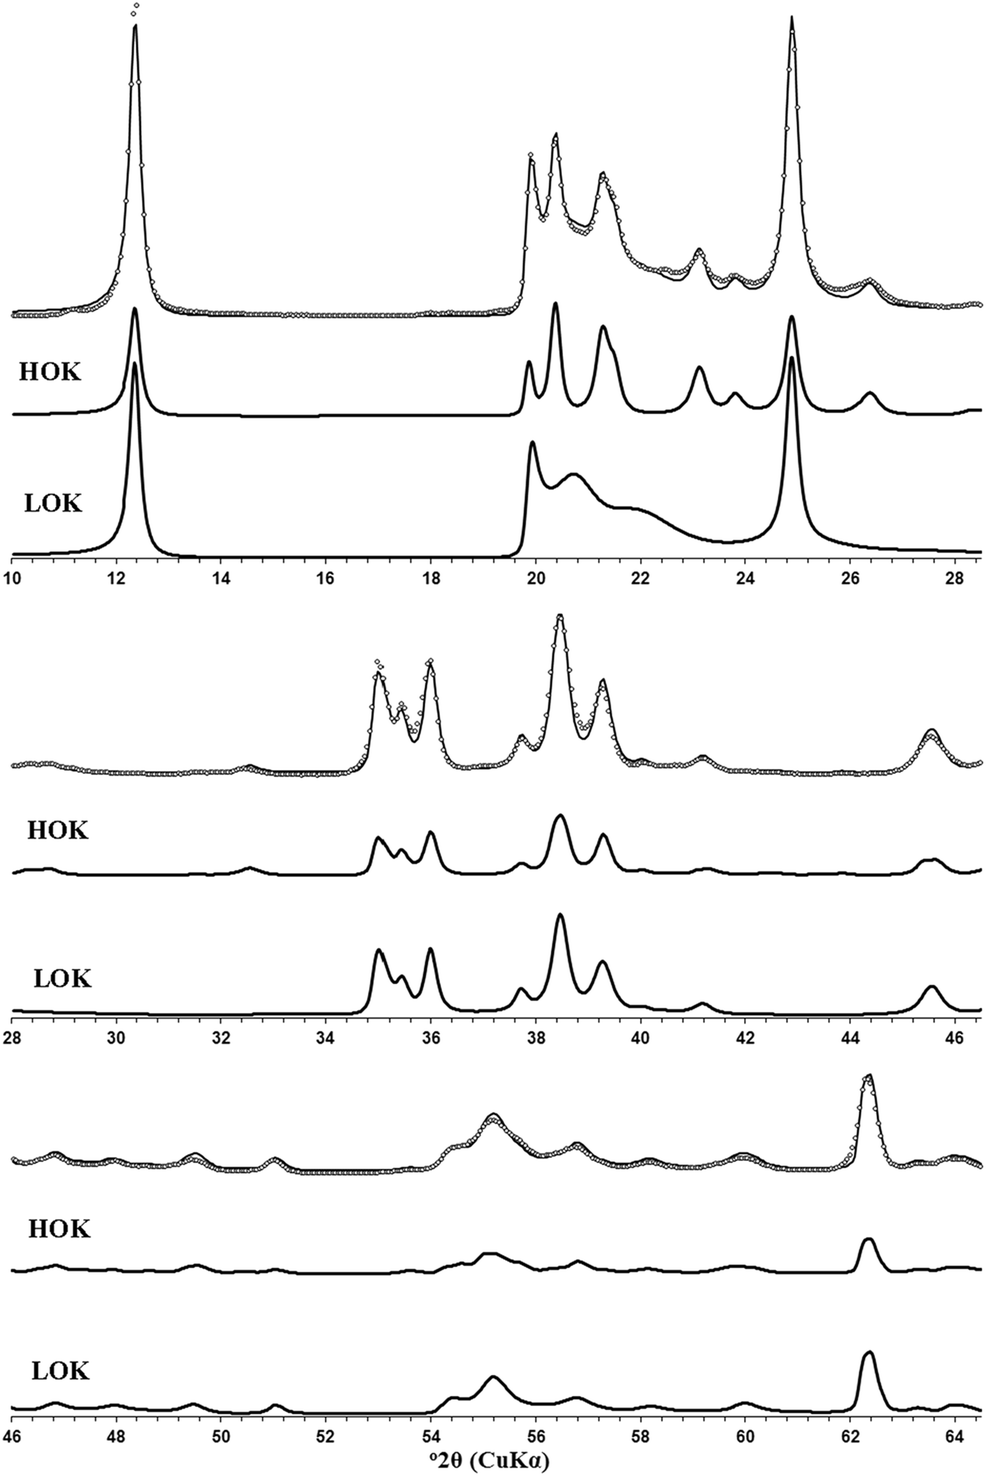
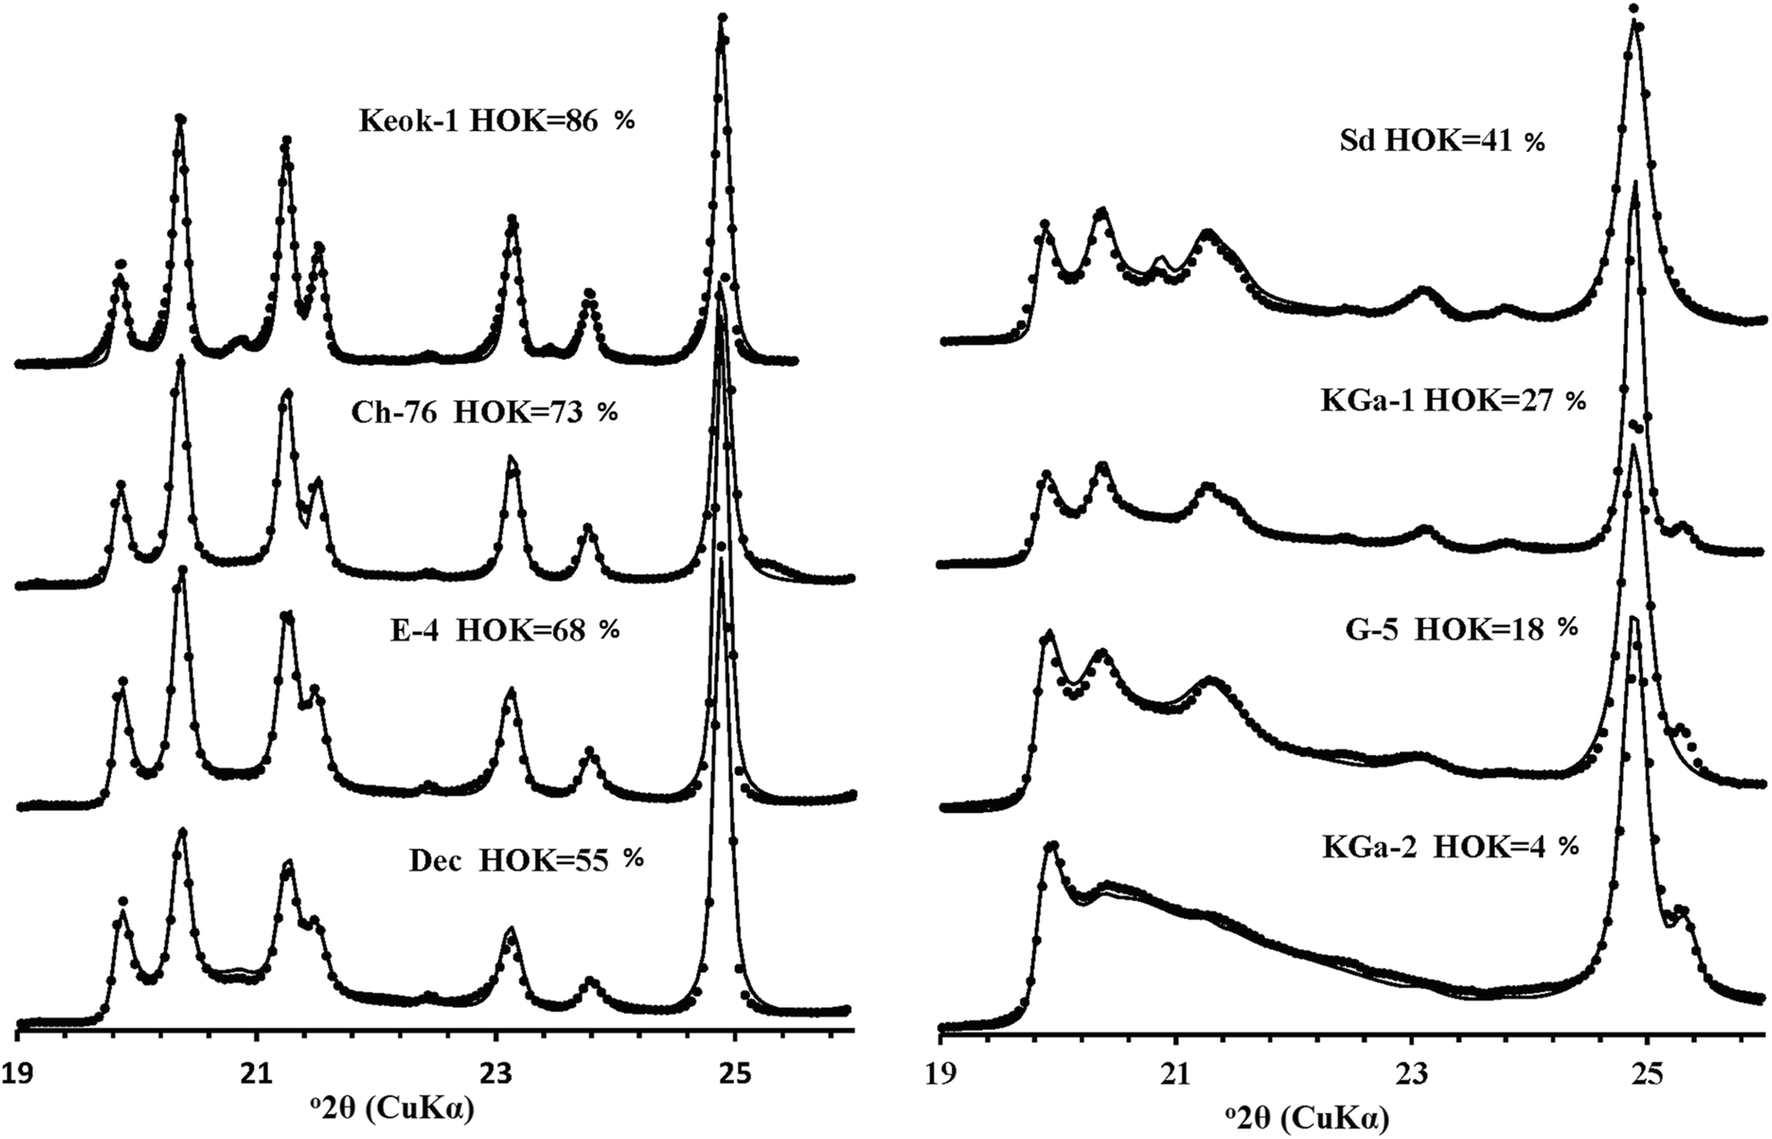
The defect structure of each of the coexisting phases in the samples was determined by the trial-and-error method by varying the types of defects, their occurrence, and the amounts of the phases. The best fits to experimental powder XRD data were achieved using a set of parameters describing the structural models of the HOK and LOK phases (Table S2), the XRD patterns of which were simulated for the whole diffraction range (Fig. S2). Experimental and calculated XRD data are given in Supplementary Material 2. As expected, the HOK phases in the samples studied have almost defect-free structures, in which 97–100% of layer pairs are related by the layer displacement vector t 01 , and only 3% of layer pairs form enantiomorphic structure fragments. In contrast, in the LOK phases, the three t 01, t 02, and t 0 layer displacements are interstratified at random, so that t 01 and t 02 occur in similar proportions, whereas the proportion of t 0 is ≤ 0.05 (Table S2). The HOK and LOK phases differ in terms of two distinctive features. First, the addition of a certain content of the t 0 layer displacements to the LOK phases improves slightly the quality of the agreement between the experimental and calculated XRD patterns. Model calculations showed that, even visually, the agreement between the experimental and calculated XRD patterns became worse when the LOK phase had no t 0 stacking faults. The second difference between the probability parameters describing the HOK and LOK phases is the presence, in the LOK phase, of layer displacements in arbitrary directions and at arbitrary distances (Drits and Tchoubar Reference Drits and Tchoubar1990). In contrast to the 02l and 11l reflections, the positions and intensities of the maxima in the 20l, 13l regions of the experimental XRD patterns did not depend on the HOK and LOK amounts (Sakharov et al. Reference Sakharov, Drits and McCarty2016). The XRD patterns corresponding to the HOK and LOK populations, taken in different proportions for different samples, provided the optimal agreement between the experimental and calculated patterns with the Rp values from 18.8 to 8.3%, although for most samples the Rp values were within the 8.3–11.8% range (Table S2). This result can be considered as direct evidence that each sample consisted of a physical mixture of HOK and LOK phases, the proportions of which vary within a wide range from 86%:14% for Keok-1 and 4%:96% for KGa-2 (Table S2). To illustrate the quality of the agreement between the experimental and simulated XRD patterns, three fragments of the experimental XRD pattern of sample Sm and the patterns for the HOK and LOK phases are shown in an expanded scale (Fig. 2). The HOK crystallites contributed significantly to the positions, widths, and intensities of the 02l, 11l reflections, whereas the LOK crystallites contributed to the background in a non-uniform manner, as well as to the profile of the 020 reflection. Close agreement between the 02l, 11l regions in the simulated and experimental XRD patterns for samples with different HOK contents is shown in Fig. 3.
Comparison of different experimental fragments of the XRD pattern of the Sm sample (open circles) and those obtained by the optimal summation of the modeled XRD patterns of the HOK and LOK phases (solid lines) shown at an expanded scale. The contributions of XRD patterns of the HOK and LOK phases are shown below each fragment of the patterns under comparison.

Fragments of the XRD pattern corresponding to the 02, 11 region of samples Keok-1, Ch-76, E-4, Dec, Sd, KGa-1, G-5, and KGa-2 (black circles) showing agreement with the patterns obtained by optimal summation of the XRD patterns of the HOK and LOK phases (solid lines)

The good agreement between the experimental and calculated XRD patterns obtained for the whole 10–65°2θ diffraction range with low-profile fitting factors is strong evidence for the validity of the defined defective models in the studied samples. Importantly, the same layer orthogonal unit-cell parameters were used for all the models (Table S2).
FTIR Spectroscopy
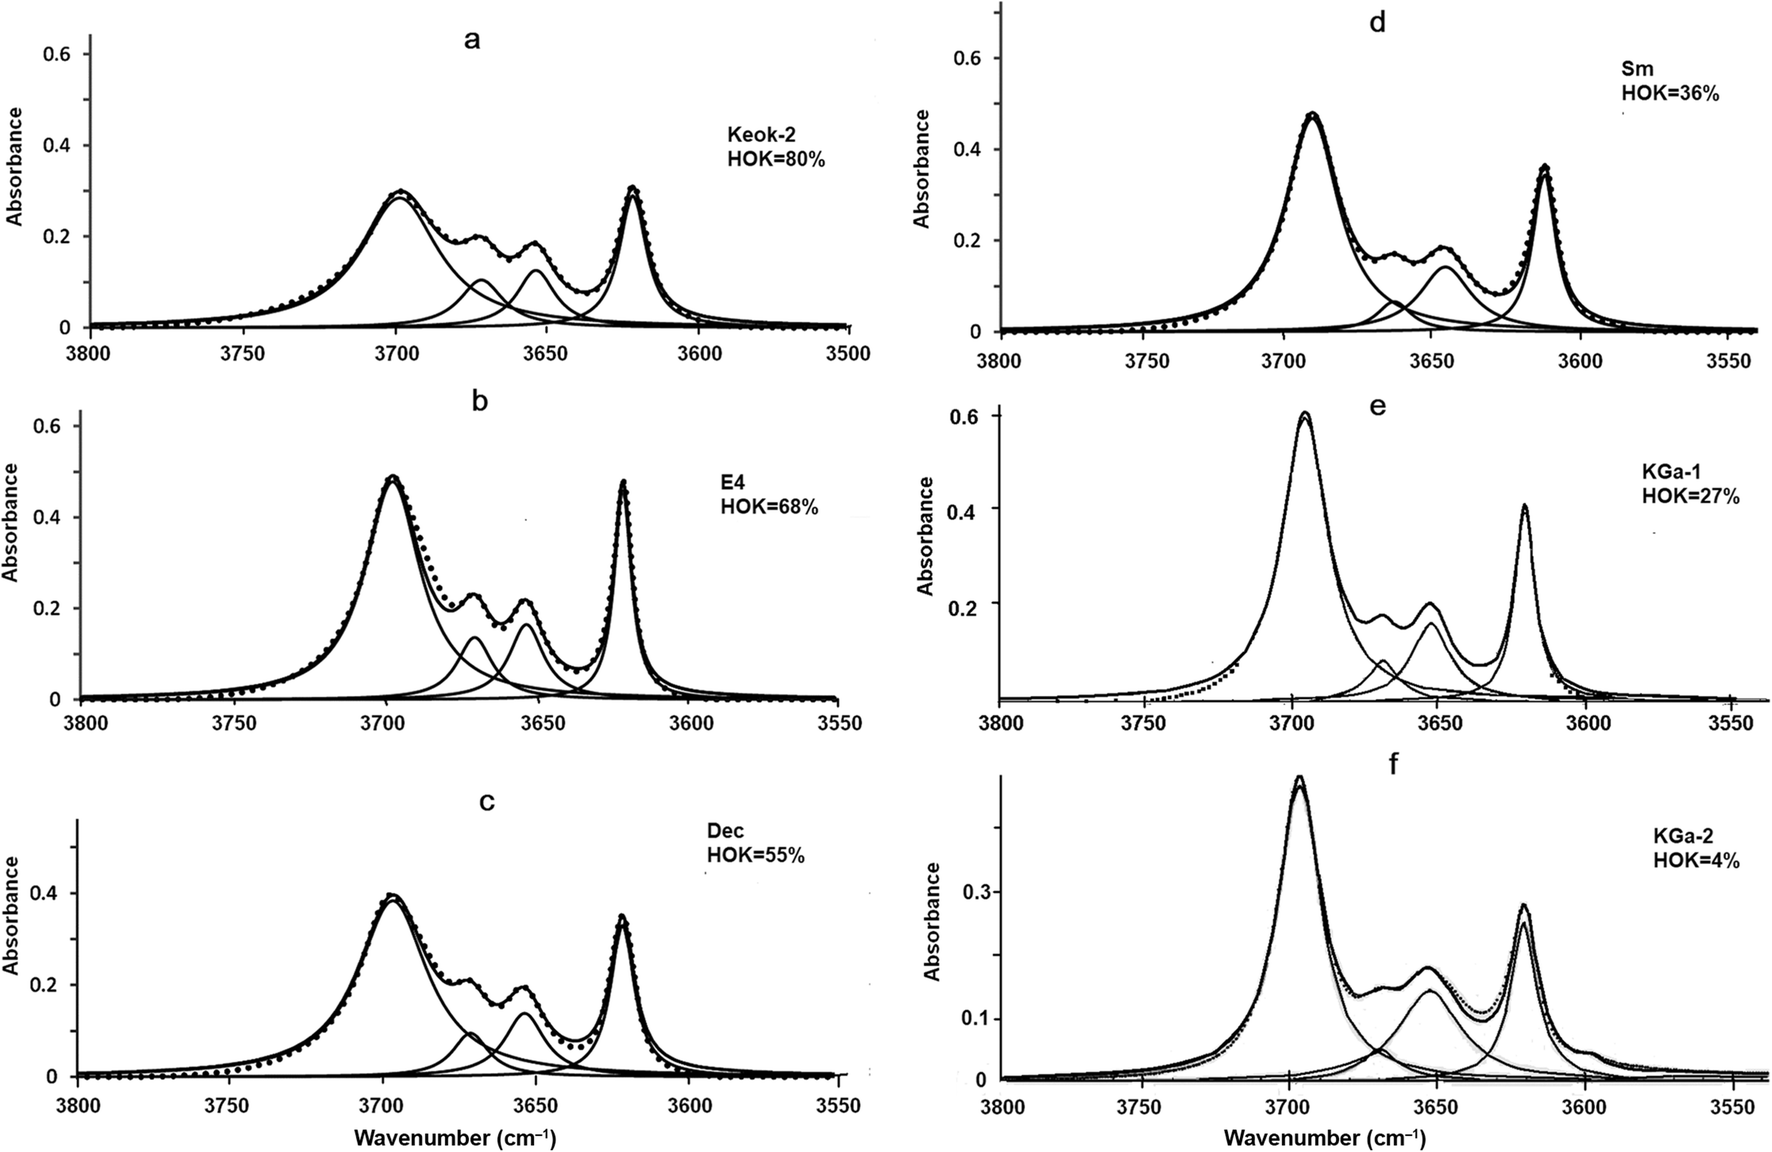
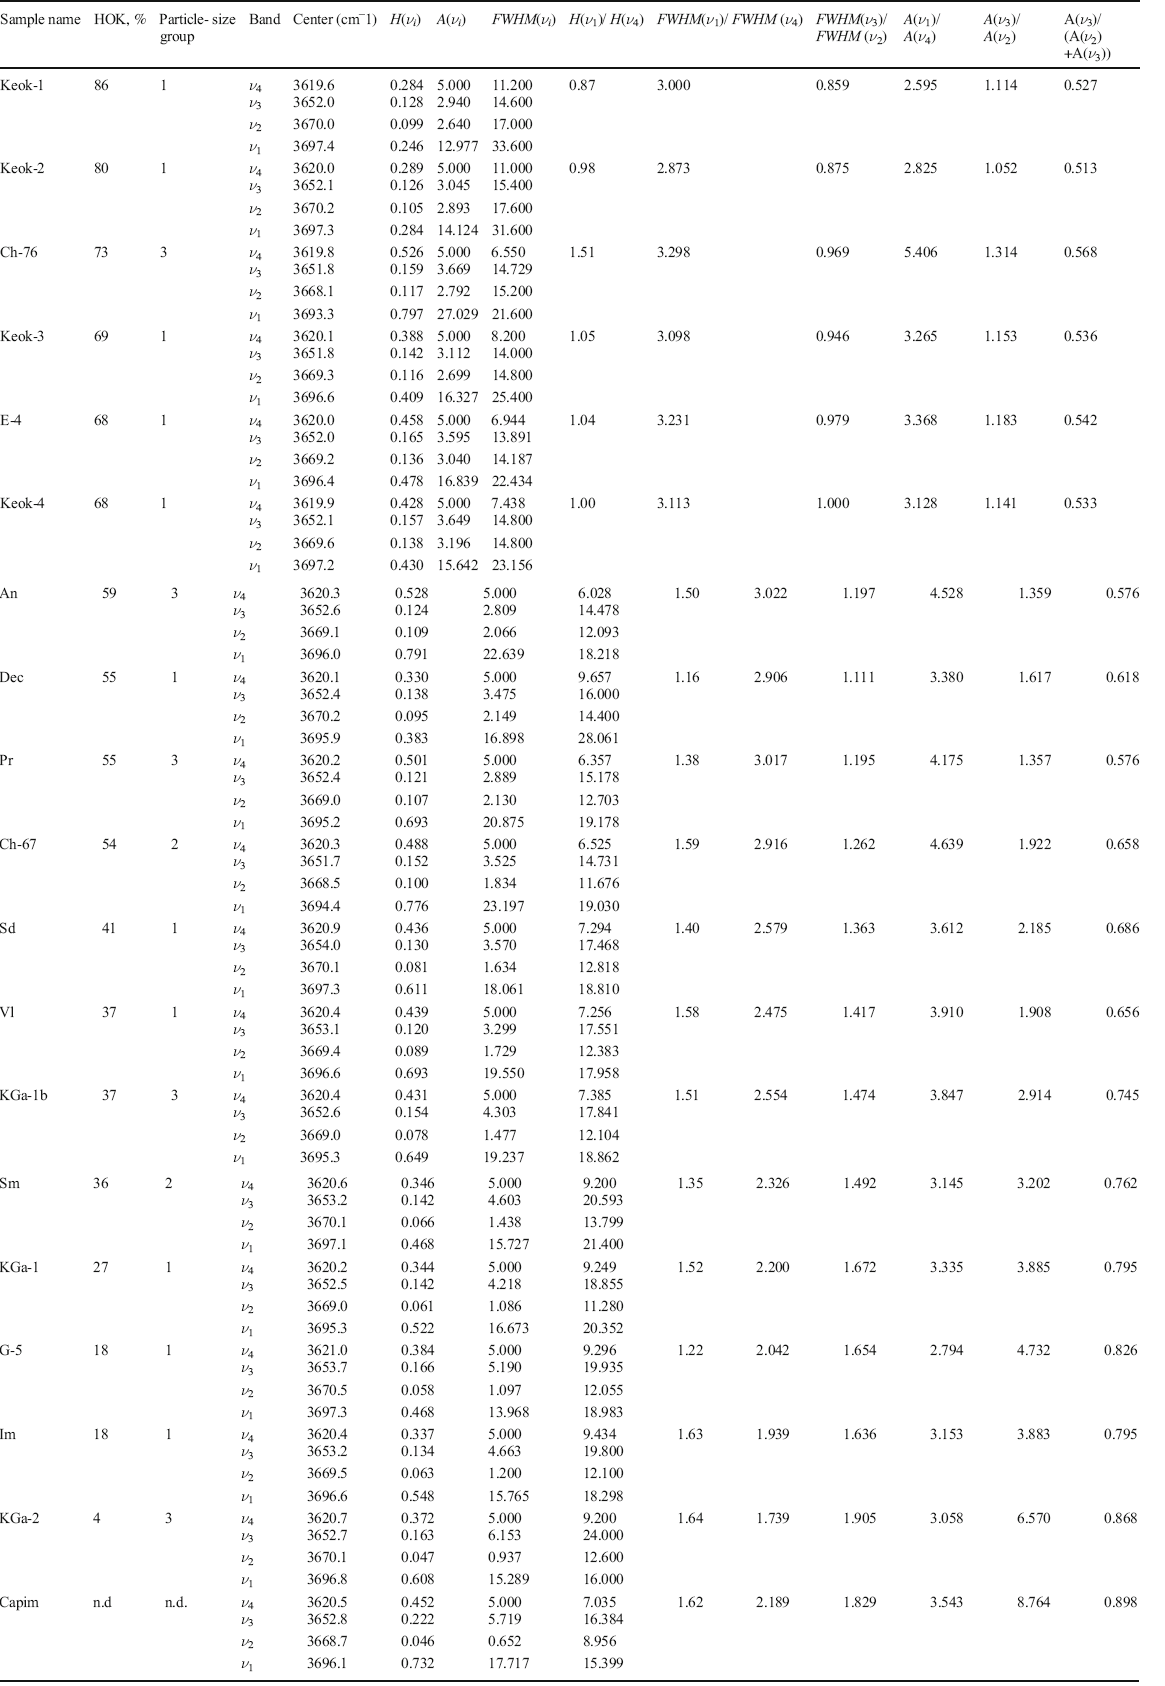
The normalized spectra of the studied samples (Fig. 4a–f; Supplementary Material 1: Fig. S3a–c) were decomposed with four bands, each of which was characterized by position, height, area, and FWHM values (Table 2). The positions of the ν 1, ν 2, ν 3, and ν 4 bands were 3695.3±2.0, 3669.3±1.2, 3652.2±0.5, and 3619.6±0.7 cm–1, respectively. The spectra from the coarse-particle, high-ordered (HOK > 50%) samples (Keok-1, Keok-2, Keok-3, E4, Keok-4, and Dec) were characterized by a specific intensity distribution, with similar heights of the ν 1 and ν 4 bands (H(ν 1)/H(ν 4) = 1.02±0.14) (Fig. 4a, b, c; Fig. S3a; Table 2). For the rest of the samples, the H(ν 1)/H(ν 4) values varied within a wide range from 1.22 (sample G-5) to 1.64 (sample KGa-2). For all the samples, however, the integrated intensities of the ν 1 bands were greater than those for the ν 4 bands: A(ν 1 )/A(ν 4 ) = 2.6–5.4 (Table 2).
Decomposition and curve-fitting of the FTIR spectra of the kaolinite samples in the OH-stretching region: a Keok-2; b E-4; c Dec; d Sm; e KGa-1; and f KGa-2

HOK contents, particle-size groups, and FTIR characteristics for the kaolinite samples under study. (H ( ν i ), A ( ν i ), and FWHM ( ν i ), where i = 1̶4, are the heights, integrated intensities, and full widths at half-maximum, respectively)

In all the spectra, the heights and integrated intensities of the ν 2 and ν 3 bands were lower than those of the ν 1 bands. Furthermore, the H(ν 3) and A(ν 3) values were always greater than H(ν 2) and A(ν 2), respectively, and the A(ν 3)/A(ν 2) values increased with decreasing HOK contents (Table 2). This trend was most pronounced for the samples with HOK < 30% (A(ν 3 )/A(ν 2 ) = 3.88–8.76, Fig. 4e, f; Fig. S3c; Table 2), so that sample KGa-2, which had the least ordered crystal structure (HOK = 4%), as well as sample Capim (HOK not determined), had the highest A(ν 3)/A(ν 2) values (6.57 and 8.76, respectively, Table 2).
Discussion
Relationships between the HOK Contents and the FWHM Values
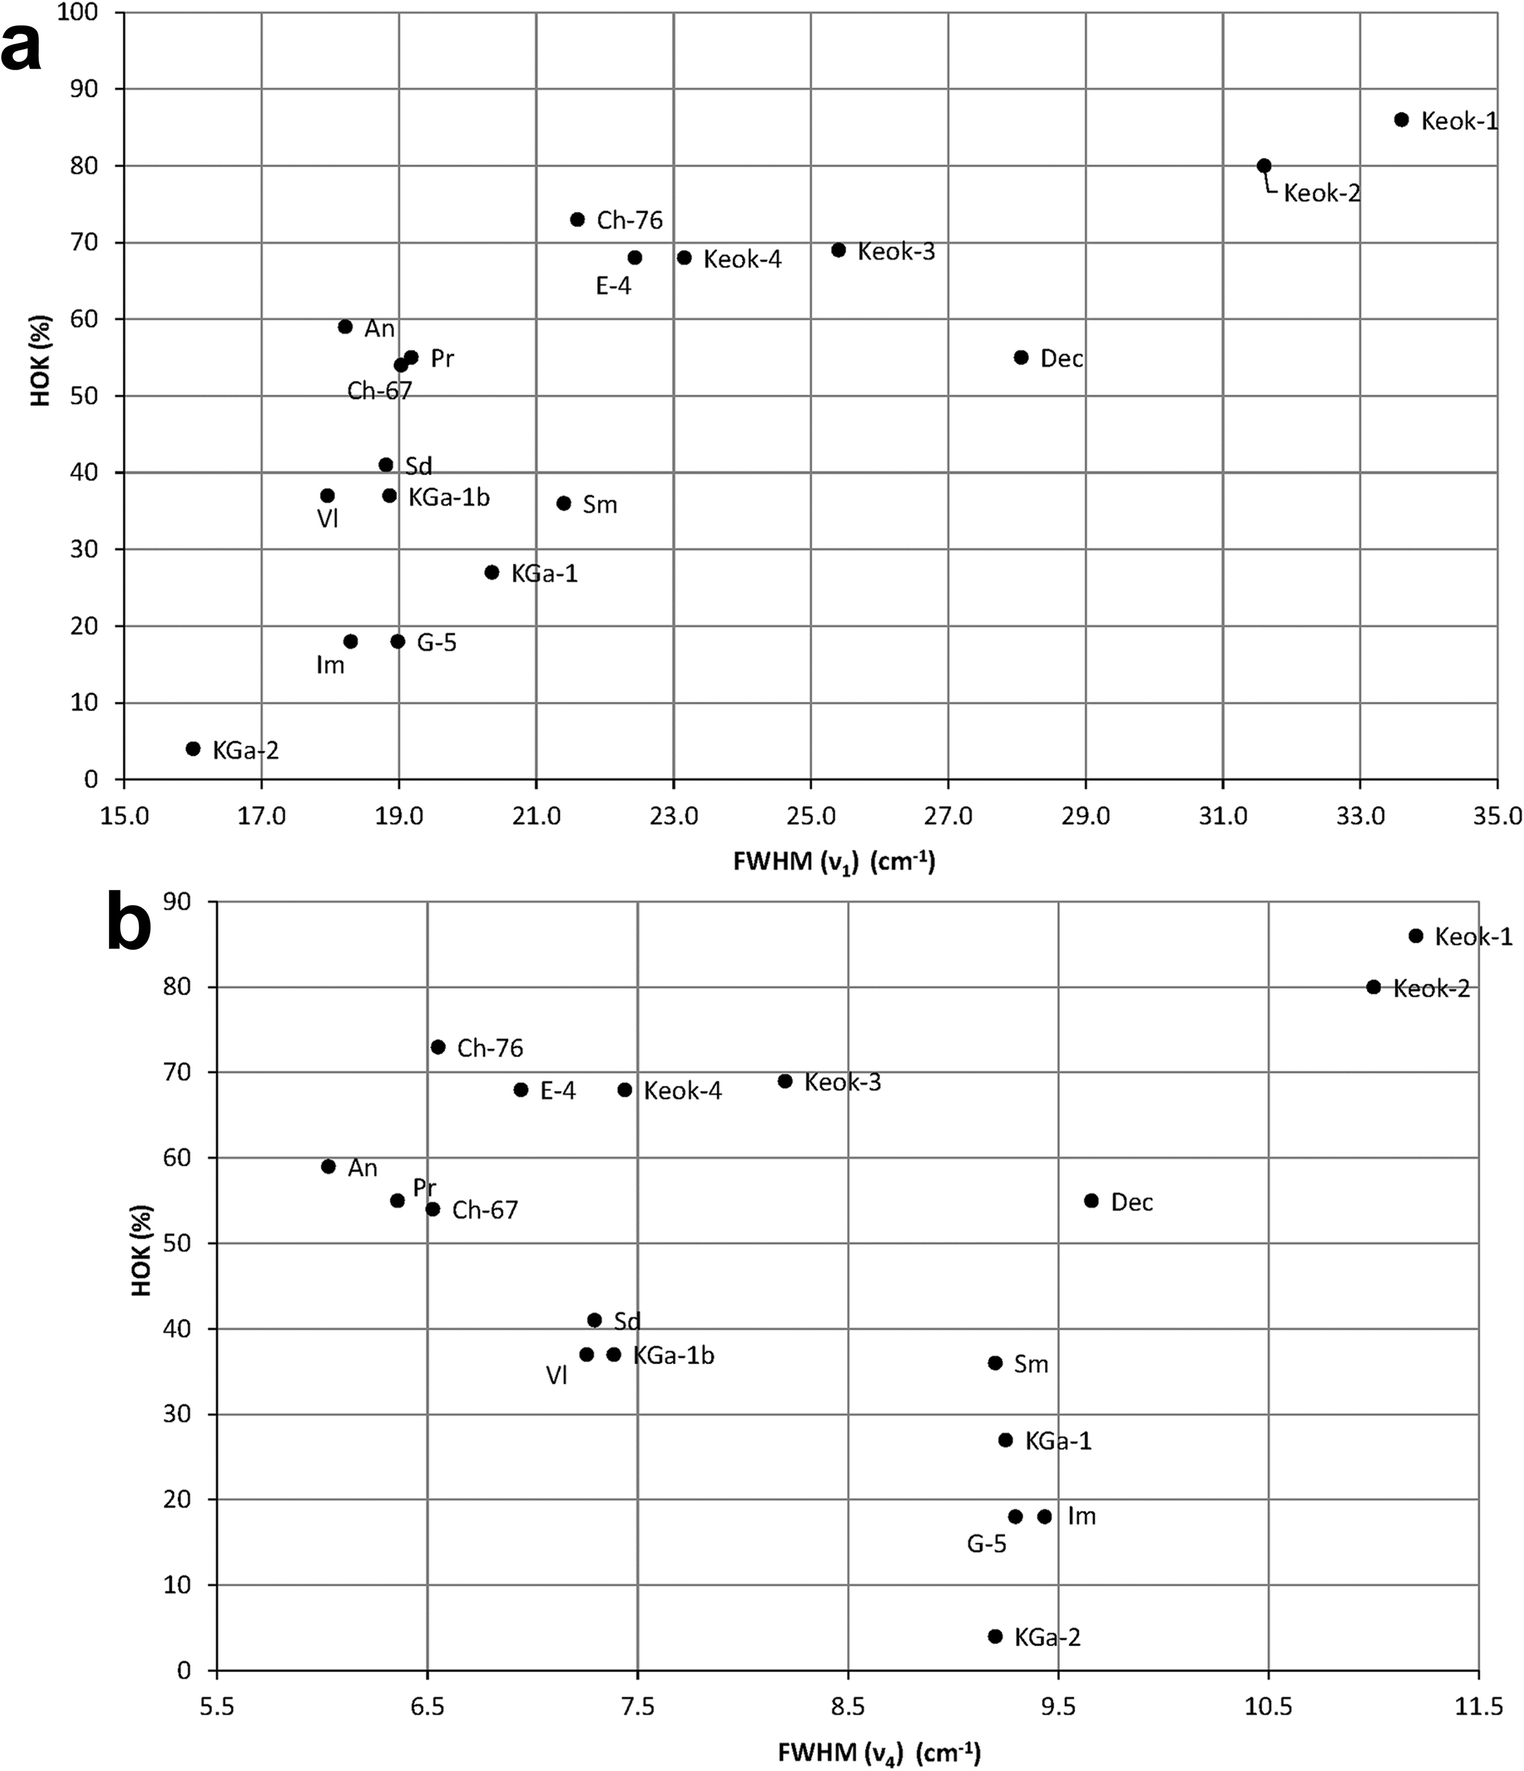
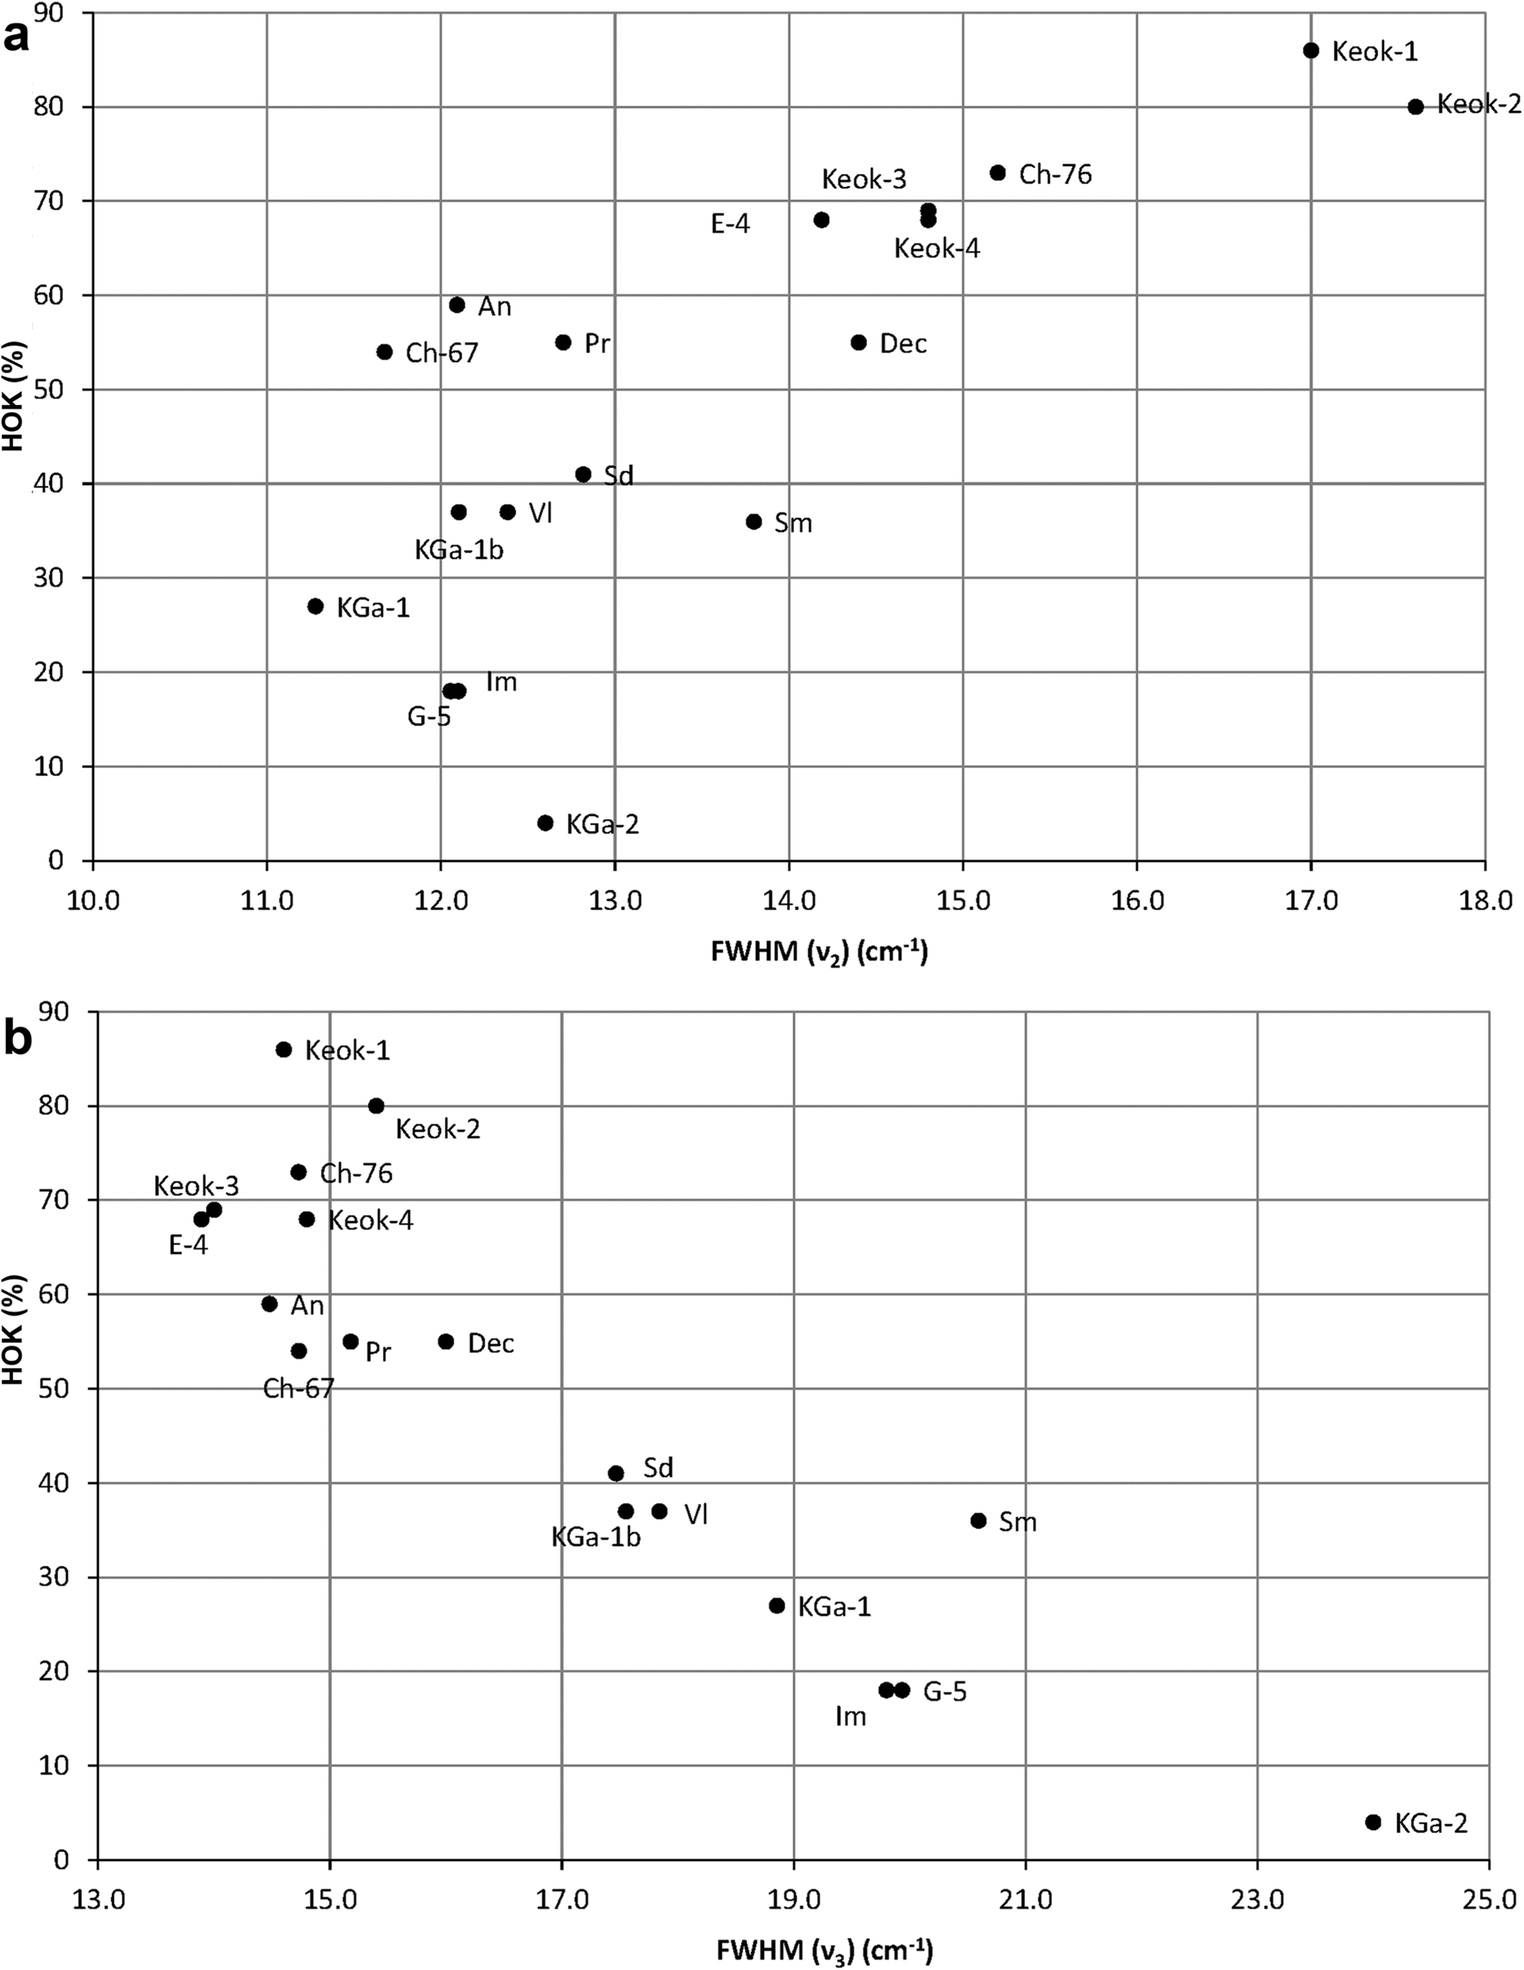
At first glance, the distributions of the FWHM values for the OH-stretching bands ν 1, ν 4, ν 2, and ν 3 show little, if any, correlation with the HOK contents (Figs. 5a, b and 6a, b). In particular, the ν 4 bands of samples G-5, Im, KGa-1, Sm, Dec, and KGa-2 have similar FWHM values, whereas the HOK relative amount vary from 4 to 55% (Fig. 5b, Table 2). At the same time, fairly different FWHM values are observed for several samples having the same HOK content (Table 2). The FWHM values are scattered more or less uniformly (for ν 2, ν 4 bands, Figs. 6a and 5b), or segregated (for ν 1, ν 3 bands Figs. 5a and 6b). Finally, the observed data are difficult to interpret because the variation ranges of the FWHM values differ significantly for different bands (~6–11 cm–1 for ν 4; 16–33.6 cm–1 for ν 1; ~11–18 cm–1 for ν 2; and ~14–24 cm–1 for ν 3). A more careful analysis reveals, however, certain significant regularities.
The HOK contents plotted vs FWHM values for the OH-stretching a ν 1 and b ν 4 bands

The HOK contents plotted vs FWHM values for the OH-stretching a ν 2 and b ν 3 bands

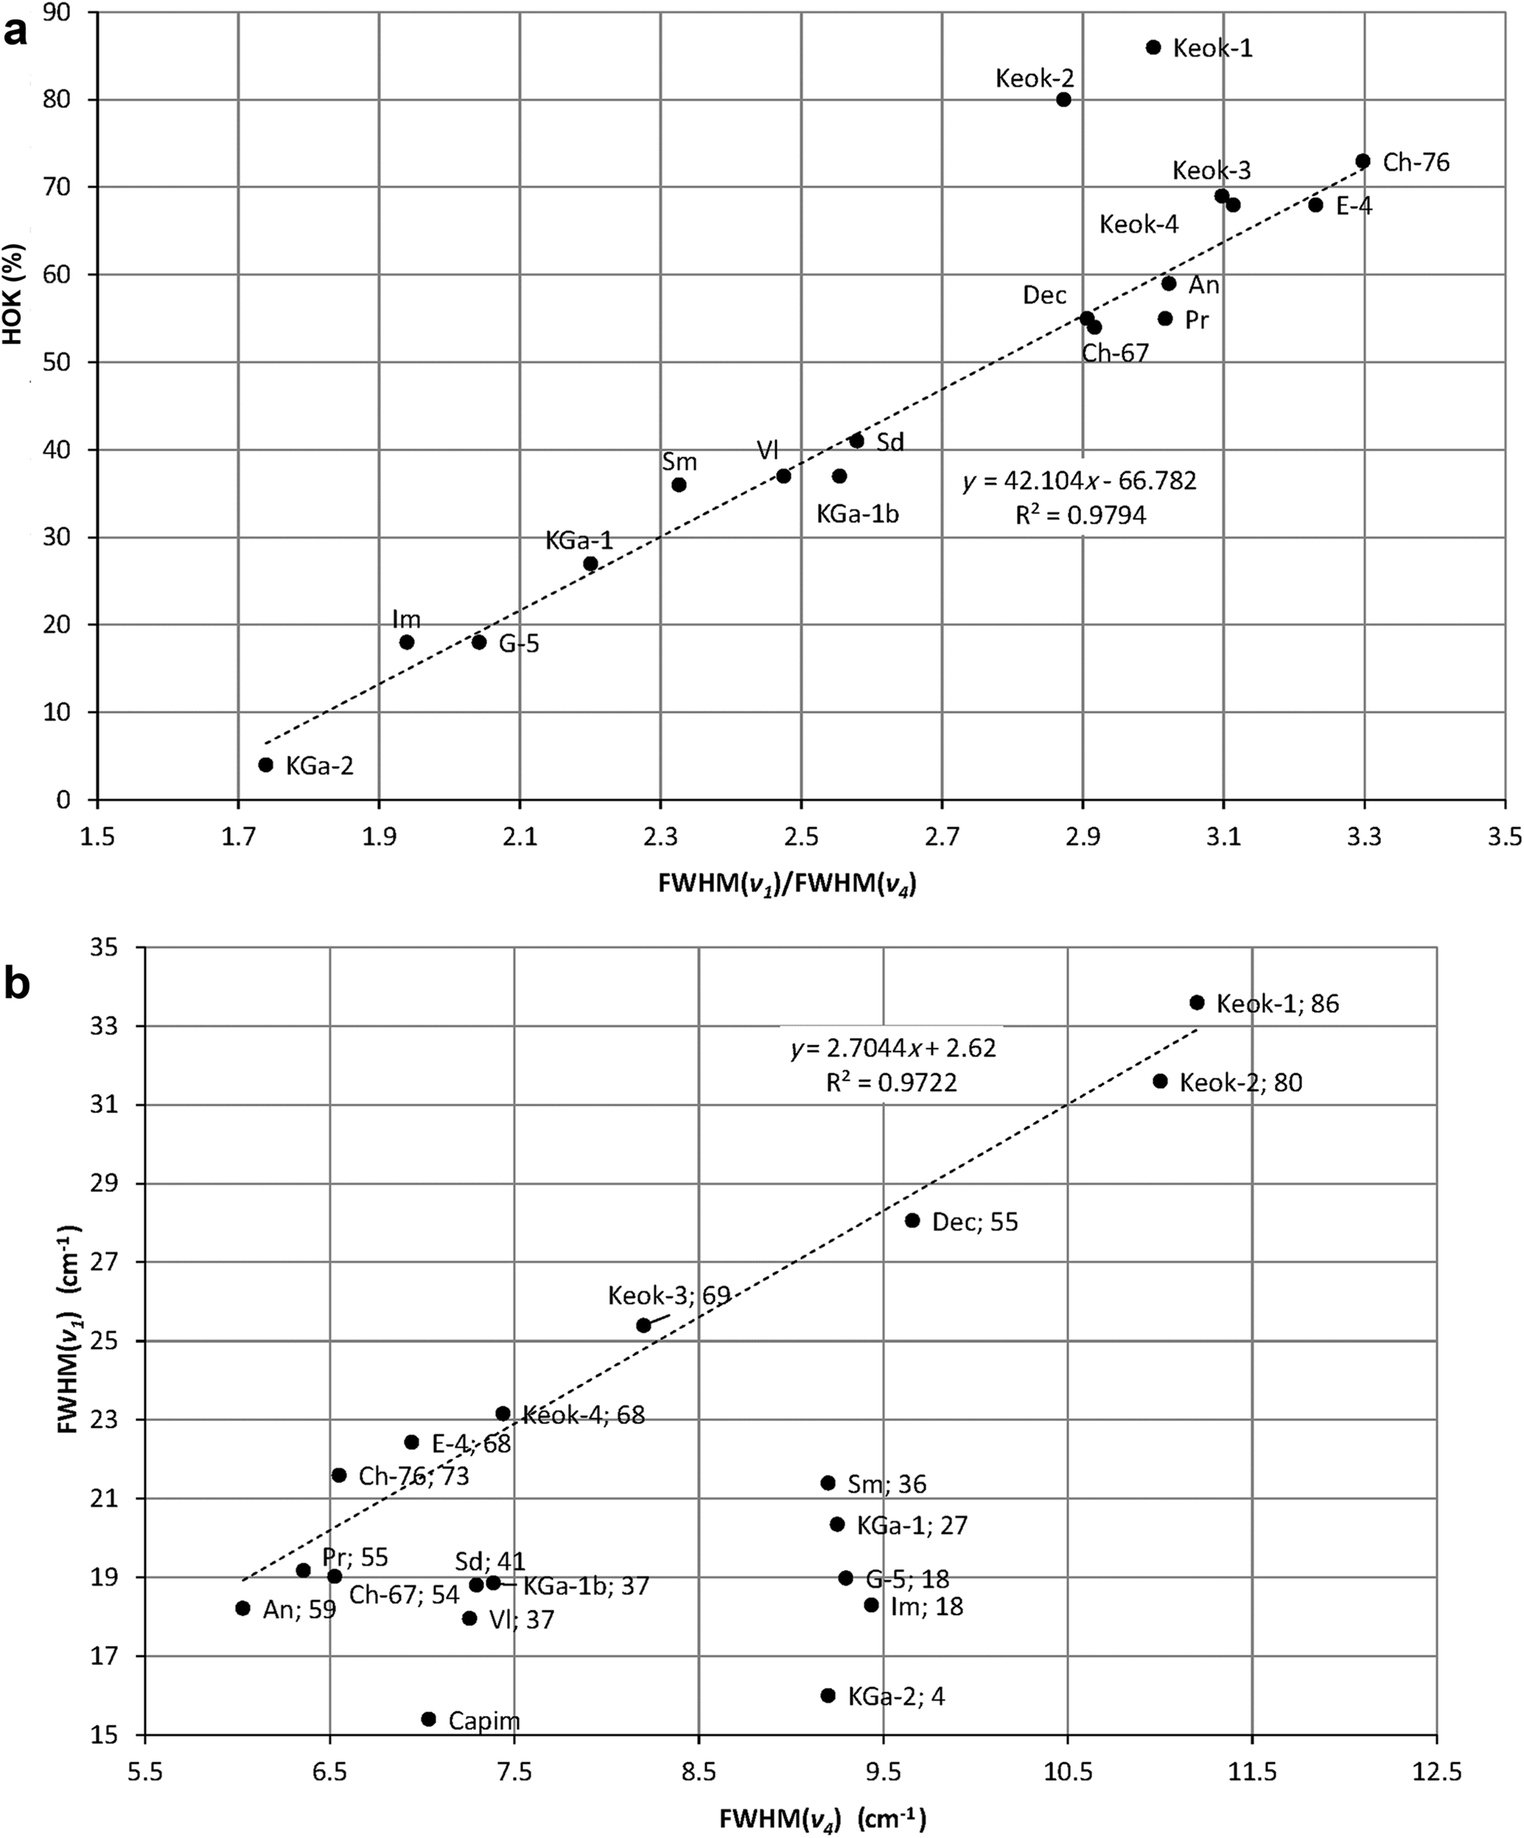
For samples with HOK ≥ 50%, the FWHM values for both ν 1 and ν 4 bands tend to decrease with decreasing HOK contents from Keok-1 to An (Fig. 5a, b). At the same time, some of the samples differing in the FWHM values have similar or nearly identical HOK contents. In particular, samples Ch-67 and Dec with the HOK contents of ~54–55% differ in the FWHM values for the ν 1 and ν 4 bands: 19.03 vs 28.06 cm–1 and 6.53 vs 9.66 cm–1, respectively. The ratios FWHM(ν 1)/FWHM(ν 4) are, however, nearly identical (2.916 for Ch-67 and 2.906 for Dec).
The samples with an HOK content of <50% show similar regularities. For example, samples V1 and Sm with the HOK contents of 37% and 36%, respectively, differ in terms of the FWHM values for the ν 1 and ν 4 bands: 17.96 vs 21.40 cm–1 and 7.26 vs 9.20 cm–1, respectively (Fig. 5a, b). At the same time, the FWHM(ν 1)/FWHM(ν 4) ratios are similar (2.48 and 2.33 for samples VI and Sm, respectively).
The above correlations suggest that the FWHM(ν 1)/FWHM(ν 4) values should be proportional to the HOK contents in the kaolinite samples. Indeed, the observed FWHM(ν 1)/FWHM(ν 4) ratios are related to the HOK contents by a linear equation (Fig. 7a):

a The HOK contents plotted vs FWHM(ν 1)/FWHM(ν 4); b FWHM(ν 1), plotted vs FWHM(ν 4)

The points for samples Keok-1 and Keok-2 deviate substantially from the regression line, probably because of the extra broadening of ν 4 bands (Table 2) .
Analysis of the interdependence between the FWHM(ν 1) and FWHM(ν 4) values (Fig. 7b) provides insight into the factors responsible for the linear relationship between the HOK content and the FWHM(ν 1)/FWHM(ν 4) ratio. A linear relationship described by the regression:

is valid only for the samples with the amounts of the HOK phase ≥50%.
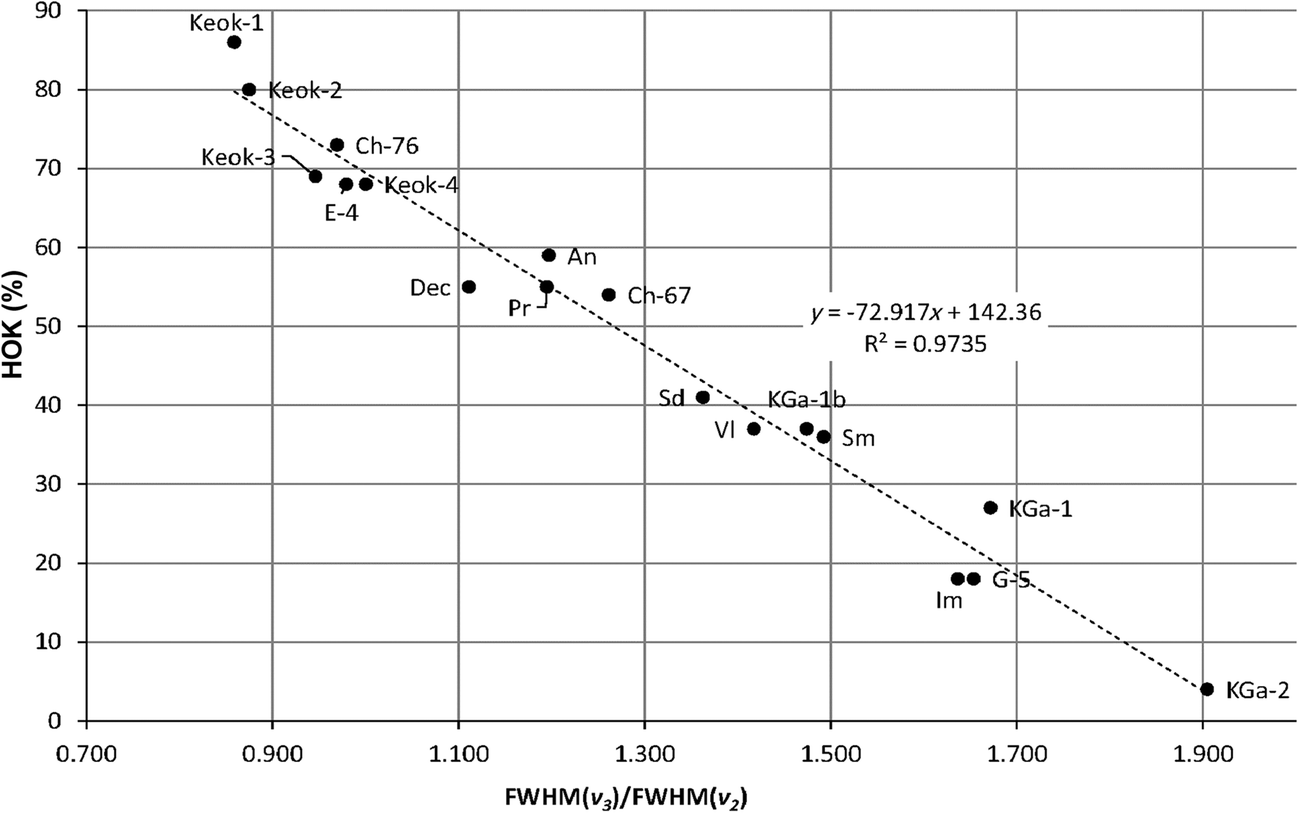
For these samples, the FWHM values of the ν1 and ν4 bands tend to decrease with decreasing crystallite size (Table 2, Fig. 7b). In particular, the lowest FWHM (ν1) and FWHM(ν4) values are observed for groups 2 and 3 samples having HOK ≥ 50% (Fig. 7b). Thus, in general, the FWHM values for the ν1 and ν4 bands for the samples with HOK ≥ 50% vary in accordance with the size of the crystallites composing the samples. The HOK phase content, therefore, controls the relationships between the FWHM values of ν1 and ν4 bands. That is why the samples having the same HOK value may have different FWHM values for the ν 1 and ν 4 bands, but the same or similar FWHM(ν 1)/FWHM(ν 4) ratios. Application of the above approach to the description of the relationships between the HOK contents and the FWHM(ν3)/FWHM(ν2) ratios shows these values should also be related by a linear dependence (Fig. 8):

The HOK contents plotted vs the FWHM(ν 3)/FWHM(ν 2) ratios

(see Supplementary Material 1, section IV).
Possible interpretation for the observed regularities.
At first glance, the interrelationships between the FWHM (ν1) and FWHM(ν4) values may seem unexpected. Indeed, the inner-surface OH groups form angles of ~60–70° with the (001) plane, whereas the inner OH stretching vibration is almost parallel to the layers (Bish Reference Bish1993). Both the ν 1 and ν 4 bands are very likely to correspond to in-phase stretching vibrations. Similarly, the regularities in the distribution of the FWHM (ν3) and FWHM(ν2) values leading to the linear relationships between the HOK contents and the FWHM ratios may be related to the out-of-phase character of the ν 3 and ν 2 OH vibrations.
An important feature common to ν 1, ν 4 and ν 3, ν 2 pairs of OH bands is that the samples having different FWHM values and particle size but similar or identical FWHM ratios for the corresponding pair of OH bands have similar HOK contents. For example, for samples V1 (group 1) and Sm (group 2), the FWHM (ν1) and FWHM (ν4) values are 17.96, 7.26 cm–1 and 21.40, 9.20 cm–1, respectively (Table 2). The corresponding ratios (2.48 and 2.33) and HOK contents (37 and 36%) are, however, similar (Table 2). The general conclusion is, thus, that in each sample, the HOK content defines the ratio of the FWHM values for the OH bands in question irrespective of its particle size. This explains why the regularities observed for the ν 1, ν 4 and ν 3, ν 2 pairs of OH bands are not observed for the ν 1, ν 2 and ν 3, ν 4 and other possible pairs of OH bands. In each of these pairs, in-phase stretching vibrations would be combined with out-of-phase vibrations. As a result, samples having different FWHM values but similar or identical FWHM ratios for the corresponding pair of OH bands will only have the same or similar HOK contents if the samples have similar particle size. Otherwise, two different FWHM ratios will appear for the same HOK content, and the linear relationship between the FWHM ratios and HOK contents will be violated. To illustrate, consider the FWHM ratios for the ν 1, ν 2 and ν 3, ν 4 OH bands. As expected, in both cases the FWHM(ν 1)/FWHM(ν 2) and FWHM(ν 4)/FWHM(ν 3) values are similar or even identical only for samples having similar crystallite sizes. In particular, similar FWHM (ν 1)/FWHM(ν 2) values (1.51, 1.51, and 1.63, respectively) were observed for the fine-particle samples An, Pr, and CH-67 having similar HOK contents (54–59%, Table 2). The FWHM(ν 1)/ FWHM(ν 2) value (1.948) for the coarse-particle sample Dec (HOK = 55%), however, differs dramatically from those for the above fine-particle samples. In addition, samples Keok-3 and Ch-76 have similar HOK values (69 and 73%, respectively) but different particle sizes and, as a result, substantially different FWHM(ν 1)/FWHM(ν 2) values (1.72 and 1.42, respectively, Table 2). A similar particle-size effect is observed in the case of FWHM(ν 1)/ FWHM(ν 3) values. Special investigation is needed to develop a potential technique for estimating kaolinite crystallite size based on thorough analysis of the ν1, ν2, ν3, and ν4 OH band profiles.
Relationships between the HOK Contents and the Integrated Intensities of the OH-stretching Bands
The ν1 and ν4 bands.
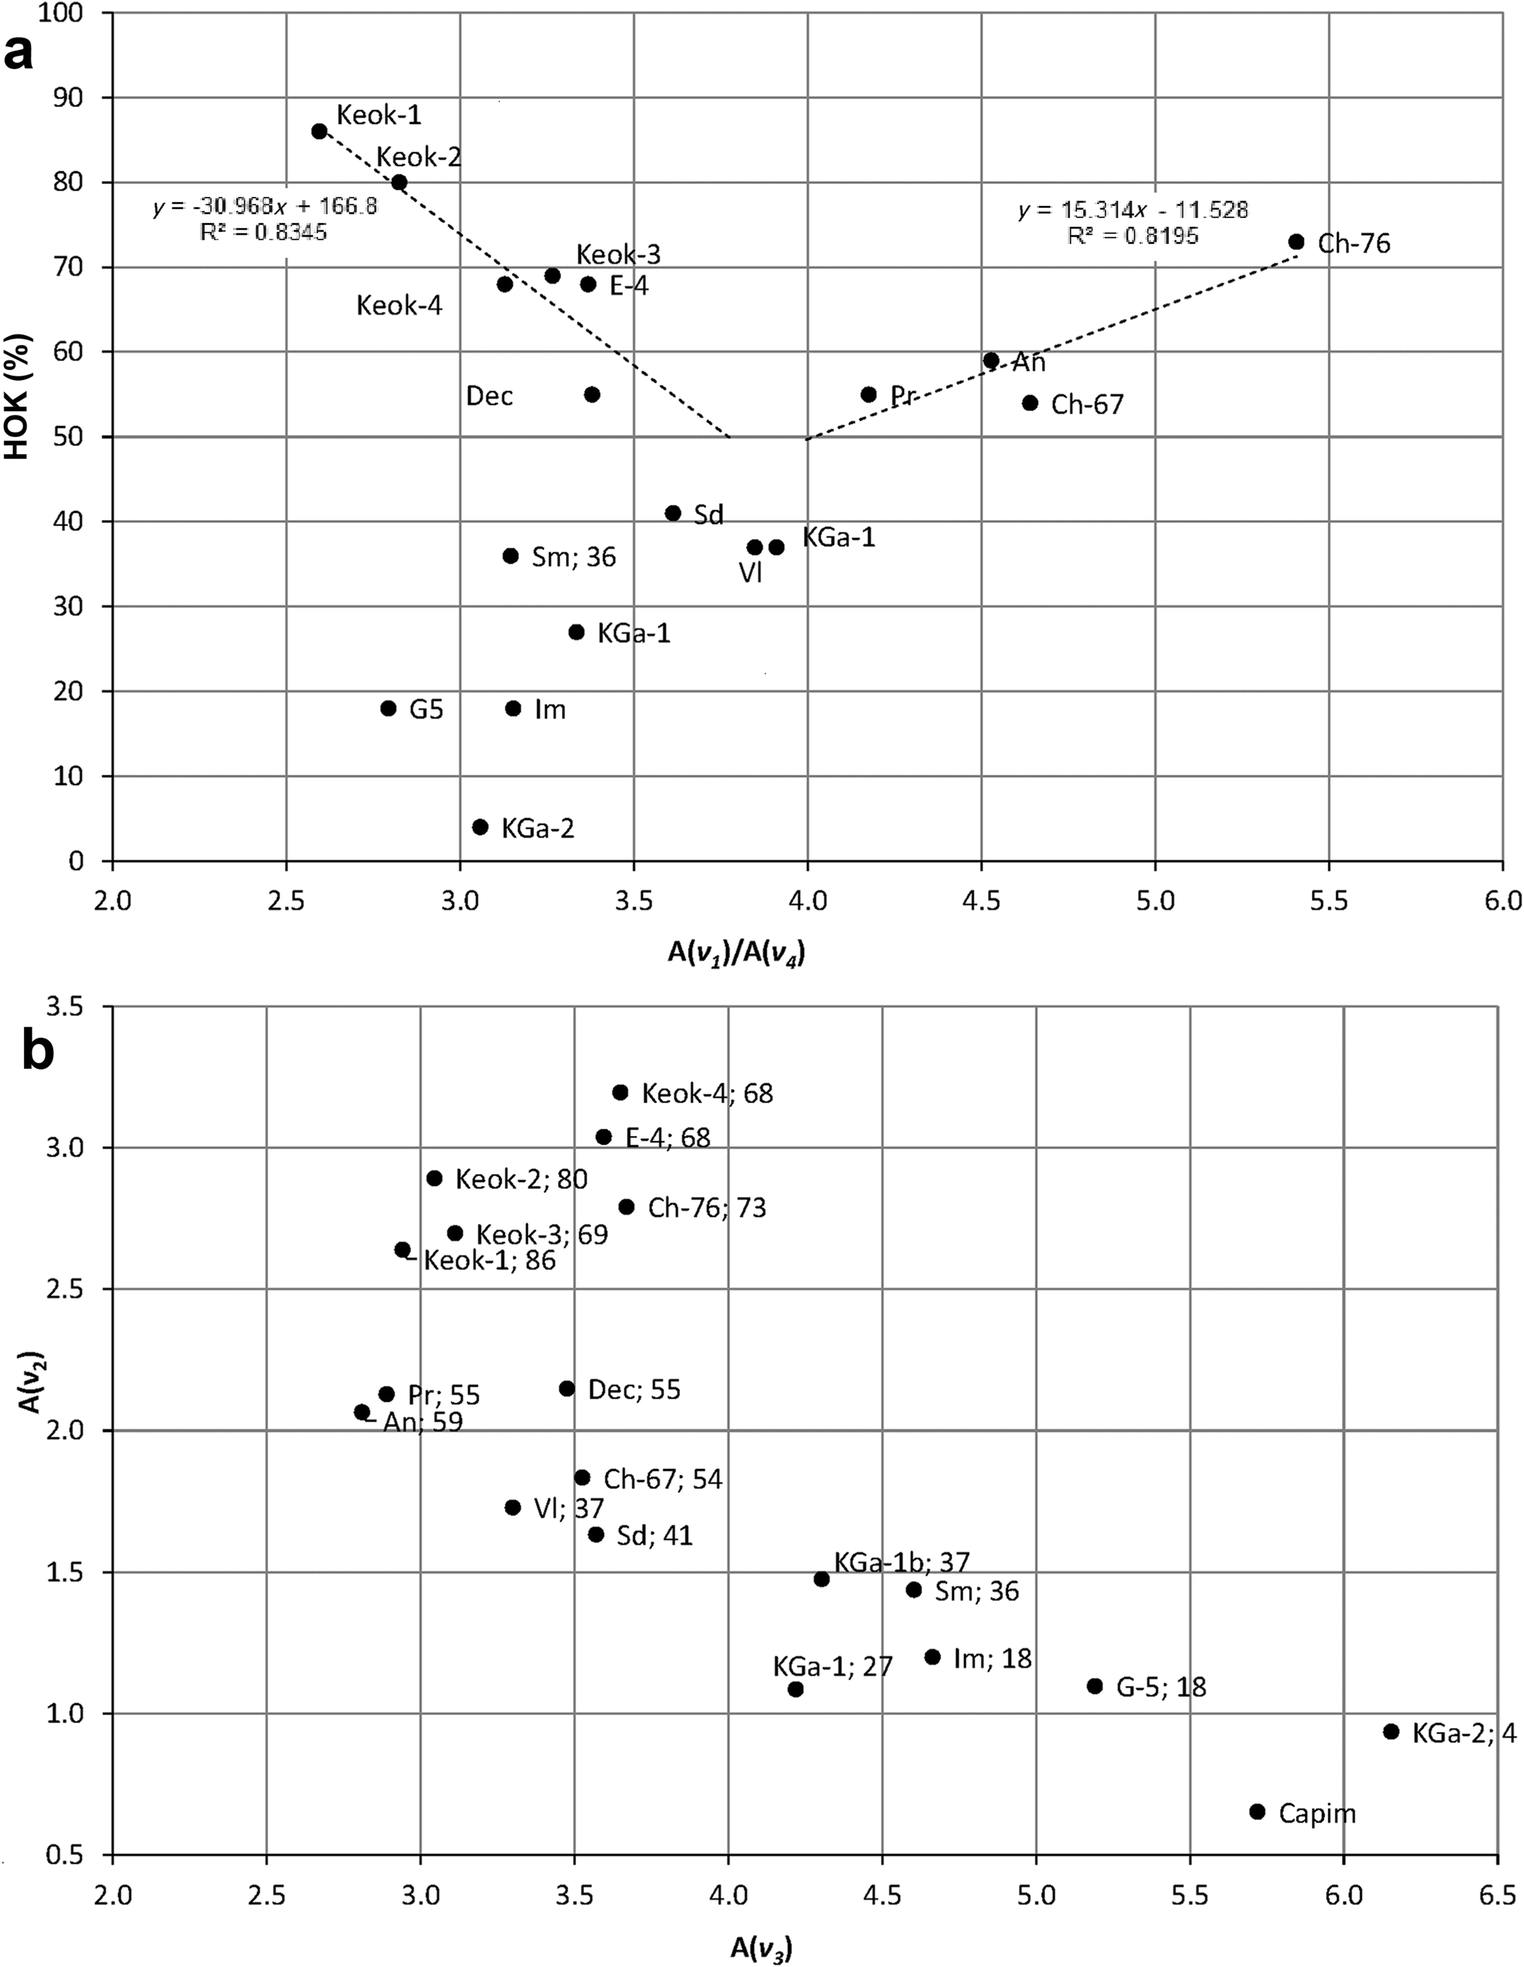
For samples with HOK ≥ 50%, the evolution of the ratios of the ν1 and ν4 integrated intensities is characterized by two different trends (Fig. 9a). For group 1 samples consisting of relatively coarse crystallites (Table 2), a decrease in the HOK contents is accompanied by an increase in the A(ν 1)/A(ν 4) ratios. A decrease in the HOK contents in these samples may be accompanied by the formation of thinner crystallites leading to greater absorbance of the ν1 OH-band. For groups 2 and 3 samples (Ch-76, An, Pr, Ch-67) consisting of relatively fine crystallites (Table 2), a decrease in the HOK contents is accompanied by an almost linear decrease in the A(ν 1)/A(ν 4) ratios (Fig. 9a). This relationship contradicts the IR rule, according to which fine particles absorb IR radiation more efficiently than coarse particles (Farmer Reference Farmer1998). Special investigation is required, therefore, to reveal the nature of the relations between the A(ν 1)/A(ν 4) ratios and the HOK contents observed for the samples from groups 2 and 3. According to preliminary results, the observed decrease in the A(ν 1)/A(ν 4) ratios for the fine-particle samples is associated with the structural heterogeneity of their LOK phases. Random interstratification of the t 01 and t 02 translations of identical kaolinite layers should lead to formation of layer sub-sequences t 01 t 02 t 01 ; t 01 t 02 t 01 t 02 t 01 ; t 01 t 02 t 01 t 02 t 01 t 02 t 01 , etc., which correspond to fragments of the 2M monoclinic structure of prismatic halloysite, in which layer pairs are related by a c-glide plane (Chukhrov and Zvyagin Reference Chukhrov, Zvyagin, Heller and Weiss1966, Zvyagin Reference Zvyagin1967; Drits et al. Reference Drits, Sakharov and Hiller2018). The 2M fragments may have different thicknesses and should be distributed at random along the c* axis within the particles making up the LOK phases. Obviously, the stretching vibrations of inner-surface OH groups in such fragments of the LOK phases should differ from those coupled to give the in-phase ν 1 absorption bands in defect-free kaolinite. As a result, the A(ν 1)/A(ν 4) ratios decrease with decreasing HOK contents in groups 2 and 3 samples. The problem is that the described effects depend on various factors, such as the HOK/LOK ratio, particle thickness in the LOK phases, proportions of the t 01 and t 02 translations, and the pattern in their interstratification. For example, in agreement with the generally accepted IR rule, samples Ch 76 and Keok-3 having similar HOK contents (73 and 69%, respectively) but contrasting particle sizes differ substantially in the A(ν 1)/A(ν 4) ratios (5.40 and 3.26, respectively, Table 2). In contrast, the fine-particle samples Ch-76, Ch-67, Pr and An with larger amounts of the LOK phases, which differ in the number of layers per particle (Table S2), have, as a result, unexpected values for the A(ν 1)/A(ν 4) ratios.
a The HOK contents plotted vs the A(ν 1)/A(ν 4) ratios; b A(ν 2) plotted vs A(ν 3)

For the samples with HOK < 50%, the A(ν 1)/A(ν 4) ratios are distributed mostly within the range observed for coarse-particle samples having HOK ≥ 50% with a tendency to decrease with decreasing HOK contents (Fig. 9a). Decreasing the HOK content decreases the ν 1 band intensity concomitantly within groups 2 and 3 samples from Ch-76 (~27) to KGa-1b (~19) and increases it within group 1 from Keok-1 (~13) to Sd (~18) (Table 2).
The ν2 and ν3 bands.
A remarkable feature in the mutual distribution of the A(ν 3) and A(ν 2) values is that they have different sensitivity to variations in structural order (Fig. 9b). For the samples with HOK ≥ 50%, the intensities of the ν2 bands vary within a wider range (from 1.8 to 3.2) than those of the ν3 bands (2.8–3.7). Moreover, the A(ν 2) values decrease consistently in the group of samples Keok-4, E-4, Ch-76, Dec, and Ch-67, whereas the A(ν 3) values remain nearly constant. A similar effect is observed for samples Keok-2, Keok-3, Keok-1, Pr, and An, which consist of crystallites of contrasting sizes (Fig. 9b). In contrast, for samples having HOK < 50%, the ν2 band integrated intensities vary within a narrower range (~0.9–1.7 cm–1) as compared to the A(ν 3) values (~3.3–6.2 cm–1) (Fig. 9b).
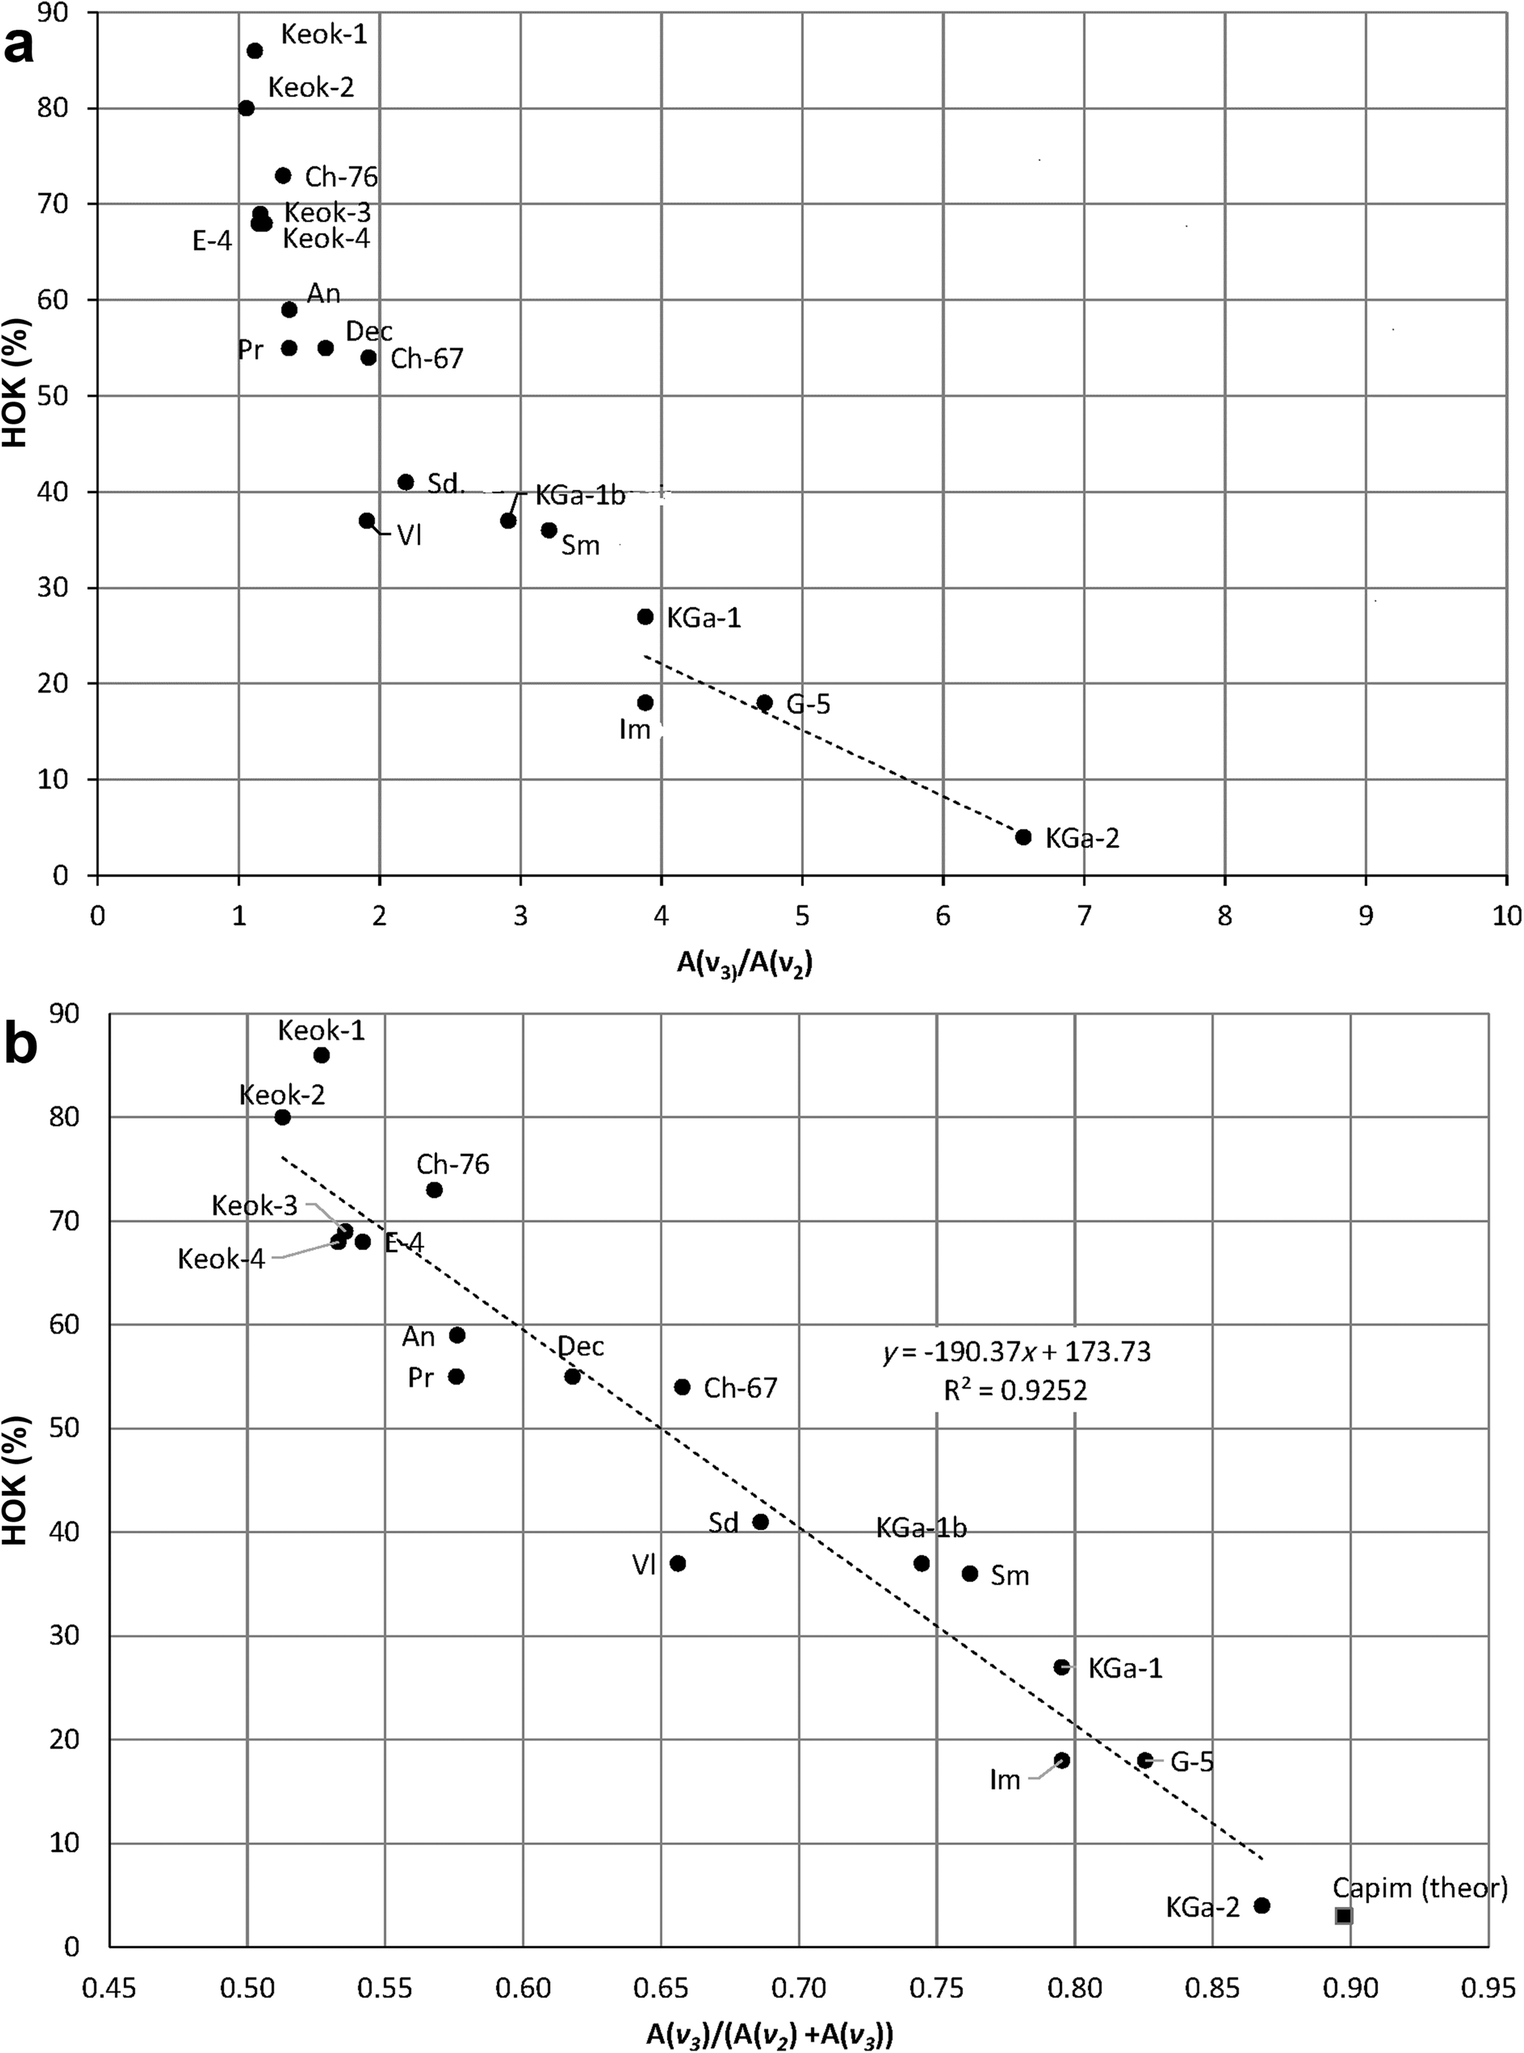
To reveal the nature of these peculiar regularities, consider the relationships between the HOK contents and A(ν3)/A(ν2) ratios (Fig. 10a). For samples with HOK ≥ 50%, most of which belong to group 1 (Table 2), the A(ν 3)/A(ν 2) values have relatively low sensitivity to variations in the HOK contents and vary from 1.05 (sample Keok-2) to 1.92 (sample Ch-67). In contrast, for the low-ordered samples, the A(ν 3)/A(ν 2) ratios increase from 1.9 to 6.6 with HOK values decreasing from 41% (sample Sd) to 4% (sample KGa-2) (Fig. 10a). Thus, for any HOK < 50%, A(ν 3) > A(ν 2). In contrast, for samples with the highest HOK contents in group 1, the A(ν3)/A(ν2)values are only slightly greater than 1.0 (Fig. 10a). In particular, the A(ν3)/A(ν2)values for the samples with the greatest HOK contents are 1.05 (Keok-2) and 1.11 (Keok-1). These values suggest that in a mono-mineralic, defect-free triclinic kaolinite structure, the proportion of A(ν 3) with respect to the total integrated intensity of the ν 3 and ν 2 bands, A(ν 3)/(A(ν 2) + A(ν 3)) (Table 2) should be close to 0.50. The relationship between the HOK content and the A(ν 3)/(A(ν 2) + A(ν 3)) ratios, which is equal to r/(r+1), where r = A(ν 3)/A(ν 2), is described by the regression equation:

The HOK contents plotted vs a the A(ν 3)/A(ν 2) ratios and b the A(ν 3)/(A(ν 2) + A(ν 3)) values

(R2= 0.925, Fig. 10b).
The greater the HOK content, therefore, the closer the A(ν 3)/(A(ν 2) + A(ν 3)) value is to 0.50. The samples involved in the regression vary in particle size and in terms of the degree of structural disorder, so that significant deviations from the regression are observed for groups 2 and 3 samples with HOK > 50%, as well as for the samples with LOK < 50% having different particle sizes. According to this relationship, the amount of the HOK phase in sample Capim (not determined) should be similar to that in sample KGa-2 (Table 2, Fig. 10b).
The crystallites in any kaolinite sample, irrespective of the HOK content, contribute, therefore, to the intensities of both the ν3 and ν2 bands. The individual contributions to the ν3 and ν2 band intensities depend, however, on the sample structural order and particle size. At the same time, the total intensities of the ν3 and ν2 bands in the studied samples vary within a rather narrow range (5.80±0.67), which is within 15% (Table 2). Moreover, the A(ν 2) + A(ν 3) values for the high-ordered samples Keok-1, Keok-3, and Dec (5.58, 5.81, and 5.62, respectively) are similar to those for the low-ordered samples KGa-1b (5.78) and Sm (6.04). The same is true for samples Pr and Ch-67 (HOK > 50%, A(ν 2) + A(ν 3) = 5.02 and 5.36, respectively) and samples Sd, VI, and KGa-1 (HOK < 50%, A(ν 2) + A(ν 3) = 5.20, 5.03, and 5.3, respectively) (Table 2). These peculiarities, on the one hand, justify the application of the normalization procedure and, on the other, provide a new insight into the relationships between the HOK contents and the A(ν3) and A(ν2) values (Fig. 10a, b). Indeed, a remarkable feature of the IR spectra of the studied samples, which can be observed even visually (Fig. 4; Fig. S3), is that the intensities of the ν2 and ν3 bands tend to decrease and increase, respectively, with decreasing structural order (Table 2), leading to similar values of the total integrated intensity of the ν3 and ν2 bands. Qualitatively, these results are in agreement with the observations of Beauvais and Bertaux (Reference Beauvais and Bertaux2002) that the A(ν 2)/A(ν 3) values in the IR microspectra of kaolinites increased with increasing structural order, although the criteria used for evaluating the degree of structural order were questionable.
To interpret the regularities described, insight is required into the nature of the stretching vibrations of the inner-surface hydroxyls that are coupled to provide the ν3 and ν2 vibrations in a kaolinite sample with the given HOK content. For both macroscopic and thin platy crystals, Farmer (Reference Farmer1998) pointed out that all unit cells vibrate in phase. In macroscopic crystals, only transverse (TO) crystal vibration modes (i.e. those having the oscillating dipole moment (transition moment) normal to the wave vector) are IR active, while the longitudinal (LO) modes having the transition moment parallel to the wave vector are not. In contrast, for thin platy crystals, such as kaolinite, where the thickness of the plates is much smaller than the wavelength of the exciting radiation, vibrations with the transition moment perpendicular to the layers occur at their LO frequencies, because the dipoles experience fields arising from surface charges induced on the plates, whereas vibrations parallel to the plates exhibit their TO frequencies (Farmer Reference Farmer1998, Reference Farmer2000). Farmer (Reference Farmer1998, Reference Farmer2000) suggested that the stretching vibrations of the (OH)3, (OH)2, and (OH)4 hydroxyls (numbered as by Bish Reference Bish1993) couple to provide a strong in-phase vibration at ~3697 cm–1 (ν1) with a transition moment nearly perpendicular to the (001) plane, and two anti-phase vibrations at ~3652 cm–1 (ν3) and ~3670 (ν2) with transition moments lying in the (001) plane. This model assumed that the kaolinite structure had no symmetry elements except translations and should, therefore, be modified in agreement with the presence of a mirror plane in the kaolinite layers (Fig. 11), which, in the defect-free kaolinite structure, are shifted with respect to each other by the same (either t 01 or t 02 ) translation leading to the triclinic symmetry of the kaolinite unit cell.
Scheme of the phase relationships in the coupled inner-surface-OH stretching vibrations producing absorption bands ν 1, ν 2, and ν 3. Symbols: open circles - inner-surface OH groups numbered as by Bish (Reference Bish1993); black circles – Al cations; squares – octahedral vacancies. For band ν 1, the “+” signs refer to in-phase vibrations with transition moment normal to the layer plane; for bands ν 2 and ν 3, open triangles having the same and opposite orientations refer to the in-phase and out-of-phase vibrations, respectively, with the transition moment parallel to the layer plane

In terms of the actual kaolinite layer symmetry, in the ν3 configuration, the (OH)2 and (OH)3 hydroxyls related by the mirror plane should vibrate in phase with each other and in anti-phase with the (OH)4 hydroxyl (Fig. 11). At the same time, although the positions of the (OH)3 and (OH)2 groups are in agreement with the layer symmetry, the anti-phase stretching vibrations of the (OH)2 and (OH)3 hydroxyls, which provide the ν2 bands (Fig. 11), are inconsistent with the layer mirror plane. In agreement with the experimental results, the triclinic symmetry of the defect-free kaolinite structure allows the formation of the ν2 and ν3 absorption bands with similar probability, as in the case of samples Keok-1–Keok-4 (Fig. 10a, Table 2). In contrast, in a highly disordered structure, where the t 01 and t 02 layer translations are interstratified at random, the intensities of these bands are controlled by the symmetry of the individual layer. The intensities of the ν3 absorption bands should dominate over those of the ν2 bands because the number of ν2 configurations of the OH-stretching vibrations should decrease with decreasing HOK contents and increasing influence of the layer unit-cell symmetry, while the number of the ν3 configurations should increase accordingly (Fig. 11). This is in agreement with the intensities of the ν2 and ν3 bands observed in the FTIR spectrum of sample KGa-2 (HOK = 4%, Table 2). In kaolinite samples having intermediate structural disorder, the intensity distribution in the FTIR spectrum should depend on the proportion of the coexisting HOK and LOK phases. Even for samples with HOK ≥ 50%, therefore, an increase in the relative amount of the LOK phase should be accompanied by a relative decrease in the ν2 band intensity with respect to that of the ν3 band. The reason is that the LOK phase contributes mostly to the intensity of the ν3 band due to the replacement of the ν2 configurations by the ν3 configurations (Fig. 11). This interpretation explains why the A(ν 2) + A(ν 3) values for the high-ordered samples are similar to those for the low-ordered samples. The decrease in the ν2 band intensity is more pronounced for the samples with HOK < 50% because the prevailing layer symmetry control enhances the ν3 configurations. A demonstrative example of the influence of the degree of structural order on the intensity distribution in the OH-stretching region of kaolinites can be found in the work of Brindley et al. (Reference Brindley, Kao, Harrison, Lipsicas and Raythatha1986), who observed a consistent decrease in the ν2 band intensity and simultaneous increase in that of ν3 with decreasing degree of order, so that the ν2 band was completely absent from the spectrum of the most disordered sample, PUGU (Brindley et al. Reference Brindley, Kao, Harrison, Lipsicas and Raythatha1986). Further validation of this interpretation of the evolution of the relative integrated intensities of the ν 2 and ν 3 bands could be provided by quantum-mechanical calculations, which was beyond the scope of the present study, however.
To summarize, a kaolinite FTIR spectrum is the result of the statistically weighted sum of the contributions from the coexisting high- and low-ordered structures, which reflects the competition between the unit-cell triclinic symmetry and the mirror symmetry of the layer, respectively.
Band Positions
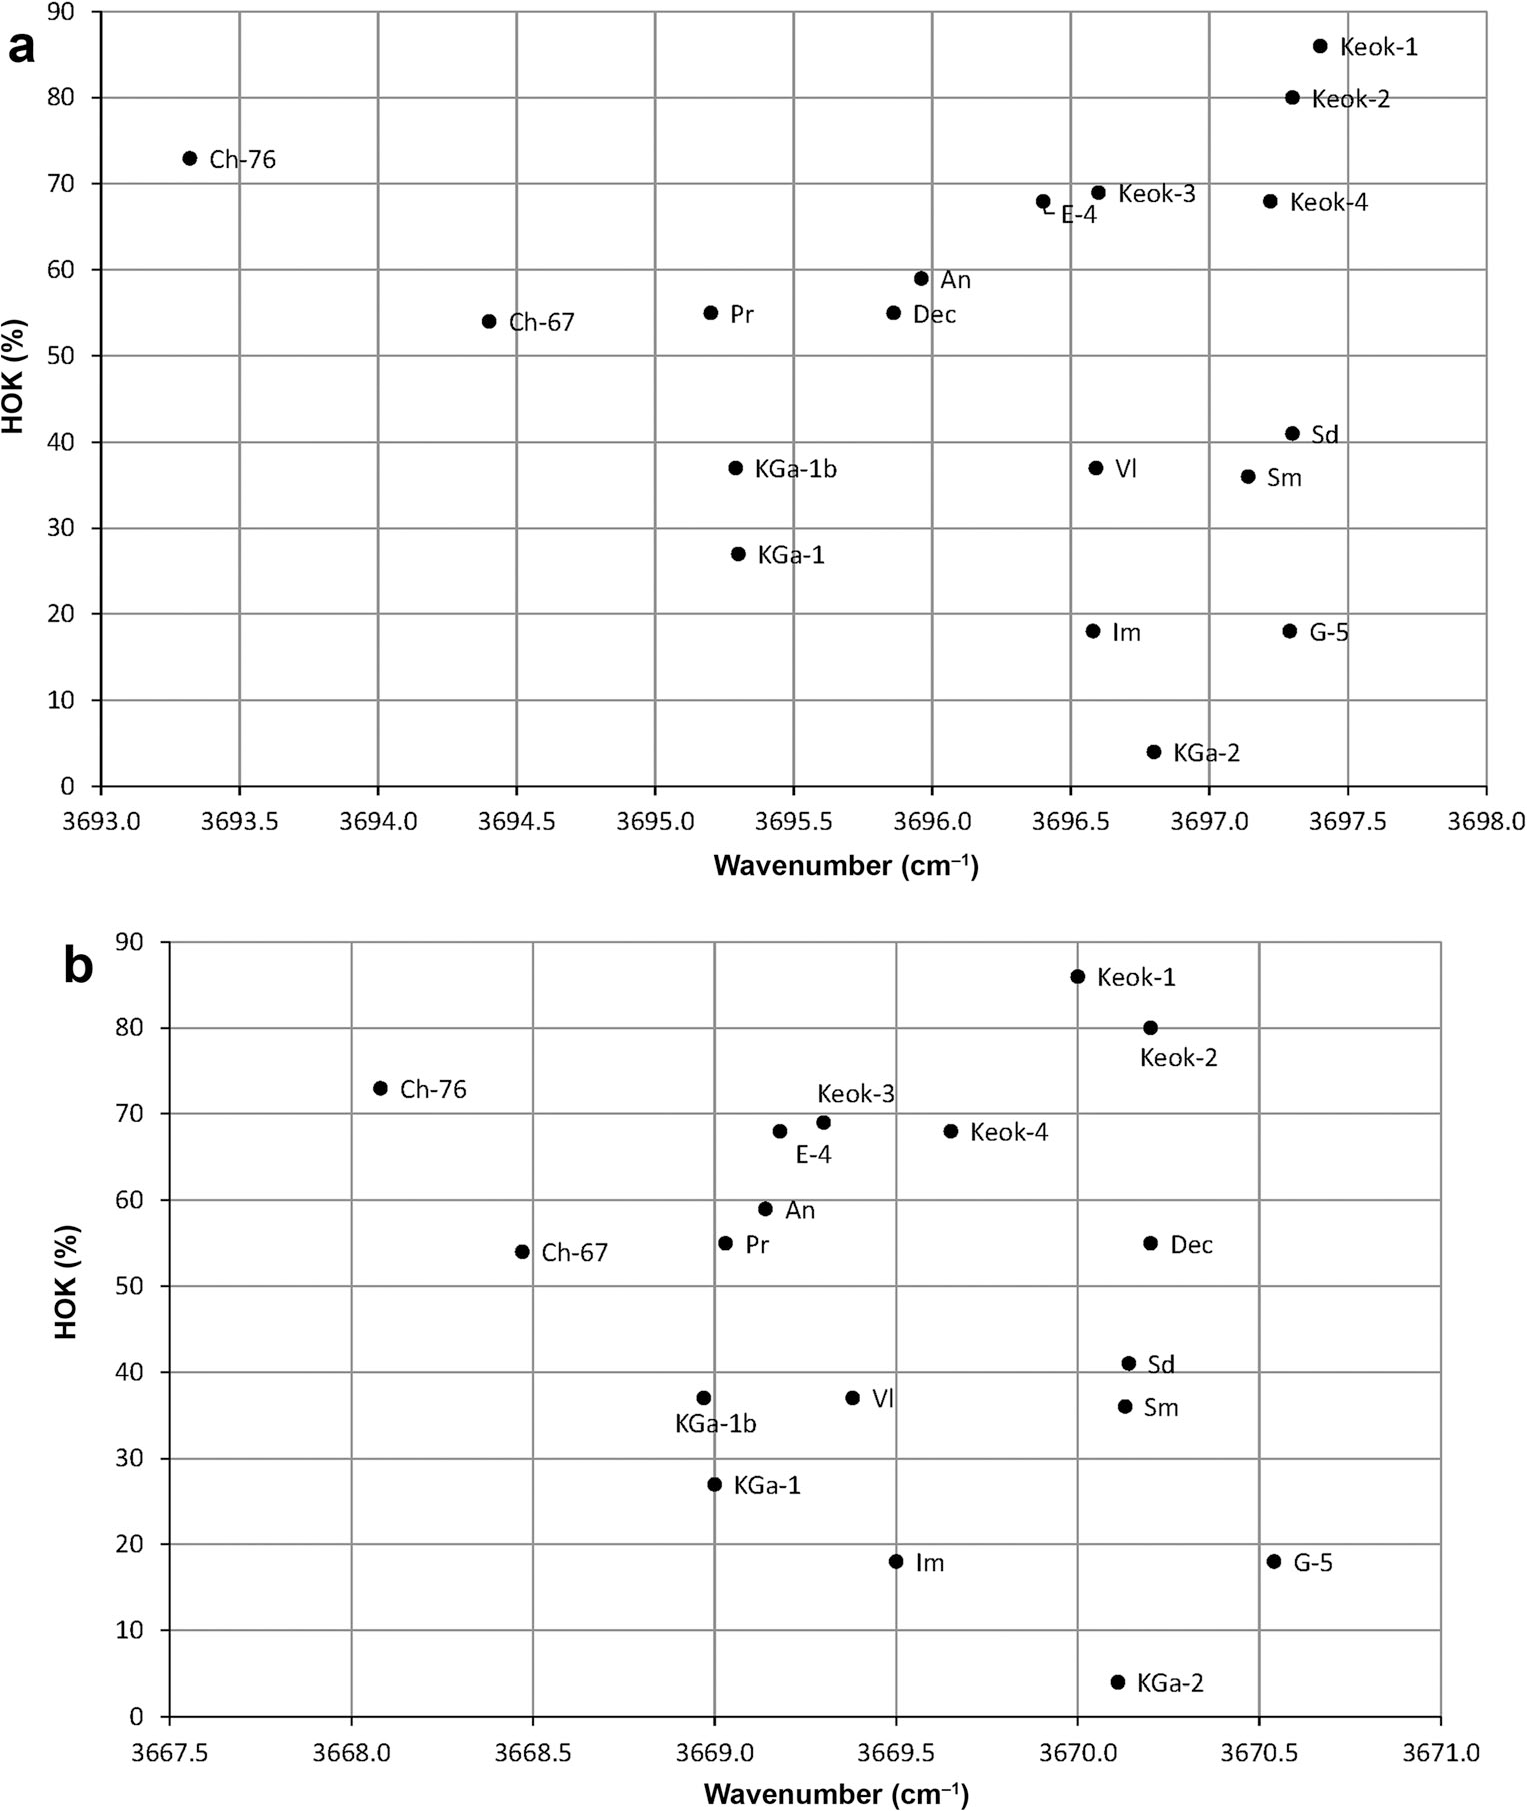
Additional information concerning the influence of structural and spectroscopic features on the individual positions of the ν1, ν2, ν3, and ν4 OH bands is provided by the analysis of the evolution of their wavenumbers as a function of the HOK content (Fig. 12a-d).
The HOK contents plotted vs the positions of the a ν 1, b ν 2, cν 3, and dν 4 bands


The ν1 bands.wavenumber distributions.
The positions of the ν1 band of the samples with HOK ≥ 50% vary from 3693.3 cm–1 to 3697.4 cm–1 for samples Ch-76 and Keok-1, respectively, which have contrasting crystallite sizes (Fig. 12a). The decrease in the HOK phase content from Ch-76 (73%) to Pr (55%) and An (59%) fine-particle samples is accompanied by increasing wavenumbers from 3693.3 cm–1 to 3696.0 cm–1, respectively. In contrast, in the samples consisting of coarse crystallites, decreasing HOK contents from Keok-1 (86%) to Dec (55%) is accompanied by a decrease in wavenumbers from 3697.4 to 3695.9 cm–1. The evolution of the band positions of the samples consisting of fine particles shows that the greater the LOK content and the smaller the particle thickness, the greater the wavenumbers of the ν 1 bands (Fig. 12a). In particular, sample Ch-76, having the largest HOK content (73%) and the thickest particles (35 layers) of all the fine-particle samples, shows the smallest wavenumber of the ν 1 band (3693.3cm–1). A decrease in the HOK content (54%) and particle thickness (30 layers) for sample Ch-67 increased the ν 1 wavenumber (3694.4 cm–1). Further decreases in the HOK contents and particle thicknesses shift the ν 1 band positions for samples An (3696 cm–1) and Pr (3695.2 cm–1) to greater wavenumbers. The variation range for the ν1 band positions for the samples with HOK < 50% is narrower than that for the samples with HOK ≥ 50% (Fig. 12a). In particular, the ν 1 band positions for samples KGa-2 and Im (groups 3 and 1, respectively) are very close (3696.8 and 3696.6 cm–1), probably because both samples have very large amounts of the LOK phase (96 and 82%, respectively) and very similar structural features of their LOK phases (Table S2). Similarly, samples KGa-1b and KGa-1, which differ in crystallite size but have relatively similar LOK contents (63 and 73%, respectively) show identical ν 1 positions at 3695.3 cm–1. This similarity is probably also related to the identical structural features of the LOK phases in these samples. These observations may indicate that the ν1 band positions of the samples with HOK < 50%, irrespective of particle size, should have larger or smaller ν 1 wavenumber values that are mostly defined by the structural features but not by the contents of LOK phases.
The ν2 bands.
At a qualitative level, the relationships between the HOK contents and the ν 2 band positions are similar to those observed for the ν 1 bands (Fig. 12b). In particular, for HOK>50%, the ν2 wavenumbers vary within a rather wide range from 3668.1 cm–1 (fine-particle sample Ch-76) to 3670.2 cm–1 (coarse-particle sample Keok-2). A decrease in the HOK content from Ch-76 (73%) to Pr (55%) and An (59%) increases the ν 2 wavenumbers from 3668.1 to 3669.1 cm–1, whereas a decrease in the HOK content from Keok-2 (80%) to E-4 (68%) decreases their wavenumbers from 3670.2 to 3669.1–3669.0 cm–1. The positions of the ν 2 band observed for the samples with HOK < 50% vary from 3669.0 to 3670.5 cm–1. This wavenumber variation range is similar to that observed for the ν1 bands. Indeed, samples KGa-1b (HOK = 37%) and KGa-1 (HOK = 27%) composed of crystallites of different sizes both have the ν 2 bands at 3669.0 cm–1. Similarly to the case of the ν1 bands, this value coincides with that for the fine-particle sample Pr (HOK = 55%). In addition, the ν 2 wavenumbers for samples KGa-2, Sm, and Sd are similar to those for sample Keok-2, and the band positions for samples Im and Vl, to that for sample Keok-4 (Fig. 12b). Similarly to the ν 1 band positions, the wavenumbers of the ν 2 bands corresponding to samples consisting of either coarse or fine crystallites have either larger or samller values, respectively, irrespective of the HOK content.
The ν3 bands.
In contrast to the ν1 and ν2 bands, the wavenumber distributions of the ν3 bands differ substantially depending on whether HOK is ≥ or < 50% (Fig. 12c). Indeed, for the samples with HOK ≥ 50%, the ν 3 band positions vary within a narrow range from 3651.7 to 3652.6 cm–1 (Fig. 12c). For the samples with HOK < 50%, the ν 3 bands are shifted to larger wavenumbers compared to those for the samples with HOK ≥ 50% and vary from 3652.5 to 3654.0 cm–1 .
The ν4 bands.
The characteristic feature in the distribution of the ν 4 band positions is that the wavenumber values for the samples with HOK ≥ 50% (3619.6–3620.3 cm–1) are generally lower than those for the other samples (3620.2–3621.0 cm–1) (Fig. 12d). Three samples show extreme ν4 wavenumber values: the coarse-particle sample Keok-1 has the smallest ν 4 (3619.6 cm–1); and the fine-crystallite samples (Sd and G-5), the largest value (3621 cm–1) (Fig. 12d). In contrast to the ν1 band-position distribution, the wavenumbers for the ν4 bands for the coarse-crystallite samples are lower than those for the fine-crystallite samples.
To summarize, two different arrangements occur in the high- (HOK ≥ 50%%) and low-ordered (HOK<50%) samples as regards the position variations of the ν1, ν 2 and ν 3, ν 4 bands. For ν1 and ν 2, the band positions for the low-ordered samples are within the wavenumber range for the high-ordered samples. In contrast, the ν 3 and ν 4 band positions for the low-ordered samples are shifted toward higher wavenumbers with respect to those of the high-ordered samples. Moreover, the wavenumbers of the ν 3 bands increase from 3653.1 to 3654.0 cm̶1 in the series of samples VI, Sm, Im, G-5, and Sd. Similarly, the positions of the ν4 bands in the same series increase from 3620.4 to 3620.9. These wavenumber values are similar to those for the band positions in the FTIR spectrum of dickite. According to Farmer (Reference Farmer2000) and Balan et al. (Reference Balan, Lazzeri, Saitta, Allard, Fuchs and Mauri2005), besides a weak band of uncertain origin at 3702 cm–1, three major bands are observed in the dickite FTIR spectra at 3622, 3655, and 3711 cm–1.
The low-temperature FTIR spectra of kaolinites of different origins and structural order were studied by Johnston et al. (Reference Johnston, Elzea-Kogel, Bish, Kogure and Murray2008) who concluded that a typical feature of the low-ordered kaolinite samples was an occurrence of dickite-like and even nacrite-like structural fragments in the main kaolinite matrix. HRTEM and SAED were used by Kogure et al. (Reference Kogure, Johnston, Kogel and Bish2010) to study the nature of stacking faults in a kaolinite specimen of sedimentary origin from Capim, Brazil, which was previously studied by Johnston et al. (Reference Johnston, Elzea-Kogel, Bish, Kogure and Murray2008). The stacking faults in the sample structure were found to be caused mainly by disorder in the alternating t 1 and t 2 layer displacements. In addition, HRTEM revealed small amounts of stacking faults related to displacements of octahedral vacancy sites and/or mutual layer rotations by ±120o or (2n + 1)60o. Qualitatively, these defects may be associated with dickite- or nacrite-like fragments in the Capim kaolinite fractions in agreement with the low-temperature IR results. The analysis of the FTIR spectrum of this sample was, therefore, of special interest. In the FTIR spectrum of the <0.5 μm fraction of sample Capim, the ν 3 and ν4 bands were observed at 3652.8 and 3620.5 cm–1 (Table 2). The ν 3 wavenumber value is even smaller than those for the ν 3 bands of the low-ordered Sd and G-5 samples (Table 2). These data suggest that at least some of the low-ordered kaolinite samples contain a certain amount of dickite-like structural fragments distributed among kaolinite layers.
Conclusions
Application of a novel approach developed by Drits et al. (Reference Drits, Sakharov and Hiller2018) to modeling the experimental XRD patterns of kaolinites in terms of an orthogonal layer unit cell with a mirror plane showed, for the first time, that each sample in a collection of kaolinite samples differing in origin and particle size consisted of a mixture of nearly defect-free HOK and low-ordered LOK phases, with HOK varying from 85 to 4%. These results served as a foundation for establishing relationships between the degree of structural disorder and specific FTIR spectroscopic features for a set of kaolinite samples differing in terms of the contents of the coexisting high- and low-ordered phases.
Samples having different FWHM values and particle size but similar or identical FWHM(ν 1)/FWHM(ν 4) and FWHM(ν 3)/FWHM(ν 2) ratios were found to have the same or similar HOK contents, so that in each sample, the amount of the HOK phase content defines the ratio of the FWHM values for the OH bands in question irrespective of the particle size. The FWHM(ν 1)/FWHM(ν 4) and FWHM(ν 3)/FWHM(ν 2) values are linearly related to the HOK contents. These regularities may be associated with the in-phase and out-of-phase character of the corresponding pairs of vibrations, respectively. The variations of the A(ν 1)/A(ν 4) values with HOK were found to be dependent on crystallite size.
Application of the hypothesis of Farmer (Reference Farmer1998) to the nature of the inner-surface OH-stretching vibrations coupled to yield the out-of-phase ν3 and ν2 modes allowed suggesting, in terms of the orthogonal layer unit cell, a novel interpretation for the variations of the relative integrated intensities of these bands with the contents of the HOK phase. With increasing amounts of the HOK phase, the ν2 configurations of the OH stretching vibrations are replaced by the ν3 configurations, which are consistent with the mirror symmetry of the layer unit cell. A kaolinite FTIR spectrum, is, therefore, the result of the statistically weighted sum of the contributions from the coexisting high-and low-ordered structures, which reflects the competition between the unit-cell triclinic symmetry and the mirror symmetry of the layer, respectively.
Analysis of the evolution of the ν1, ν2, ν3, and ν4 OH band positions as a function of the HOK contents revealed two different trends. The ν1 and ν 2 band positions for the low-ordered samples are within the wavenumber range for the high-ordered samples. In contrast, the ν 3 and ν 4 bands for the low-ordered samples are shifted toward larger wavenumbers with respect to those of the high-ordered samples. The abnormally high ν 3 and ν 4 values in the spectra of some of the low-ordered kaolinites suggest that these samples may contain a certain amount of dickite-like structural fragments distributed among kaolinite layers. Further research which would require additional sophisticated techniques is needed to elucidate this issue.
The results obtained provide a basis for formulating FTIR criteria for evaluating the degree of structural order in kaolinites. The set of kaolinites studied, however, may not cover the whole diversity of the possible types of phase and structural heterogeneity and particle-size distributions. To enhance the reliability of the potential criteria, therefore, they should be verified by using an expanded collection of kaolinite samples.
Supplementary Information
The online version contains supplementary material available at https://doi.org/10.1007/s42860-021-00133-w.
Acknowledgments
The authors are grateful to the following colleagues for kindly providing some of the samples: A. Derkowski (Keok-2, KGa-1), S. Hillier (Keok-3, Ch-76, Ch-67, KGa-1), T. Kogure (Capim), and A. Zotov (Dec). Thanks are due to the anonymous reviewers for valuable comments. This study was carried out and funded within the framework of the state assignment of GIN RAS (#0135-2019-0068).
Funding
Funding sources are as stated in the Acknowledgments.
Declarations
Conflict of Interest
The authors declare that they have no conflict of interest.