I. INTRODUCTION
The ability of the electron beam cold hearth melting (EBCHM) method, removing the low- and high-density inclusions and solving the problem of inhomogeneity of structure and composition, is higher than vacuum arc remelting (VAR). Reference Boyer1–Reference Vutova and Donchev4 The EBCHM process is used extensively for the fining of titanium ingot. Reference Tatsuhiko, Kanayama and Onoye5,Reference Liu, Li and Jiang6 To make high-quality titanium strip coil, a single EBCHM for the large-scale rectangular titanium ingot, which can be directly rolled applying the existing equipment of rolling steel, has the potential for significant cost reductions, due to leave out the operations of forging and stamping. Reference Wood7
One of important advantages of EBCHM is the improvement in ingot quality because of the fact that the long residence time of the molten titanium in the melting/refining cold-hearths also greatly reduces the incidence of high-density inclusions, which submerge into the bottom face of the cold-hearth and are thus incorporated into the solid skull. Reference Vutova, Koleva and Mladenov8 Furthermore, a wider range of feedstock like scraps can be used while a compacted electrode need be fabricated in VAR. There is also a greater flexibility in the ingot form (cylinder or slab) in terms of the cross-section geometry of the water-cooled crystallizer and the ingot length depending on the adequate continuously withdrawing operations. Reference Koleva, Vutova and Mladenov9 Because of the energy of the heating source which can be controlled independently and the casting conditions (the speed of melting and the pouring temperature of molten in the crystallizer) which are feasible to change, the EBCHM offers considerable potential with regard to the control of metallurgical microstructure of titanium.
The microstructure of castings is of great importance due to its role on mechanical properties. Though the potential of the EB process, the microstructure of large-scale titanium slab ingot produced from this technology method have not been established to any great extent. Reference Kalinyuka, Triguba, Zamkova and Ivasishin10 Hence, the task of this work is to study the microstructure evolution and obtain the corresponding prediction results at different casting conditions in the crystallizing process during the EBCHM for large-scale titanium slab ingot. However, the nucleation and grain growth processes are not easily observed in the real solidification and it will lead to very much cost to obtain the effect of processing conditions on the microstructure of the large-scale titanium slab ingot. In comparison with experimental method, the numerical simulation can make contribution to saving costs and reducing experiment cycles for investigating the microstructure evolution because it’s beneficial to observe the formation of microstructure visually and give a better understanding of the coupled heat transfer involved in the crystallization. Reference Atwood, Lee and Minisandram11
For the prediction of microstructure evolution, deterministic models have been first proposed for the description of the nucleation and growth of equiaxed grains during solidification. Reference Rappaz and Gandin12 However, they suffer from the limitations that they don’t consider preferential growth directions of dendrites and the microstructure features such as grain morphology and size cannot be depicted graphically. Reference Wu, Liu, Guo, Li and Su13 Many these drawbacks have been removed with the use of stochastic models. Although by the Monte Carlo (MC) method, one of the stochastic, first initiated by Brown and Spittle can predict the grain growth, it lacks the physical mechanisms associated with dendritic growth, especially does not account for the growth kinetics of dendritic tips or the preferential growth directions of dendrites. Reference Gandin and Rappaz14 For this reason, the simulation of microstructure evolution in solidification processes has been approached using cellular automaton (CA) models coupled with finite element (FE) heat flux calculations. Based on the solidification thermodynamics and grain nucleation and growth kinetics, the growth of grains, the locations of the nucleation and the crystallization orientation can be simulated. Reference Gandin, Rappaz and Tintillier15,Reference Carozzani, Digonnet and Gandin16
The simulation of microstructure evolution based on CAFE model has been successfully applied to various solidification process by Rappaz et al., and the simulated results were compared in a qualitative with experimental findings. Reference Rappaz, Gandin, Desbiolles and Thévoz17 The simulated results of the microstructure evolution for TC4 alloy during laser deposition shaping (LDS) based on cellular automation were compared with the experiments by Tian et al. Reference Tian, Li and Song18 Burbelko et al. Reference Burbelko, Falkus, Kapturkiewicz, Sołek, Drożdż and WróbeL19 modeled the grain structure formation in the steel continuous ingot by using the software ProCAST, which was compared with a structure of a real ingot. For the large-scale titanium slab ingot during EBCHM, the CAFE model provides an effective tool in predicting the influence of casting conditions upon the changes in microstructure, but not the exact values of grain size.
Although great efforts and progress have been made to model microstructure evolution with so-called CAFE models over the past couple of decades, there has no systematic investigation of microstructure evolution during EBCHM for large-scale titanium slab ingot based on CAFE method. Therefore, the microstructure simulation of large-scale titanium slab ingot (1250 × 210 × 8000 mm) is determined based on the actual experimental results. Moreover, the effects of nucleation parameter, pouring temperature, and pulling speed on the formation of microstructure are presented in this work.
II. MATHEMATICAL MODEL
Temperature distribution of the solidification of large-scale titanium slab ingot during EBCHM is considered in a three-dimensional model of the nonsteady heat transfer, which can be depicted by the partial differential equation Reference Liu, Li, Chen, Geng and Jiang20 :
 $$\rho \left( T \right){{\partial H} \over {\partial t}} = \nabla \cdot \left( {\lambda \left( T \right)\nabla T} \right)\quad ,$$
where H, ρ, and λ are the heat enthalpy, the density and the thermal conductivity of the material as the function of temperature T, respectively. t is the heat transfer time and
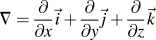 $\nabla = {\partial \over {\partial x}}\vec i + {\partial \over {\partial y}}\vec j + {\partial \over {\partial z}}\vec k$
,
 $\vec i,\vec j,\vec k$
are the unit vector of x, y, z coordinate, respectively.
The heat transfer in the crystallizer can be also formulated using the partial differential equation of nonsteady heat transfer as follows:
 $${c_{{\rm{pm}}}}{\rho _{\rm{m}}}{{\partial {T_{\rm{m}}}} \over {\partial t}} = \nabla \cdot \left( {{\lambda _{\rm{m}}}\nabla {T_{\rm{m}}}} \right)\quad ,$$
where the subscript m is corresponding to the crystallizer. c pm is the specific heat capacity at constant pressure of the crystallizer as the function of temperature.
Besides the above heat transfer equations, to predict the microstructure formation of large-scale titanium slab ingot, we need to consider nucleation sites of grains and the growth kinetics of dendrite tips. During a time-step, δt, with the temperature of the specimen decreasing by an amount, δT, the undercooling increases by an amount δ(ΔT)[δ(ΔT) > 0]. Accordingly, the density of new nucleated grains, δn, in the bulk (or surface) is given by:
 $$\delta n = n\left[ {\Delta T + \delta \left( {\Delta T} \right)} \right] - n\left( {\Delta T} \right) = \int_0^{\Delta T + \delta \left( {\Delta T} \right)} {{{{\rm{d}}n} \over {{\rm{d}}\left( {\Delta T} \right)}}{\rm{d}}\left( {\Delta T} \right)} \quad ,$$
where dn/d(ΔT) is corresponding Gaussian nucleation site distribution in the following equation:
 $${{{\rm{d}}n} \over {{\rm{d}}\left( {\Delta T} \right)}} = {{{n_{\max }}} \over {\sqrt {2\pi } \Delta {T_\sigma }}}\exp \left[ { - {1 \over 2}{{\left( {{{\Delta T - \Delta {T_{\max }}} \over {\Delta {T_{\rm{\sigma }}}}}} \right)}^2}} \right]\quad ,$$
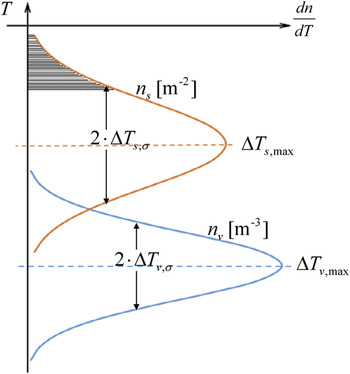
where n is the total density of grains, ΔT max is the mean undercooling, ΔT σ is the standard deviation, and n max is the maximum density of nuclei obtained by a continuous nucleation distribution. Reference Wu, Liu, Guo, Li and Su13 Two functions describing heterogeneous nucleation both at the mold surface and in the bulk of the liquid are shown in Fig. 1. The subscripts s and v represent the nucleation at the mold surface and in the bulk of the liquid, respectively.
Distribution of the heterogeneous nucleation site at the mold wall and in the bulk of the liquid.

The dendrite growth is dominated by the total undercooling of the dendrite tip. Kurz, Giovanola, and Trivedi studied the solute equilibrium of the dendrite tip and then presented the KGT model to calculate the growth kinetics of both columnar and equiaxed morphologies. Reference Kurz, Giovanola and Trivedi21 The relationship between the growth rate of dendrites v(ΔT) and the undercooling ΔT is simplified as:
 $$v\left( {\Delta T} \right) = \alpha \Delta {T^2} + \beta \Delta {T^3}\quad ,$$
 $$\left\{ {\matrix{ {\alpha = {{2k\Gamma \left( {1 - k} \right) - \rho {D^2}} \over {2km{C_0}{\pi ^2}\Gamma {{\left( {1 - k} \right)}^2}}}} \cr {\beta = {D \over {\pi \Gamma {{\left( {m{C_0}} \right)}^2}\left( {1 - k} \right)}}} \cr} } \right.\quad ,$$
where α and β are the dynamic coefficient of dendrites tip growth, m is the slope of the liquidus, C 0 is the initial solute concentration, k is the partition coefficient, and D is the diffusion coefficient. By the calculation, for the industrial pure titanium TA1, α = 1.64 × 10⁻⁶ and β = 1.03 × 10⁻⁷.
III. GEOMETRY MODEL AND BOUNDARIES CONDITIONS
The temperature distribution has a significant effect on the grain microstructure during the continuous solidification. To obtain the temperature distribution before coupling the CA method, the solution must be carried out on the specific conditions including geometric conditions, initial conditions, and boundary conditions.
-
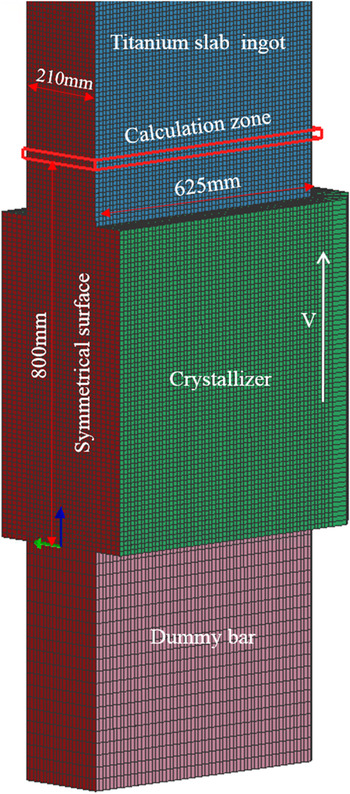
(i) Figure 2 shows the model of geometry and finite element enmeshment. In consideration of symmetry reasons, only half of the geometry (625 × 210 × 8000 mm) is represented. To reduce the computation time and improve the calculation precision, the size of the surface mesh is 10 mm on the titanium slab ingot and the size of the surface mesh on the crystallizer is 15 mm. And then the volume mesh can be generated by dragging the surface mesh. The total number of elements is 1,315,867. Since the Lagrangian representation could have been used for both the FE and CA calculations, the cooling conditions associated with the crystallizer would have been translated along the lateral surface of the nonmoving slab ingot. Reference Rappaz, Gandin, Desbiolles and Thévoz17 With the boundary movement method calculating the temperature distribution, the initial position of the crystallizer, which moves up in the pulling speed assumed to be constant in this simulation, is in the bottom of the ingot shown in Fig. 2. The calculation zone, which is 800 mm distant from the bottom face of the ingot, generates automatically a regular network of square cells with 200 µm spacing. The calculation zone we choose is to simulate the microstructure evolution using CAFE method and compare with the experimental results of cross-section of the selection zone.
-
(ii) The titanium molten pool surface in the crystallizer heated by the electron beam gun keeps the constant pouring temperature we assumed, which can be controlled by adjusting the power of the electron beam gun. The initial temperature of the crystallizer and dummy bar is defined as 293 K.
-
(iii) The continuous solidification process mainly refers to three kinds of heat transfer patterns: the thermal conduction between different materials that contact each other, the radiation, and the convection heat transfer. Reference Kou, Zhang, Li, Hu, Li and Zhou22 To simplify theoretical treatment, it is assumed that the radiation is equivalent to the thermal conduction between the ambient and the solidification titanium ingot that is at the outer of the crystallizer.
-
(a) Heat exchange between crystallizer and cooling water, Q c
-
 $${Q_{\rm{c}}} = {h_{\rm{c}}}\left( {{T_{\rm{m}}} - {T_{\rm{w}}}} \right)\quad ,$$
where h c is the heat convection exchange coefficient between the titanium ingot and crystallizer [(h c = 5000 W/(m2 K)], T m and T w represent the temperature of crystallizer and cooling water, respectively. During the simulation the cooling water, T w, keeps constant temperature (T w = 288 K).
-
(b) Heat exchange between crystallizer and titanium ingot, Q t
 $${Q_{\rm{t}}} = {h_{\rm{t}}}\left( {T - {T_{\rm{m}}}} \right)\quad ,$$
where h t is the heat transfer coefficient between titanium ingot both crystallizer and dummy bar [h t = 1000 W/(m2 K)], T represents the temperature of titanium ingot.
-
(c) Heat exchange between the ambient and the solidification titanium ingot that is at the outer crystallizer, Q r
 $${Q_{\rm{r}}} = {h_{\rm{r}}}\left( {T - {T_{\rm{a}}}} \right)\quad ,$$
where h r is the heat transfer coefficient between solidification titanium ingot which is at the outer of the crystallizer and the ambient [h r = 10 W/(m2 K)], T a represents the ambient temperature (T a = 293 K).
Model of geometry and finite element.

IV. RESULTS AND DISCUSSION
A. Effect of the mean bulk undercooling on the microstructure
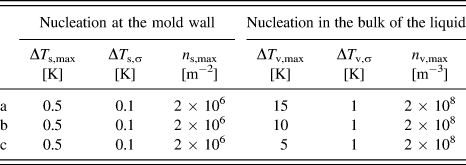
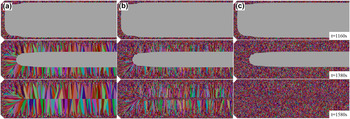
The above CAFE model, which accounts for the heterogeneous nucleation in the bulk and at the surface of the ingot, is applied to continuous casting of the titanium ingot. In this work, the simulation is carried on the cross-section that is 800 mm distant from the bottom face of the ingot. The mean undercooling and the maximum nucleation density can be gained by the testing of practical castings, but the errors of the parameters available are always inevitable in experiments. Reference Wang, Wang, Zhao, Zhang and Ren23 Thus, it is completely necessary to study the effects of Gaussian distribution parameters on simulation so as to make the microstructure simulation quicker and more accurate and provide practical value to industrial production. As can be seen from Fig. 1, the value of ΔT v,σ only determines how quickly the heterogeneous nucleation reaches the maximum density of grains given by the corresponding values of n v,max. Therefore, these two distributions can be chosen to be very narrow (small ΔT σ values). Besides, it is difficult to adjust the six parameters for matching each other in this CAFE model. The other values of Gaussian distribution parameters are assigned constant by referencing the literature Reference Atwood, Lee and Minisandram11,Reference Rappaz and Gandin12,Reference Wang, Wang, Zhao, Zhang and Ren23,Reference Liu, Li and Jiang24 and only the parameter for the mean nucleation undercooling in the bulk of the liquid, ΔT v,max, is varied in Table I, which lists different nucleation parameters in this simulation. To determine the Gaussian distribution parameters, the effect of mean bulk undercooling on the microstructure simulation of the large-scale titanium slab ingot will be presented in this work. Figure 3 shows the simulation of microstructure evolution with the solidification times (t = 1160, 1380, 1580 s) using the different nucleation parameters, while the pouring temperature and the pulling speed for this calculation are defined as 2123 K and 2.35 × 10⁻⁴ m/s, respectively. The grains which appear in Fig. 3 have different colors which represent different crystallographic orientations.
Nucleation parameters varied in the simulation.

Simulation of microstructure evolution with the solidification times using the different mean nucleation undercooling in the bulk of the liquid: 15 K (a); 10 K (b) and 5 K (c), respectively.

From Fig. 3, we can observe the grain morphologies and the columnar grain growth direction, where the gray region is for the liquid phase. At the beginning of solidification, numerous grains are clearly nucleated on the periphery of the ingot presented in Fig. 3. Since they are in contact with the external water-cooled crystallizer and have the bigger undercooling, resulting in the large density of grains at the mold surface, these equiaxed grains are fine and have random orientations, as can be seen from the different colors on the micrographs. In Fig. 3(a), the columnar grains which originate from nuclei of the chill zone can develop up to the center of the titanium slab ingot. This means that the average undercooling of the columnar dendrite tips is smaller 15 K when they reach the center of the ingot since the nucleation of equiaxed grains in the bulk of the liquid can only start at about 15 K (see Table I).
In Fig. 3(b), three different crystalline zones, including a chill zone made of fine equiaxed grains, columnar grain zone and central equiaxed grain zone, can be observed in the micrographic cross-sections of the titanium ingot. Once the undercooling in the remaining liquid becomes small, equiaxed grains can nucleate and grow at the expense of columnar grains, thus leading to the so-called “columnar-to-equiaxed” transition (CET), which is clearly visible in Fig. 3(b). Exquiaxed grains can be formed in the volume of the liquid ahead of the columnar dendrites reaching the center of the ingot, because of the lower undercooling in the bulk of the liquid which is closer to the mean undercooling (ΔT v,max = 10 K, see Table I). This trend is more pronounced when the mean undercooling is only 5 K, as can be seen in Fig. 3(c). Large equiaxed grains are nucleated in the bulk of the liquid in Fig. 3(c), as might be expected. Therefore, the nucleation parameters have great influence on the different crystalline zones. Obviously, the higher the mean undercooling, the larger the columnar dendrite zone. In these simulation conditions, if the mean undercooling in the bulk of the liquid is lower than 5 K, the type of the grains would be exquiaxed.
B. Comparisons of simulation results with experimental results
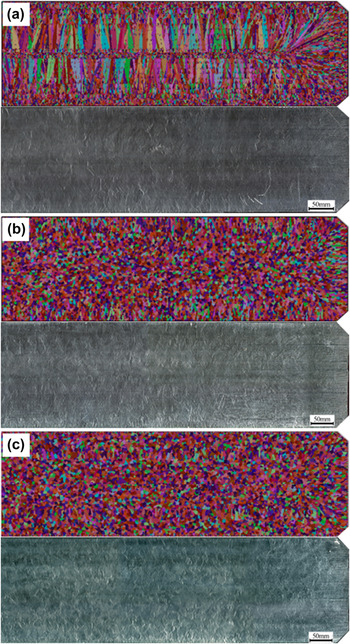
According to the above effect of the mean bulk undercooling on the microstructure, the aim of the present work is to determine the mean bulk undercooling. The comparison of the simulated result with the one of the experimental results is showed in Fig. 4(a), as simulated used the nucleation parameters of the type b in Table I. It can be seen that the simulated result is consistent with the practical experimental result and crystallization processes conform to the actual situation, especially, the transition from columnar grains to equiaxed grains is preferably consistent with that of the experiment. In the micrographic of Fig. 4(a), those grains, which are usually located in the columnar grains, are not directly connected with the surface of the casting in the cross-section but those shapes are smaller or more elongated than the equiaxed grains. These grains, unlike the equiaxed grains, have nucleated at the mold wall but not in the plane of the metallographic section. These grains nucleating above or below the cross-section then grown in such a way that they are intersected by the plane of the cross-section.
Comparison of the simulation results with experimental results along the different cross-sections: 800 mm (a); 400 mm (b) and 200 mm (c) distance from the bottom face of the ingot.

To validate theoretical results further, we compare the simulation results along the different cross-sections using the determined nucleation parameters with the experiment results. As can be seen from Figs. 4(b) and 4(c), the simulation results and the experimental results are basically consistent. In Fig. 4(b), among the many grains formed at the periphery of the slab ingot only a few short columnar grains generate. It can be seen from Fig. 4(c) that almost all the grains are equiaxed. Since the cross-section is closer to the bottom face of the ingot that is in contact with the water-cooled dummy bar, the local undercooling of this section is bigger than the mean undercooling predetermined so that the density of the grains nucleated in the bulk of the liquid rapidly increased. Furthermore, it can be concluded from Fig. 4 that, the columnar dendrite zones expand with the distance from the bottom face of the ingot increasing.
A reasonable qualitative agreement can be seen between the experimental results and the simulated results for both grain morphology and grain growth pattern as shown in Figs. 4(a)–4(c). Hence, we choose the mean bulk undercooling, ΔT v,max = 10 K, as the nucleation parameters to simulate the microstructure evolution during EBCHM for large-scale titanium slab ingot. In the sections below, the calculation using the determined nucleation parameters (see Table I, b) can be useful to predict and analyze the microstructure of evolution under different casting conditions, which extends the ability to control the grain structure by controlling pulling speed and pouring temperature.
C. Effect of different casting conditions on microstructure
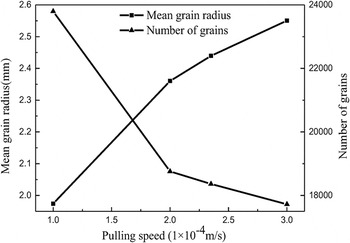
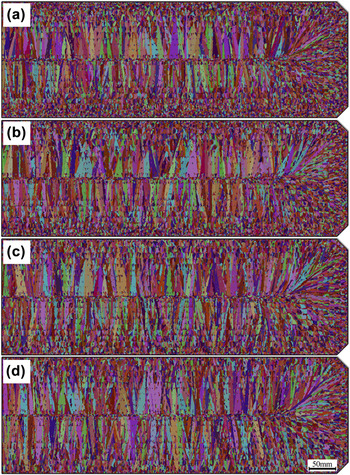
To study the influence of the main casting conditions including pouring temperature and pulling speed on the microstructure evolution of the steady-state zone of titanium slab ingot, Reference Liu, Li and Jiang24 the simulation is implemented along the cross-section that is 3000 mm distant from the bottom face of the ingot varying the casting conditions. The effects of pulling speed on the grain structures of large-scale titanium slab ingots are shown in Fig. 5. In this case, 8000-mm-length large-scale titanium slab ingots are continuously casted at four pulling speeds: (a) 1 × 10⁻⁴ m/s; (b) 2 × 10⁻⁴ m/s; (c) 2.35 × 10⁻⁴ m/s; (d) 3 × 10⁻⁴ m/s, respectively, for the same pouring temperature 2123 K. With increasing of the pulling speed, the columnar dendrite zones expand. By analyzing the statistics of simulation results, Fig. 6 shows the relationship of the mean grain radius and the number of grains with the pulling speed. The general trend is that the mean grain radius is found to increase with increasing of the pulling speed under identical thermal condition. When the pulling speed increases from 1 × 10⁻⁴ to 3 × 10⁻⁴ m/s, the mean radius of grains increases from 1.97 to 2.55 cm. It is easy to understand that the cooling rate is lower at higher pulling speed for the fixed cooling capacity of the crystallizer. Accordingly, with the pulling speed decreasing, the increasing of the liquid undercooling will induce much more grains, which confines the growth of columnar dendrites and results in the finer grains [see Fig. 5(a)]. As a result, for achieving the finer grains, under the productivity improvement, the pulling speed should be properly reduced in the real production of the large-scale titanium ingot.
Grain structures within the identical cross-section at different pulling speeds: 1 × 10⁻⁴ m/s (a); 2 × 10⁻⁴ m/s (b); 2.35 × 10⁻⁴ m/s (c) and 3 × 10⁻⁴ m/s (d), respectively.

Relationship of the mean radius and number of grains with the pulling speed.

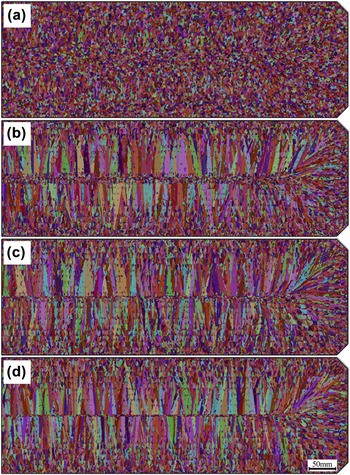
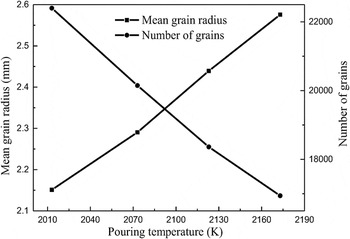
Figure 7 shows the simulated results of grain structures along the identical cross-section which is 3000 mm distant from the bottom face of the ingot at four different pouring temperatures (2023, 2073, 2113, 2173 K) under the pulling speed of 2.35 × 10⁻⁴ m/s. The finer grains zone at the periphery of the ingot is larger at lower pouring temperature [see Fig. 7(a)]. It can be found from Fig. 8 that with the pouring temperature increasing from 2023 to 2173 K, the number of the grains linearly decreases from 22,397 to 16,941 and the mean grain radius linearly increases from 2.15 to 2.58 cm. As we know, the increase of the titanium superheat results in the decrease of the nucleation rate and the increase of the thermal gradient, which promotes the growth of the columnar dendrites. Moreover, the grains nucleated in the bulk of the liquid are elongated in the upstream heat flux direction and their elongation is an increasing function of (
 $G \cdot v_{\rm{s}}^{ - 1}$
), where v
s is the local solidification rate.
Reference Rappaz, Charbon and Sasikumar25
Whereas the thermal gradient, G, is higher at high pouring temperature, the grains are more elongated in Fig. 7(d). So reducing the superheat of the titanium is the most effective way to improve the equiaxed grains amount and refine the grain size during the continuous casting large-scale titanium slab ingot.
Grain structures within the identical cross-section at different pouring temperatures: 2023 K (a); 2073 K (b), 2123 K (c), and 2173 K (d), respectively.

Relationship of the mean radius and number of grains with the pouring temperature.

V. CONCLUSIONS
Microstructure evolution during EBCHM for large-scale titanium slab ingot is simulated based on coupled CAFE method. In the modeling of microstructure evolution of the titanium ingot, the nucleation parameters have great influence on the three types of crystalline zones. The higher the mean undercooling, the larger the columnar dendrite zone. If the mean undercooling in the bulk of the liquid is lower than 5 K, the type of the grains would be exquiaxed in this simulation conditions. The nucleation parameters of the microstructure simulation of titanium ingot are determined based on one of the experimental results. For the determined parameters, our theoretical results are agreement with other experimental results. Effects of the pulling speed and the pouring temperature on the microstructure of titanium slab ingot under the steady-state solidification are obtained. Results show that with the pulling speed increasing, the columnar dendrite zones expand and the number of grains decreases, whereas the mean radius of grains increases under identical thermal condition. Accordingly, the pulling speed should be properly reduced in the actual production of the large-scale titanium slab ingot, meanwhile improving the productivity. With the pouring temperature increasing, the mean grain radius increases under identical pulling speed. So reducing the pouring temperature is the most effective way to improve the equiaxed grain amount and refine the grain size during the continuous casting of large-scale titanium slab ingot.
NOMENCLATURE

ACKNOWLEDGMENTS
This work is supported By Applied Basic Research Program of Yunnan Province (No. 2013FC001), Science and Technology Project of Yunnan Province (No. 2016FB089), and Startup Foundation for Advanced Talents of Kunming University of Science and Technology (No. KKSY201551034).