I. INTRODUCTION
Research on semiconductor nanowires has been dramatically increased over last two decades.Reference Yang, Yan and Fardy1 Among a variety of fields, nanowire-based thermoelectrics has emerged, which is caused by a significant reduction of thermal conductivity κ in these structures with respect to the bulk. Strong interaction of the phonons with the surface is the origin of this diameter-dependent and surface morphology–related effect, which can amount up to a two-orders-of-magnitude reduction of κ of bulk silicon.Reference Boukai, Bunimovich, Tahir-Kheli, Yu, Goddard and Heath2–Reference Martin, Aksamija, Pop and Ravaioli4 Silicon offers several advantages over the standard thermoelectric materials, Bi2Te3 and PbTe, which can be essential to overcome the present restriction of thermoelectrics to niche applications. For waste heat recovery, e.g., from combustion engines,Reference Hsu, Yao, Ye and Yu5, Reference Espinosa, Lazard, Aixala and Scherrer6 high-temperature stability, environmental compatibility, safe medium- to long-term availability, and on-going price reduction are mandatory, which is provided by silicon. Basic research on the thermoelectric (TE) properties of silicon nanowires is ongoing, but so far has been limited to single elements. However, nanowire-based thermoelectric generators will require a dense arrangement of nanowires in parallel to provide the necessary output power, e.g., for maintenance-free electronics or sensorics.
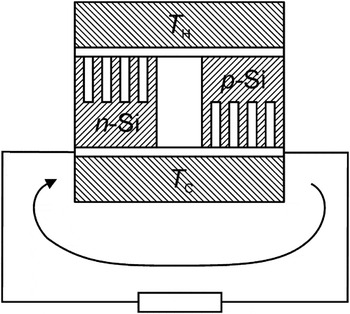
With respect to economical fabrication of nanopillar (NP) arrays, top–down fabrication using photolithography and deep reactive ion etching (DRIE) followed by thermal oxidation have been developed, which may be preferable over bottom–up approaches based on self-assembling.Reference Park, Di Giacomo, Anisha, Berger, Thompson and Adesida7–Reference Sökmen, Stranz, Fündling, Merzsch, Neumann, Wehmann, Peiner and Waag9 For packaging into thermocouples, vertically aligned nanowires, i.e., nanopillars (NPs) of both n- and p-type doping and having uniform diameter and length, are required. Figure 1 shows a schematic of a thermocouple comprising n- and p-doped NP arrays joined using a high-temperature-stable silver sintering process.Reference Stranz, Sökmen, Peiner and Waag10
Schematic configuration of a nanopillar-based thermocouple operated as a thermoelectric generator.

The thermal properties of nanowires are conventionally measured by heating at one end and sensing at the other using thermally isolated microfabricated heating and sensing areas or by heating across suspended wires joined integrally between large thermal contacts.Reference Shi, Li, Yu, Jang, Kim, Yao, Kim and Majumdar11, Reference Bourgeois, Fournier and Chaussy12 For TE devices based on NP arrays, however, these approaches are not applicable. Therefore, in this study, we use a technique based on the 3-omega method as recently reported for vertically aligned carbon nanotubes.Reference Hu, Antonio Padillay, Xuz, Fisher and Goodson13 For characterizing single pillars, a Wollaston wire probe on a nanopositioning stage in a scanning electron microscope (SEM) was used. Furthermore, we address the thermal characterization of NP arrays via Seebeck voltage measurements in an extended temperature range up to 460 °C.
II. FABRICATION OF NANOPILLARS
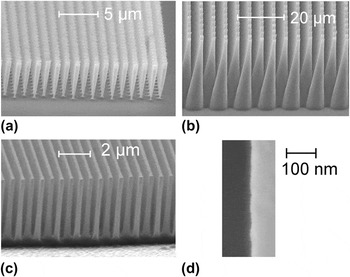
Silicon pillar arrays of various diameter and height were fabricated using deep reactive ion etching (DRIE) with SF6/O2 at cryogenic temperatures.Reference Sökmen, Stranz, Fündling, Merzsch, Neumann, Wehmann, Peiner and Waag9 Standard optical lithography was used for patterning a resistent layer into circular discs, which served immediately as the etch mask, i.e., hard masks were not required. As a result of underetching, the resulting pillar diameters were smaller than the masking disc diameters. Typical SEM photographs of realized silicon pillar arrays of different diameter, height, and shape are shown in Figs. 2(a)–2(c). From the enlarged view of a pillar sidewall edge in Fig. 2(d), a surface roughness of a few nanometers can be estimated.
Scanning electron microscope (SEM) photographs of deep reactive ion etching-fabricated pillar arrays (a) inverted frustum, top diameter = 0.7 μm, l NP = 6 μm; (b) frustum, top diameter = 1 μm, l NP = 30 μm; (c) cylinder, diameter = 0.2 μm, l NP = 6 μm. In (d), the sidewall surface of a typical pillar is displayed at large magnification.

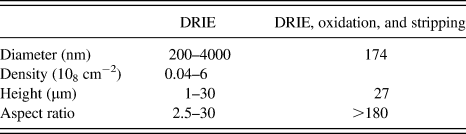
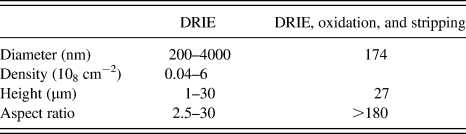
For basic studies, the NP diameter was further reduced by thermal oxidation and subsequent oxide stripping. For TE devices this procedure may not be efficient since the fraction θ NP of the device cross-sectional area covered by NPs, i.e., the current-carrying area, is reduced. In Table I, the geometrical dimensions of NPs are given, which were realized using the described top–down process.
Geometrical dimensions of silicon pillars realized using top–down fabrication.
III. THERMAL CHARACTERIZATION OF SINGLE PILLARS
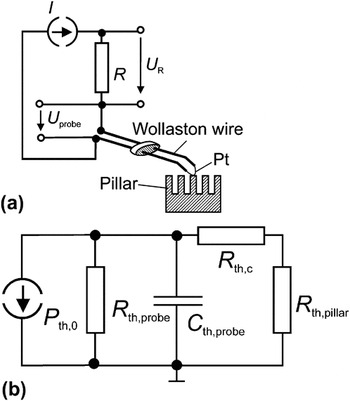
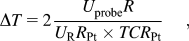
A Wollaston wire–based 3-omega setup was used to measure the thermal conductance of the realized silicon pillars.Reference Puyoo, Grauby, Rampnoux, Rouvière and Dilhaire14, Reference Lefèvre, Volz and Chapuis15Figure 3(a) shows a schematic representation a Wollaston-wire probe over a silicon pillar array mounted on a nanopositioning stage (Kleindiek MM3A-EM, Reutlingen, Germany) in an SEM (Leica S360, Oberkochen, Germany). Wollaston-wire probes were fabricated from Pt wires of 5.8 μm in diameter having an Ag cladding. The Ag cladding was removed from Pt core over a length of 250 μm using wet etching. This part of the probe served as the heating element and the thermometer for the 3-omega measurements. It had a resistance of R Pt = 1 Ω, which was much less than the bias resistor R = 100 Ω through which the current I of a lock-in amplifier (Perkin-Elmer 7265, Wokingham, UK) was supplied to the probe. The temperature increase of the probe was then related to the in-phase 3-omega component of the amplitude U probe of the voltage drop over the probe according to Refs. Reference Puyoo, Grauby, Rampnoux, Rouvière and Dilhaire14–Reference Cahill16:
Wiring of (a) Wollaston-wire-based 3-omega setup for thermal measurements with pillars and (b) simplified equivalent thermal circuit diagram of Wollaston-wire-based 3-omega setup for thermal characterization of pillars.

where U R = 2.5 V as defined in Fig. 3(a) and R Pt and TCR Pt = 3.9 × 10⁻³/K denoting the Wollaston wire resistance and the temperature coefficient of resistivity of platinum, respectively. Typical values of the temperature oscillation amplitude were around ΔT = 1 K, corresponding to a heat flux around 500 W/cm2 dissipated into a 10-μm long pillar.
Figure 3(b) shows a simplified equivalent thermal circuit diagram of the measuring circuit. R th,probe, R th,pillar, and R th,c denote the thermal resistances of the probe, the nanopillar, and the contact to the NP, respectively. P th,0 is the thermal input power and C th,probe is the heat capacitance of the probe. Contributions to heat storage by the nanopillar and its contact are neglected in the considered frequency range much below 100 kHz. Considering the probe as a semi-infinite medium, we have R th,probe ∼ C th,probe ∼ 1/ω −1/2.Reference Hu, Antonio Padillay, Xuz, Fisher and Goodson13 The temperature oscillation related to the in-phase 3-omega voltage, which was measured using the Wollaston probe, was assumed to be proportional to the real part of the thermal impedance of the equivalent circuit in Fig. 3(b).
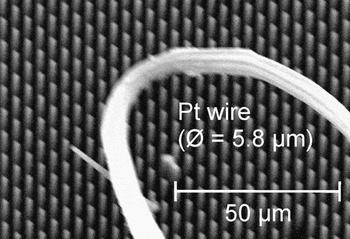
The Wollaston wire probe was mounted on a nanopositioning stage on a SEM and arranged over a silicon pillar array as shown in Fig. 4. In repeated measurements, the reproducibility of probing was investigated assuring that the probe is in contact with only one pillar. Owing to the Wollaston-wire-diameter of 5.8 μm, a minimum pitch of the pillar arrays of more than ∼2 μm was necessary to avoid unintentional probing of two neighboring pillars. As a result of the vacuum conditions in the SEM, a thermal contact radius of ∼20 nm was assumed,Reference Lefèvre, Volz and Chapuis15 which was much less than the diameters of the investigated pillars.
Wollaston wire in a SEM (Leica S 360, Reutlingen, Germany) positioned over an array of silicon pillars using a Kleindiek probe (MM3A-EM, Oberkochen, Germany).

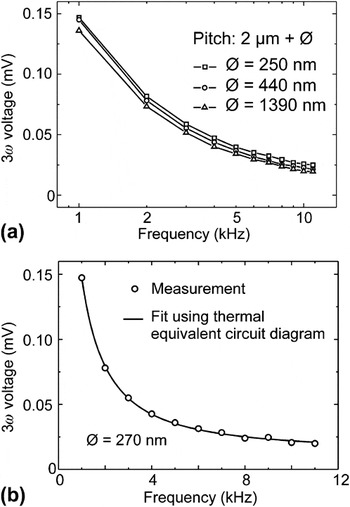
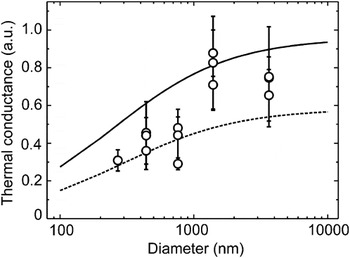
Samples (n-type silicon; length = 10 μm) comprising silicon pillars were analyzed having diameters and distances in the range of 250 nm to 4 μm. In Fig. 5(a), typical 3-omega plots are displayed. They show a decrease in the 3-omega voltage with a frequency as expected according to the thermal equivalent circuit. Fitting performed to these curves using the real part of the thermal impedance of the circuit in Fig. 3(b) and the thermal resistance of the pillar as adjustable parameter yielded very good agreement as can be seen exemplarily in Fig. 5(b). Measurements with pillars of diameters from 250 nm to 3.7 μm were analyzed accordingly. Relative thermal conductivities related to the value of bulk silicon, which were calculated from these measurements, were plotted against the pillar diameter as depicted in Fig. 6. As expected, the conductivity shows a decrease toward smaller diameters.
(a) 3-Omega voltage measured with three single silicon pillars of different diameters and (b) 3-omega voltage measurement with a pillar of 270 nm in diameter superimposed by the curve from a fit using the thermal equivalent circuit in Fig. 3(b).

Normalized thermal conductance measured with silicon pillars of various diameters using the 3-omega method. The solid and broken lines represent normalized thermal conductivities obtained using a semiphenomenological model.Reference Sungtaek Ju17

Superimposed to the measurements, a semi-phenomenological dependence of the thermal conductivity normalized to the bulk silicon value was drawn (solid line), which was derived assuming frequency-independent diffuse phonon-boundary scattering as the dominant effect for thermal conductivity in nanostructuresReference Sungtaek Ju17:
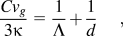
where Λ = 250 nm and Cv g = 1.7 × 10⁹ W/m2/K denote the mean free path of phonons of silicon nanolayers and the heat capacity–group velocity product of silicon nanowires, respectively.Reference Sungtaek Ju17 Fitting of Eq. (2) yielded a better agreement for diameters less than 1,000 nm assuming a phonon mean free path of Λ = 290 nm (broken line).
The deviation of the measured values from the curve is assigned to the uncertainty of our 3-omega thermal conductivity measurements. As the dominant error source, we consider the small heat impedance of the Wollaston wire, which may have caused virtual thermal shorting of the pillar. Higher thermal impedance can be expected using nanomechanical thin-film probes.Reference Puyoo, Grauby, Rampnoux, Rouvière and Dilhaire14 A thin-film 3-omega probe of increased thermal impedance is under development, which furthermore, is designed to enable measurements with pillar arrays instead of single pillars to reduce the uncertainty. Thermal measurements with pillar arrays are feasible due to the accurate definition and knowledge of height, diameter, and position of pillar fabricated using the described top–down process.
IV. PILLAR ARRAYS
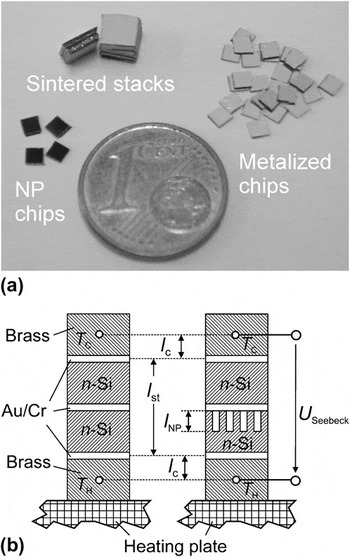
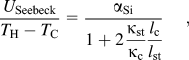
For thermal characterization of pillar arrays, stacks of n-type silicon chips of doping level of 5 × 1018 cm-3 were investigated. In Fig. 7(a), bulk-silicon and pillar-array chips are shown in addition to stacks of chips permanently joined using pressure-assisted silver sintering. The schematic in Fig. 7(b) shows a cross-sectional view of a stack composed of Au/Cr-metalized bulk silicon and a pillar-array chip pressed between blocks of brass (CuZn). We measured the Seebeck voltage U Seebeck with these stacks for hot-side temperatures in the range of 50 < T H < 470 °C at increasing temperature difference T H – T C between the brass blocks. An oscillating signal was observed, which is caused by the thermal impedance of the brass blocks. Therefore, a settling time of 4 s between each temperature increment of 4 K had to be maintained until a nearly constant temperature gradient across the stack was achieved. As a result of the temperature loss across the brass blocks and the contact layers, a decreased residual temperature gradient within the stack and thus a reduced Seebeck voltage was expected according to
(a) Pillar/bulk and bulk/bulk silicon chips in a photograph and (b) in a cross-sectional schematical representation.

with the Seebeck coefficients α Si and α CuZn of silicon and brass, respectively. Because of the constant area, we consider sheet thermal resistances of the silicon stack and the contact layers that are denoted as l st/κ st and l c/κ c, respectively. Neglecting the thermal contact resistances between the brass blocks and the metalized chips and between the chips, only the thermal path resistances through the silicon and through the brass blocks have to be taken into account.
Regarding the small value of α CuZn = 0.5 μV/K for the Seebeck coefficient of brass, its contribution to the measured Seebeck voltages of 40–250 μV/K of U Seebeck/(T H – T C) measured with reference bulk/bulk silicon stacks of l st = 500–4000 μm is negligible. Using Eq. (3), κ st = κ Si = 148 W/m/K, κ c = κ CuZn = 113 W/m/K, and l c = 1.5 mm, we find for the Seebeck coefficient of silicon α Si = 375 ± 30 μV/K, which is a reasonable value for both bulkReference Geballe and Hull18 and nanowireReference Neophytou, Wagner, Kosina and Selberherr19n-type silicon of doping level of 5 × 1018 cm−3. Measurements with a pillar/bulk silicon stack of l st = 500 μm yielded U Seebeck/(T H − T C) ∼85 μV/K, which is more than a factor of 2 higher than the bulk/bulk reference. From this value, a sheet thermal resistance of the NP/bulk silicon stack of l st/κ st = 8.5 × 10⁻⁶ m2K/W can then be calculated using Eq. (3). The pillar/bulk silicon stack comprises an array of NPs of length l NP = 7 μm, a diameter of 260 nm, and a pitch of 1.26 μm, i.e., a coverage of the chip area at a fraction of θ NP = 3.3%. Neglecting the heat conduction through the ambient air, we can model the sheet thermal resistance of the pillar array by l NP/θ NP/κ NP. It is connected in series with the sheet resistance of the bulk, resulting in a sheet resistance of the entire pillar/bulk stack of

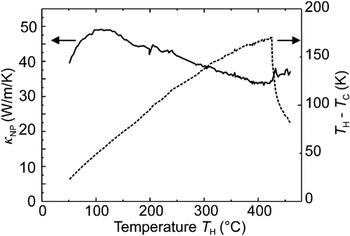
Using Eq. (4) we were able to calculate the thermal conductivity of the NPs as displayed in Fig. 8. We found values of κ NP between ∼35 W/m/K and ∼50 W/m/K in the considered temperature range. The measured room temperature value of ∼40 W/m/K is somewhat lower than the thermal conductivity along silicon films of 250-nm thickness,Reference Sungtaek Ju17, Reference Cahill, Ford, Goodson, Mahan, Majumdar, Maris, Merlin and Phillpot20 but is consistent to an extrapolation of the findings for nanowires of surface roughness in the nanometer range.Reference Hochbaum, Chen, Delgado, Liang, Garnett, Najarian, Majumdar and Yang3, Reference Martin, Aksamija, Pop and Ravaioli4 This applies also to the observed decrease of thermal conductivity with increasing temperature of ∼0.05 W/m/K2, which corresponds nearly to the findings for smooth silicon nanowires of 115 nm in diameter above 200 K.Reference Hochbaum, Chen, Delgado, Liang, Garnett, Najarian, Majumdar and Yang3 As shown in Fig. 2(d), our nano pillars have sidewalls of low surface roughness in the nanometer range as could be expected for silicon-etched NPs using the cryogenic process.Reference Pruessner, Rabinovich, Stievater, Park and Baldwin21 The measured low thermal conductivity and the stable operation of arrays of silicon NPs of 260 nm in diameter in a large temperature range from 50 to 470 °C at temperature differences up to 190 °C confirmed that silicon is an attractive material for high-temperature TE applications.
Thermal conductivity κ NP versus the temperature T H of the hot side and temperature difference T H – T C measured with a pillar/bulk stack of silicon in the temperature range between 50 °C and 470 °C.

V. CONCLUSIONS
Silicon pillars of 200 nm–4 μm in diameter were fabricated in a top–down process using optical lithography and DRIE at cryogenic temperatures. Thermal characterization was performed with single pillars using the Wollaston wire–based 3-omega method in a SEM. The results were analyzed using a simplified thermal equivalent circuit model. Pillar arrays were characterized in the temperature range between 50 and 470 °C by measuring the Seebeck voltage of pressure-joined chip stacks. In both cases, we found a considerable decrease of thermal conductivity for the pillars with respect to bulk silicon, confirming their potential for thermoelectric devices.
ACKNOWLEDGMENTS
We thank M. Turczyński for his valuable technical assistance during the 3-omega measurements with silicon pillars. This work is supported by the German Research Foundation (DFG) under PE 885/2-1 “Silicon-based thermoelectric nanosystems” in the framework of the priority program, SPP 1386.