I. INTRODUCTION
Semiconductor photocatalysis has been considered to be a promising solution for the degradation of organic pollutants, which are harmful to the environment, hazardous to human health, and difficult to degrade by natural means. Reference Zong and Wang1,Reference Miyauchi, Nukui, Atarashi and Sakai2 TiO2 is undoubtedly the most popular and widely used photocatalyst due to its low cost, high photocatalytic activity, chemical stability, and nontoxicity. Reference Cabrera, Mills and O’Rourke3–Reference Patel, Jaiswal, Warang, Scarduelli, Dashora and Ahuja5 However, its photocatalytic activity requires ultraviolet light (λ < 400 nm), which only accounts for a small fraction of the solar spectrum (3–5%). Reference Semlali, Pigot, Flahaut, Allouche, Lacombe and Nicole6 Recent research efforts were focused on the development of new visible-light-driven photocatalysts, because the visible light accounts for about 43% of the sunlight. Reference Teng, Li, Gao, Zhang, Zhang and Wan7,Reference Gao, Wang, Ran, Yao, Yang and Liu8
Silver bromide (AgBr) is an important narrow band gap semiconductor and it can be used as a photosensitive material with a direct band gap of 4.29 eV (289 nm) Reference Praveen, Kokalj, Rérat and Valant9 and an indirect band gap of 2.64 eV (470 nm). Reference Benmessabih, Amrani, Hassan, Hamdache and Zoaeter10 However, AgBr is unstable in pure crystal form, especially when it was used as a photocatalyst. Reference Yu, Xu, Wang, Wang and Yu11–Reference Cao, Luo, Lin, Xu and Chen13 To enhance its stability and photocatalytic activity of AgBr in photocatalytic reaction, one possible approach is to combine AgBr photocatalyst with noble metal Ag Reference Dong, Tang, Zhu, Zhan, Zhang and Tong14 or metal oxides. For example, it was reported that the photocatalytic activity of Ag/AgBr composite can be maintained after the third cycle photocatalysis. Reference Wang, Liu and Chen15 Moreover, the rate constant k for the degradation of methyl orange by Ag/AgBr composite was 2 and 18 times higher than that of AgBr and Ag/AgCl. Reference Xu, Song, Liu, Li, Xu and Xia16 It was also reported by previous literature that the photocatalytic activities and photostabilities of TiO2 were enhanced when it was coupled with Ag2CO3. Reference Yu, Wei, Chen, Xie, Zhou and Fan17 The role of surface plasma absorption of Ag nanoparticle is to enhance the photocatalytic activity of BiOBr nanoplate. Reference Yu, Fan, Meng, Yang, Cao and Li18
Solution synthesis has been proved to be a very powerful method in synthesizing Ag/AgBr nano/microcomposite. But in previous reports, surfactant templates or high temperature surroundings are usually needed to yield Ag/AgBr nano/microcomposite by solution synthesis route. Reference Dong, Tang, Zhu, Zhan, Zhang and Tong14–Reference Xu, Song, Liu, Li, Xu and Xia16,Reference Song, Lee, Roh and Jang19–Reference Li, Wang, Zhang, Hu, Chen and Guo21 Moreover, the involved multistep synthesis approach is complicated. Reference Li, Wang, Zhang, Hu, Chen and Guo21 Therefore, the development of rapid and low-temperature synthesis method suitable for the large-scale synthesis of Ag/AgBr nano/microcomposites represents a critical challenge to their practical applications.
Core/shell multicomponent catalysts have attracted considerable attention because of their novel properties and potential applications in electronics, Reference Lauhon, Gudiksen, Wang and Lieber22 catalysis, Reference Tao, Grass, Zhang, Butcher, Salmeron and Somorjai23 and photocatalysis. Reference Bi, Ouyang, Cao and Ye24–Reference Zhang, Ai, Li and Jiang26 For example, TiO2-coated glass microspheres can be used for degradation of dimethyl phthalate. Reference Jiang, Joens, Dionysiou and O’She27 Especially, Changlin Yu's group has recently reported that novel core–shell-like Ag2O/Ag2CO3 nanoheterostructures with high visible-light-driven photocatalytic activities and good stable properties are fabricated by a facile phase transformation method. Reference Yu, Li, Kumar, Yang and Jin28 However, to the best of our knowledge, the reports on solution synthesis and their photocatalytic stability of Ag/AgBr core–shell photocatalyst are scarce up to now. Herein, we report the synthesis of Ag/AgBr core–shell heterostructures by a very simple two-step chemical precipitation route without adding any surfactants at room temperature, as well as the characterization of the resultant products by x-ray diffraction (XRD), x-ray photoelectron spectroscopy (XPS), energy dispersive x-ray fluorescence spectroscopy (EDXRF), field emission scanning electron microscopy (FESEM), high-resolution transmission electron microscopy (HRTEM), and UV–vis diffuse reflectance spectra (DRS). Furthermore, the photocatalytic activities of the as-synthesized pure AgBr and Ag/AgBr samples are also studied by degrading R6G in water under both visible-light and real sunlight irradiation. For comparison, N-doped TiO2, which had been studied mostly as a visible light-responsive photocatalyst and synthesized at pH of 3, was also used as reference and the detailed synthesis process of N-doped TiO2 can be seen in the previous report. Reference Wu, Long, Cai, Chen and Wu29
II. MATERIALS AND METHODS
All the chemical reagents used in this work, including AgNO3, diammonium hydrogen citrate ((NH4)2HCit), ascorbic acid, and NaBr were of analytical grade and purchased from Sinopharm Chemical Reagent Co., Ltd., China.
The detailed synthesis process of pure Ag microsphere is reported as follows: 0.679 g (4 mmol) AgNO3 was dissolved in 60 mL of distilled water with magnetic stirring for 10 min and a transparent solution was formed. Then, 20 mL 50 g/L of (NH4)2HCit aqueous solution was added to the above solution with stirring and a white suspension was rapidly formed. After that, 20 mL 35.2 g/L ascorbic acid aqueous solution was poured into the above suspension and the mixed suspension was stirred at room temperature for 30 min. The as-formed pure Ag samples (denoted as S-0) without adding NaBr were filtrated, washed with distilled water and ethanol, and finally dried at 50 °C for 12 h in air.
The typical procedure for the preparation of Ag@AgBr composite is as follows: 0.436 g (4 mmol) of the as-synthesized pure Ag microspheres dispersed in 100 mL distilled water, and the suspension was sonicated for 10 min. Then, 0.5 mL (denoted as S-0.5), 1 mL (denoted as S-1), or 5 mL (denoted as S-5) of 0.1 mol/L AgNO3 aqueous solution was added to the Ag suspension and stirred magnetically at room temperature for 30 min. Subsequently, equivalent volume (0.5–5 mL) of 10.2 g/L NaBr aqueous solution was added to the above solution and the mixed suspension was stirred at room temperature for another 120 min. The as-formed precipitates were filtrated, washed with distilled water and ethanol, and finally dried at 50 °C for 12 h in air.
For comparison, pure AgBr sample without Ag was also synthesized using the similar procedures. The detailed synthesis process is shown in the supporting information.
The obtained products were characterized by XRD (Bruker D8 ADVANCE diffractometer system, Karlsruhe, Germany), XPS (Thermo ESCALAB 250Xi, Thermo Fisher Scientific Inc., Waltham, MA), EDXRF (Thermo ARL energy dispersive x-ray fluorescence spectrometer, Thermo Fisher Scientific Inc., Waltham, MA), FESEM (Philips S-4800, FEI Company, Hillsboro, OR), BET surface area (Micromeritics Tristar 3000, Norcross, GA), HRTEM (Holland F-30, FEI Company, Hillsboro, OR), and UV–vis absorption spectra (Cary 5000 spectrophotometer, Varian, Santa Clara, CA).
The photocatalytic activities of N-doped TiO2, the as-synthesized pure AgBr and Ag/AgBr samples were evaluated under the irradiation by a 1000 W Xe lamp (λ > 420 nm). The visible-light photocatalytic experiments were carried out in a specially designed photochemical reactor and the detailed information of the photochemical reactor can be seen in our earlier report, Reference Zhang, Du, Li and Zhang30 which includes four parts: an illumination system including a 1000 W Xe lamp, cut-off filter (λ > 420 nm) and cooling attachments such as air pump and electric fan, reactor (two-layer Pyrex glass bottles of 300 mL capacity, and the space between two layers is filled by circulating water to cool the reactor), magnetic stirrer, and temperature controller. In each experiment, the distance between Xe lamp and Pyrex glass bottles was set to be 10 cm, and the temperature was 20 °C, which was controlled by circulating water in cooling attachment part of the photochemical reactor. Before illumination, 300 mL of R6G aqueous solution (1 g/L) containing 0.15 g of Ag/AgBr was magnetically stirred in the dark for 2 h to permit the adsorption/desorption equilibrium between the photocatalyst and R6G. During illumination, about 5.0 mL of suspension was taken from the reaction cell at an interval of time and centrifuged to separate the photocatalyst. The concentration of R6G in the above suspension was determined by a Japan Shimadzu UV-2550 UV–vis spectrophotometer at the maximum absorption wave length of R6G (526 nm). After each photometric measurement, the photocatalyst was returned to the reaction cell. The degradation rate of R6G was estimated by the following equation:
 $${\rm{Degradation\ ratio}} = {{{C_0} - C} \over {{C_0}}} \times {\rm{\ }}100\% \quad {\rm{,}}$$
where C 0 and C stand for the initial concentration before illumination and the reaction concentration of R6G after illumination, respectively.
To study the usefulness of the as-synthesized Ag@AgBr under weak-medium light irradiation, the as-synthesized Ag@AgBr sample was also studied by degrading R6G in water under real sunlight irradiation in daylight conditions and the detailed results are shown in the supporting information.
III. RESULTS AND DISCUSSION
The detailed synthesis process, XRD and FESEM results of the as-synthesized pure Ag sample (S-0) are given in the supporting information. It can be seen from the supporting information that most part of the as-synthesized pure Ag sample (S-0) displayed sphere-like particles.
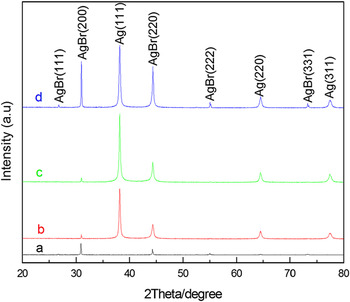
Figures 1(a)–1(d) illustrate the XRD patterns of the as-synthesized pure AgBr (a) and Ag@AgBr (b–d), respectively. The XRD patterns in Figs. 1(b)–1(d) indicate the formation of a mixture of cubic phase AgBr (JCPDS card no. 06-0438) and Ag (JCPDS card no. 04-783), while the XRD patterns in Fig. 1(a) can be indexed to single cubic phase AgBr (JCPDS card no. 06-0438). Moreover, the strong and sharp XRD peaks of Figs. 1(b)–1(d) indicated that the as-synthesized Ag@AgBr crystals were highly crystalline. No peaks corresponding to other Br-containing or Ag-containing phases were detected in its XRD patterns, which demonstrate that the formation of Ag@AgBr composite has been achieved by this chemical precipitation method.
XRD patterns of (a) pure AgBr, and Ag@AgBr composites synthesized at different reaction time: (b) S-0.5, (c) S-1, (d) S-5.

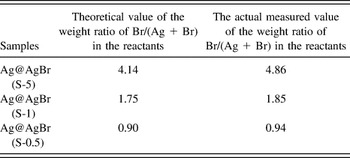
The elemental composition of Ag and AgBr of the as-synthesized Ag@AgBr composite was also calculated by EDXRF, which is shown in Table I. It can be seen from Table I that AgBr content of the as-synthesized Ag@AgBr composite increased with the increase in the concentration of AgNO3. Moreover, the value of Br/Ag in the as-synthesized Ag@AgBr composite was determined by EDXRF, which is close to the weight ratio of Br/(Ag + Br) in the reactants. It should be noted that the detailed elemental composition of the samples was estimated by commercial software based on XRD results. In the estimated process, the estimated results might be correct only under the condition that the crystal information of the as-synthesized samples was completely consistent with the data, which was stored in the commercial software by XRD factory.
The elemental composition of Br in the as-synthesized photocatalysts estimated by EDXRF.

The BET measurement revealed that the as-synthesized pure AgBr, Ag@AgBr (S-0.5), Ag@AgBr (S-1), and Ag@AgBr (S-5) composite had surface areas of 6.5, 5.9, 5.7, and 6.2 m2/g, respectively. It can also be seen that coupling of Ag with AgBr seems to have small influence on the specific surface areas of pure AgBr.
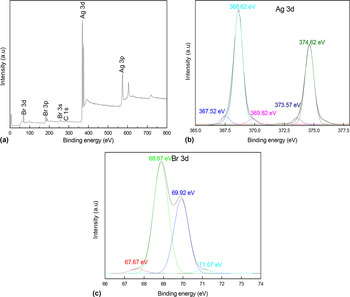
The XPS results of the as-synthesized Ag@AgBr sample (S-5) are demonstrated in Fig. 2. The full XPS spectrum of the Ag@AgBr (S-5) [Fig. 2(a)] showed only peaks that were assignable to Ag, Br, and C. The XPS peak for C 1s is ascribed to the adventitious hydrocarbon from the XPS instrument, not from the sample. Typical high-resolution XPS spectra of the Ag 3d and Br 3d lines are shown in Figs. 2(b) and 2(c), respectively. The Ag 3d spectrum of the Ag@AgBr sample consisted of two peaks at ∼368 and ∼374 eV, corresponding to the binding energies of Ag 3d 5/2 and Ag 3d 3/2, respectively. These two peaks were further deconvoluted into five peaks at 367.52, 368.62, 369.82, 373.57, and 374.62 eV. The peaks at 367.52 and 373.62 eV can be attributed to the Ag+ of AgBr, whereas the peaks at 368.62, 369.82, and 374.62 eV can be attributed to metal Ag0. Reference Dong, Tang, Zhu, Zhan, Zhang and Tong14,Reference Li, Wang, Zhang, Hu, Chen and Guo21 Moreover, the Ag@AgBr sample (S-5) had binding energies of 67.67 and 68.87 eV, corresponding to Br 3d 5/2. The peaks at 69.92 and 71.07 eV are assigned to Br 3d 3/2. Reference Dai, Lu, Dong, Ji, Zhu and Liu20
XPS patterns of Ag@AgBr sample (S-5) Survey spectrum (a) and high-resolution spectra for Ag 3d (b), Br 3d (c).

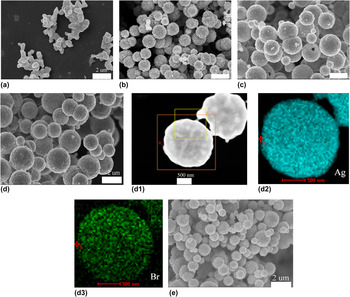
The morphology of pure AgBr and Ag@AgBr are characterized by FESEM and the results are displayed in Figs. 3(a)–3(d). From Figs. 3(a)–3(d), it can be seen that most part of the pure AgBr sample displayed irregular flake-like particles and most part of the as-synthesized Ag@AgBr exhibited regular and uniform sphere-like particles with particle size ranging from 500 to 1500 nm.
FESEM images of (a) pure AgBr, Ag@AgBr microspheres synthesized at different reaction time: (b) S-0.5, (c) S-1, (d) S-5; (d1-d3) HRSTEM-EDS mapping results of the as-synthesized Ag@AgBr microspheres (S-5).

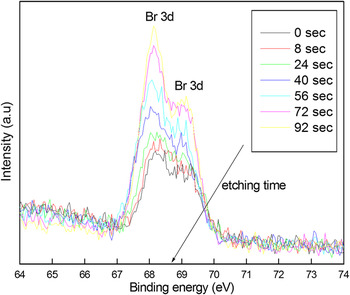
To confirm that the as-synthesized Ag@AgBr sample (S-5) has the core–shell structure consisting of a core of Ag and a shell of AgBr, the composition analyses of the Ag@AgBr sample (S-5) were characterized by XPS etching method and HREM energy-dispersive x-ray spectroscopy (EDS) mapping (scanning model of HRTEM) method using a FEI F30 microscope equipped with an EDAX energy EDS. High-resolution scanning transmission electron microscopy-EDS (HRSTEM-EDS) mapping results in Figs. 3(d1)–3(d3) of the Ag@AgBr (S-5) revealed that the composition of the sample contains Ag and Br. Thus, it can be concluded that the as-synthesized Ag@AgBr microspheres were devoid of any other impurity. Furthermore, it has been proven by HRSTEM-EDS mapping results shown in Figs. 3(d1)–3(d3) that the as-synthesized Ag@AgBr microspheres (S-5) consist of the Ag core and the AgBr shell. It can be also seen from Figs. 3(d1)–3(d3) that AgBr particles were uniformly deposited on the surface of the Ag core. Furthermore, the XPS etching results (Fig. 4) of the Ag@AgBr sample (S-5) by Ar+ demonstrated that the Br peak decreased with increasing the etching time, which can be explained by the fact that the AgBr layer was outside on Ag. Moreover, it can be seen from XPS etching results of the Ag@AgBr sample (S-5) that the approximate thickness of the outside AgBr layer was ∼92 nm.
XPS etching results of etching the Ag@AgBr sample (S-5) by Ar+.

The source materials used in the present system were AgNO3, (NH4)2HCit, ascorbic acid, NaBr and the synthesis was conducted in three steps for the formation of Ag@AgBr composite as given below:
 $$3{\rm{AgN}}{{\rm{O}}_3} + {({\rm{N}}{{\rm{H}}_4})_2}{\rm{HCit}} \to {\rm{A}}{{\rm{g}}_3}{\rm{Cit}} \downarrow + 2{\rm{N}}{{\rm{H}}_4}{\rm{N}}{{\rm{O}}_3} + {\rm{HN}}{{\rm{O}}_3}\quad {\rm{,}}$$
 $$2{\rm{A}}{{\rm{g}}_3}{\rm{Cit}} + 3{{\rm{C}}_6}{{\rm{H}}_8}{{\rm{O}}_6} \to 6{\rm{Ag}} + 3{{\rm{C}}_6}{{\rm{H}}_6}{{\rm{O}}_6} + 2{{\rm{H}}_3}{\rm{Cit}}\quad {\rm{,}}$$
 $${\rm{Ag}} + {\rm{AgN}}{{\rm{O}}_3} + {\rm{NaBr}} \to {\rm{Ag@AgBr}} + {\rm{NaN}}{{\rm{O}}_3}\quad {\rm{.}}$$
When AgNO3, (NH4)2HCit, and ascorbic acid were mixed in distilled water at room temperature, Ag microspheres were formed and the detailed results can be found in the supporting information, which may behave as a template in the following process of the reaction. By adding NaBr solution into the above reaction system, Br− ions from NaBr and Ag+ ions from AgNO3 can gradually convert to AgBr and the as-formed AgBr particles were then deposited on the surface of Ag spheres. The possible schematic diagram of the formation process of core(Ag)–shell(AgBr) microsphere (S-5) is shown in Scheme 1.
Possible schematic diagram for formation process of the as-synthesized core(Ag)-shell(AgBr) microspheres (S-5).

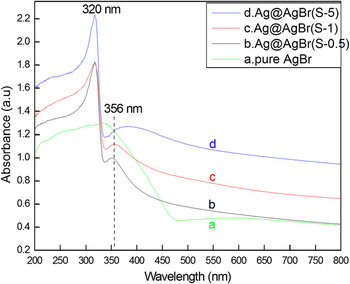
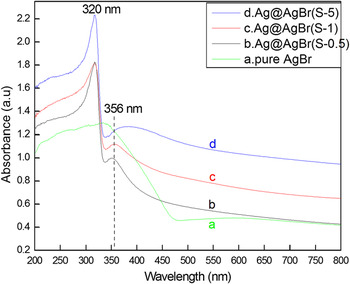
The UV–vis diffuse reflectance spectra of pure AgBr, Ag@AgBr core–shell microspheres were measured and converted into the absorption mode (Fig. 4) using the Kubelka–Munk function. Reference Zhang, Tian, Wu, Hong, Li and Fu31–Reference Zhang, Du, Li and Zhang33 As can be seen from Fig. 5, pure AgBr exhibits a band edge absorption at around 475 nm, which corresponds to a band gap of 2.61 eV. For Ag@AgBr samples, the broad absorbance peak at 350–450 nm was observed [Figs. 5(b)–5(d)], which is partially attributed to the characteristic band of pure AgBr (cubic phase), induced by the forbidden transition (4d 10 to 4d 95s 1) in the Ag ion. Reference Yang, Xie, Yuen, Xiong and Wong34 However, Ag@AgBr samples display a strong tailing absorption covering the whole visible region (the region from 450 to 800 nm) compared with pure AgBr, which is the typical photoabsorption feature reported for Ag@AgBr composite, Reference Wang, Liu and Chen15,Reference Xu, Song, Liu, Li, Xu and Xia16,Reference Song, Lee, Roh and Jang19–Reference Li, Wang, Zhang, Hu, Chen and Guo21 and suggests that the as-synthesized Ag@AgBr samples have the potential to be visible-light-driven photocatalysts. For Ag@AgBr samples, the absorption peaks at 320 and 356 nm were found, which are associated with the optical band gap and the surface plasma resonance of pure Ag microspheres, respectively. Thus, for Ag@AgBr samples, the broad absorbance peak at 350–450 nm can be attributed to two effects: the characteristic band of pure AgBr and the surface plasma resonance of pure Ag microspheres. Meanwhile, the absorption band at 450–800 nm may be induced by the plasmon coupling in a long range or a high-order coupling effect of a multi-Ag-particle. Reference Yang, Xie, Yuen, Xiong and Wong34 With increasing volume of the reactants [Figs. 5(b)–5(d)], there is a gradual enhancement of the two absorption peaks centered at 350–450 nm and 450–800 nm, suggesting the increasing amount of AgBr and enlarged interactions between both components (AgBr and Ag). Furthermore, it can be clearly seen from Fig. 5 that the visible-light absorption ability of the as-synthesized Ag@AgBr samples was better than that of pure AgBr. It should be stated that essential understanding of the photoabsorption properties and mechanism of Ag@AgBr hybrids in the UV–vis DRS part demands more in-depth experimental and theoretical work and is still under investigation in our or other research group's laboratory.
UV–Visible diffuse reflectance spectra of (a) pure AgBr, and Ag@AgBr microspheres synthesized at different reaction time: (b) S-0.5, (c) S-1, (d) S-5.
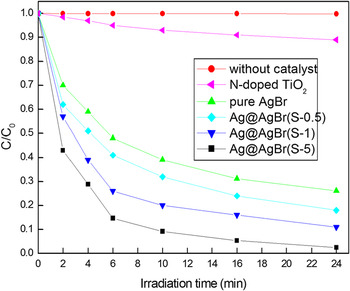
The photocatalytic activities of the as-synthesized pure AgBr and Ag@AgBr microspheres are shown in Fig. 6. C 0 and C in Fig. 6 are the initial concentration after the equilibrium adsorption and the reaction concentration of R6G, respectively. As can be seen in Fig. 6, R6G aqueous solution can be obviously decomposed by the Ag@AgBr microspheres under visible-light irradiation. By contrast, when pure AgBr substitutes for Ag@AgBr sample as the photocatalyst, the degradation of R6G takes place at a much slower rate under the same conditions. For example, the degradation ratio of R6G is nearly 85.3% over 0.15 g of the Ag@AgBr (S-5), which is higher than only 52% over 0.15 g of pure AgBr and N-doped TiO2, when irradiated by the visible-light for 6 min. It is worth noting that the decomposition ratio of 0.3 g R6G is 57% over 0.15 g of this Ag@AgBr (S-5) under visible-light irradiation only for 2 min. As can also be seen in Fig. 6, the synthesis conditions of core–shell Ag@AgBr microspheres affect their photocatalytic activities in degrading R6G under the visible-light irradiation. Among the three Ag@AgBr products, the Ag@AgBr sample (S-5) has the highest photocatalytic activity, which can achieve a R6G degradation ratio of 97.5% within 24 min.
Photodegradation of R6G using 0.15 g of the as-synthesized photocatalysts under visible-light (λ > 420 nm) irradiation.

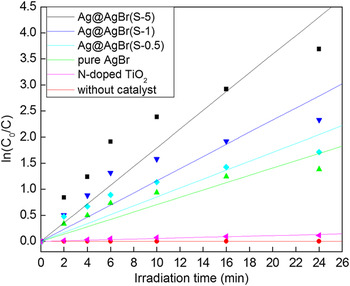
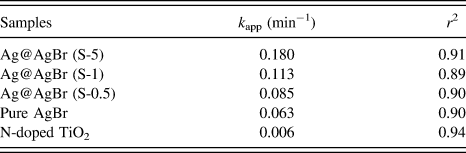
For a better understanding of the photocatalytic activities of pure AgBr and the as-synthesized Ag@AgBr, the kinetic analysis of R6G degradation is also discussed in terms of Langmuir Hinshelwood model, which is shown in Fig. 7 and Table II. At low R6G concentrations, the above model can be described as the first-order kinetics model Reference Wu, Shen, Zhang and Huang35,Reference Yang, Li, An, Gao and Fu36 : ln(C 0/C) = k app t, where C 0 and C are the initial and reaction concentration of R6G, k app is the apparent rate constant, and t is the reaction time. Figure 7 plots the kinetic curves for R6G degradation, and a linear relationship was observed between ln(C 0/C) and the reaction time (r 2 > 0.88). The apparent rate constants (k app) of R6G, obtained from the slopes, are listed in Table II. It can be observed from Table II that the photodegradation of R6G by the as-synthesized samples followed the first-order kinetics. Furthermore, as can be seen in Fig. 7 and Table II, the photocatalytic activity of the Ag@AgBr sample (S-5) is higher than Ag@AgBr (S-0.5) or pure AgBr for the photodegradation of R6G under the same conditions. For example, the k app of Ag@AgBr (S-5) is 0.180 min−1, which is nearly three times as that of pure AgBr.
The kinetic curves of the as-synthesized photocatalysts for R6G degradation.

Degradation parameter of R6G by the photocatalysts.

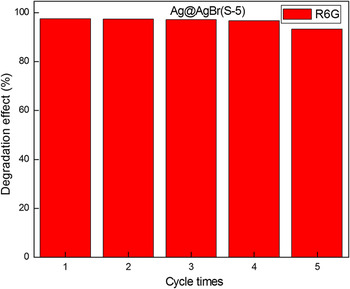
Because stability and reusability are of great concern to silver halide based photocatalysts, it is obliged to examine the stability and reusability of the as-synthesized pure AgBr and Ag@AgBr samples in photocatalytic degradation of aqueous R6G. Hence, in this study, the Ag@AgBr sample (S-5) was recycled for five times in photocatalytic degradation of aqueous R6G under visible-light (λ > 420 nm) irradiation. After each cycle which lasted 24 min, the photocatalyst was separated from the aqueous suspension by centrifugation, washed with deionized water, and dried in vacuum at 50 °C for 12 h. Figure 8 shows the recycling test of Ag@AgBr (S-5) in photocatalytic degradation of aqueous R6G under visible-light (λ > 420 nm) irradiation. Evidently, Ag@AgBr (S-5) exhibited good stability and reusability in photocatalytic degradation of aqueous R6G. For example, even in the fifth cycle photocatalytic use of Ag@AgBr (S-5), the degradation ratio of R6G can still reach 93.2% when subjected to visible-light irradiation for 24 min. The high visible-light photocatalytic activity and excellent photochemical stability suggest that the as-synthesized Ag@AgBr may be a promising photocatalyst in removing stable azo dyes pollutants from wastewater. For comparison, the stability of pure AgBr sample was also studied in photocatalytic degradation of aqueous R6G. The XRD results revealed that the as-synthesized pure AgBr sample was unstable when it was used in our photocatalytic reaction and Ag2O phase was found in the XRD patterns (shown in the supporting information) of the product of pure AgBr sample recovered after the first cycle photocatalysis. Compared with pure AgBr, the enhanced photocatalytic stability of Ag@AgBr was ascribed to the plasmonic Ag in the Ag@AgBr photocatalyst and the possible mechanism can be found in the previous literature. Reference Zhang, Ai, Li and Jiang26,Reference Yu, Fan, Meng, Yang, Cao and Li18 Based on the FESEM and HRTEM results of the as-synthesized Ag@AgBr photocatalysts, the formation of the as-synthesized Ag@AgBr heterojunction structure is uniform, which enlarged the interface between the AgBr and Ag. The enlarged interface between two components accelerated the separation and migration of electrons and holes and led to the high photocatalytic activity. Reference Dai, Lu, Dong, Ji, Zhu and Liu20,Reference Li, Wang, Zhang, Hu, Chen and Guo21 In the Ag@AgBr hybrid system, photons from the visible-light irradiation could be absorbed by AgBr and Ag0, and the photogenerated electrons and holes were produced. Synergy effect between Ag microspheres and the polarization field provided by the AgBr facilitates electron–hole separation and interfacial charge transfer. As a result, electrons accumulate on the surface of the Ag microspheres to reduce desired species at the Ag/solution interfaces, while the left over holes diffuse into the AgBr to oxidize Br− ions to Br atoms, which are very reactive for oxidizing species in the surrounding solutions. Reference Zhang, Ai, Li and Jiang26 The Br atoms will be reduced back to Br− ions. As a result, redox reactions of organic pollutants can be driven by visible light. It should be stated that essential understanding of the possible mechanism of the enhanced photocatalytic activities and stability of Ag@AgBr hybrids in the photocatalytic activity part demands more in-depth experimental and theoretical work and is still under investigation in our or other research group's laboratory.
Reuse experiment for Ag@AgBr microspheres (S-5).

IV. CONCLUSIONS
Ag@AgBr core–shell microspheres were successfully obtained by a very simple wet-chemical route, and verified by XRD, XPS, FESEM, HRTEM, BET, EDXRF, and DRS measurements. The proposed method is simple, mild, and cost-effective, which may be suitable for industrial production of Ag@AgBr core–shell microspheres. UV–visible diffuse reflectance spectra indicate that the as-synthesized Ag@AgBr core–shell microspheres had optical capability nearly in the whole range of visible-light spectrum. The photocatalytic results show that these Ag@AgBr core–shell hetero-photocatalyst exhibit much higher photocatalytic activities and structural stabilities than those of the pure AgBr catalyst under visible-light irradiation. Although this study is related to the AgBr system, we believe that this strategy could also be adopted for the preparation of other Ag-based semiconductor heterostructures, such as Ag3PO4/Ag, AgCl/Ag, Ag2S/Ag, Ag2WO4/Ag, AgVO3/Ag, etc., which may have promising applications in photocatalysis.
ACKNOWLEDGMENTS
This is a project funded by the Science & Technology Innovation Fund of Yangzhou University (2013CXJ088). Thanks also to The Testing Center of Yangzhou University for the XRD, HRTEM, FESEM, and UV–vis characterization.