1. Introduction
At retirement, pension participants must decide the type of pension distribution that they believe will maximize their utility over the rest of their lifetime. Private sector defined benefit pension plans are regulated by the Employee Retirement Income Security Act (ERISA), which specifies how various distribution options are priced and requirements concerning the choice of annuities. In general, public sector plans are not covered by ERISA, so government agencies have greater flexibility in determining the provisions of their retirement plans. Moreover, state and local government employees often retire in their 50s because public sector defined benefit plans typically allow career retirees to begin benefits at relatively young ages. Thus, state and local employees must select the payout method that maximizes their well-being over 30 or more years of retirement. In this environment, retirees face a complex decision in choosing the annuity option that will maximize their lifetime utility. Poor choices based on insufficient information or knowledge may result in unanticipated outcomes and cause retirees to express regret about their pension decisions later in retirement.
This paper analyzes annuity choices by pension participants using administrative records and survey data on North Carolina public sector retirees from 2009 to 2014. The estimation follows a nested logit regression model, which allows a flexible correlation structure for the unobserved factors affecting annuity choice. In a sample of married retirees, we find important roles for gender, race/ethnicity, own and spouse's life expectancy, and age and spouse's relative age in determining who elects each payout option. Prior research, focusing primarily on choices by retirees in private sector plans, has explored the tendency of individuals to under-annuitize wealth.Footnote 1 In sharp contrast to pension distributions chosen by private sector workers, retirees in the public sector rarely select lump sum distributions because of the way they are typically priced (Chalmers and Reuter, Reference Chalmers and Reuter2012). Public sector retirees generally have the option of selecting from a menu of lifetime annuities or a lump sum distribution. Under ERISA, private sector plans must have a default annuity option of a joint and survivor benefit (J&S) with at least 50% of the joint benefit payable to the survivor and the pricing of annuity options must meet certain requirements.Footnote 2 In the public sector, there is not typically a default annuity option and often annuity options are priced so that they are present value neutral to the retirement system. Thus, it is important to understand why retirees choose an annuity and how these decisions affect retirement well-being.
This study uses the North Carolina Retirement Transitions Study-Benefit Claimants (NCRTS-BC) data. The data consist of administrative records for state and local government retirees in North Carolina who initiated retirement benefits between 2009 and 2014, merged with two waves of survey data. We focus on married retirees which allows us to study the role of spousal characteristics in annuity choice. This is best suited for cases when a married individual's spouse would be their beneficiary had they chosen a J&S annuity option. While we cannot directly test this assumption, we find evidence that is consistent with spouses as the vast majority of beneficiaries for married individuals.Footnote 3 For these married retirees, the spousal characteristics are drawn from a retirement decision-making survey conducted in 2015 (1 to 6 years after the claiming decision for these retirees). Finally, we study retirement well-being, including satisfaction with choices upon retirement and income security in retirement, which provides a snapshot of perceived well-being several years into retirement. Combining administrative records and responses to two surveys, our data provide a comprehensive picture of annuity choice among public sector retirees in North Carolina.
2. Background on North Carolina retirement plans and annuity options
We examine the provisions of public retirement systems of North Carolina and the annuity choices of recent retirees. The retirement plan for teachers and state employees and the state-managed pension plan for local employees in North Carolina are typical of state and local pension plans across the country. Teachers and state employees in North Carolina are covered by the Teachers’ and State Employees’ Retirement System (TSERS), while local government workers participate in the Local Governmental Employees’ Retirement System (LGERS). Almost all participants in both plans are also covered by Social Security and TSERS pension annuitants are also allowed to remain in the state health plan.Footnote 4
The parameters of TSERS and LGERS are very similar. In order to qualify for normal or unreduced benefits, the employee must have satisfied one of three criteria: reached age 65 with 5 years of membership service; reached age 60 with 25 years of service; or have attained 30 years of service at any age. Early retirement with reduced benefits is available to those who have reached age 50 and completed 20 years of creditable service and those who have reached age 60 and completed 5 years of service. Thus, for many public employees in North Carolina, these plans provide a strong economic incentive to retire in their 50s.
Upon termination and achieving the age and service requirements, retirees must request from the retirement system that their benefits begin and choose an annuity option. This is a one-time option and no benefits are paid until the benefit request has been finalized. In other words, there is no default benefit. Both plans have the same six annuity options, which include a single-life annuity (called the maximum benefit), a 100% J&S, a 50% J&S, Social Security Leveling, and two additional J&S options with a pop-up provision if the retiree's beneficiary dies first. Plan actuaries set the terms of all annuity options so that they are considered present value neutral to the system.Footnote 5 There is also an option to take a lump sum withdrawal, but most benefit claimants with long careers find that the present value of the annuity greatly exceeds the lump sum (Clark et al., Reference Clark, Morrill and Vanderweide2014).
3. Annuity options in the North Carolina retirement plans
We now present a more detailed discussion of the pricing of the annuity options. The benefit formula in the plan indicates the monthly retirement benefit that a retiree would receive from claiming until death. As discussed earlier, the retirement benefit is a function of years of service and final average salary. This is a single-life annuity that is called the maximum benefit.Footnote 6 Once the conditions for unreduced retirement are satisfied, the monthly benefit does not depend on age.
To determine the monthly benefit for other annuity options, the first step is to calculate the expected present value of the maximum benefit.Footnote 7 First, define PV[A] to be the present value of a $1 per year benefit payable in equal monthly payments for the life of an individual age A:
 $$PV\lsqb A \rsqb = \mathop \sum \limits_{a = A + 1}^{120} \displaystyle{{{\rm Survival}_A^a} \over {{\lpar {1 + r_i} \rpar }^{a-A}}} + CtsAdj$$
where Survival is the probability of survival from age A to age a, r i is the assumed interest rate, and CtsAdj is the industry-standard 11/24th adjustment for monthly payment. Then the present value of the monthly maximum benefit, B MAX, can be written as:
 $$PV_{{\rm MAX}}\lsqb A \rsqb = B_{{\rm MAX}} \times 12 \times PV[A]$$
This calculation is based on the mortality experience of the system and the assumed rate of return on the pension fund. Prior to 2012, the interest rate was 7.5%; however, the rate was changed to 7.25% in 2012. Thus, for individuals with the same career history, the present value of the maximum benefit decreases as age of claiming increases and there will be a small increase in present values for those claiming benefits after 2012.
Having calculated the present value of the maximum benefit, the retirement system then calculates a monthly benefit for each of the other five annuity options using the same basic assumptions.Footnote 8
3.1 Joint and survivor annuities
The state provides four J&S options that provide for the continuation of benefits after the death of the retired worker that are paid to the survivor until his or her death. The first option offered by the North Carolina retirement plans is a 100% J&S benefit, which results in the retirement benefit being the same as long as either the retiree or survivor is alive. For the present value of this annuity to be the same as that of the maximum benefit, monthly benefits must be lower as a result of longer expected lifespan of two beneficiaries combined. The price of this insurance for a lifetime benefit, or the magnitude of the reduction in monthly benefits, depends on the age of the retiree and the age of the survivor. The popup 100% J&S option is similar to the 100% J&S option, except that the retiree will get the full maximum benefit should the beneficiary die prior to the retiree. To calculate the present value of the J&S benefit, first define the present value of a $1 per year benefit payable in equal monthly payments if and only if both annuitants are living:
 $$PV_{Joint}\lsqb {A,S} \rsqb = \left( {\mathop \sum \limits_{a = A + 1,s = S + 1}^{a = 120,s = 120} \displaystyle{{{\rm Survival}_{A,S}^{a,s}} \over {{\lpar {1 + r_i} \rpar }^{a-A}}}} \right) + CtsAdj$$
where Survival is the joint probability of the retiree surviving from age A to age a, and the spouse surviving from age S to age s. Then the present value of the monthly J&S benefit, B J&S, is:
 $$PV_{J\& S}\lsqb {A,S} \rsqb = B_{J\& S} \times 12 \times \lsqb {PV\lsqb A \rsqb + PctJ\& S \times (PV\lsqb S \rsqb -PV_{Joint}\lsqb {A,S} \rsqb )} \rsqb $$
where PctJ&S is either 50% or 100% depending on the option chosen.
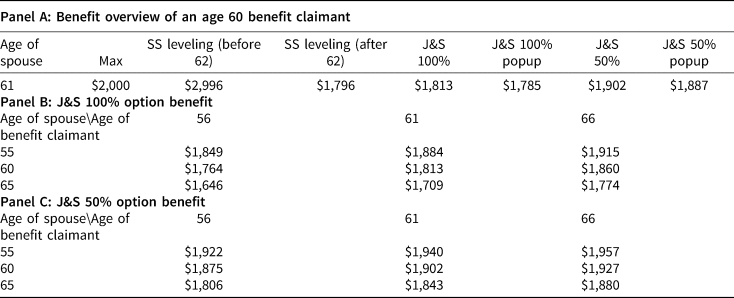
To illustrate how the price varies across retirees, we present hypothetical monthly benefits for several scenarios in Table 1. The mean married retiree in our sample claims benefits at age 60 and the retiree's spouse is on average 1 year older. Panel A shows the monthly benefit for a 60 year old claimant whose maximum benefit is fixed at $2,000 per month. Panel A assumes that the retiree's spouse is 61 years old. For such a retiree, the 100% J&S benefit is $1,813 per month, while the 50% J&S benefit is $1,902 per month. Since the benefit after the death of the retiree is lower with the 50% J&S option, the benefit while the retiree is alive is greater than the 100% J&S. The popup J&S options increase the benefits for the retiree if the beneficiary dies prior to the retiree. Relative to the standard J&S option without a popup provision, the monthly benefit will be lower if the popup option is selected: $1,785 and $1,887 per month for 100% popup and 50% popup J&S, respectively. Panels B and C show the effect of own and spouse age on the 100% and 50% J&S benefit, respectively. Moving right (up) in a given row (column) shows the benefit increase associated with an older beneficiary (younger retiree).
Monthly benefits of retirees

Note: The example is for a retiree with a maximum single-life benefit of $2,000 per month, and a Social Security benefit of $1,200 at age 60. The mean age at claiming is 60 and the mean spouse's age at claiming is 61 in the sample of retirees who responded to S2015.
3.2 Social security leveling
The final annuity option is called Social Security Leveling. Retirees selecting this option receive a higher monthly benefit prior to age 62 when an individual is first eligible to claim Social Security benefits and in return, the pension benefit is lower after age 62. The benefits before and after age 62 are calculated by the system, using the same assumptions as described before, so that the expected present value of the two leveling benefits is the same as the present value of the maximum benefit.Footnote 9 To calculate the present value of the leveling benefit, first define the present value of a $1 per year benefit payable in equal monthly payments that begin at age C for a retiree currently age A:
 $$PV\lsqb {A,Def\;C} \rsqb = \left[ {\left( {\mathop \sum \limits_{a = C + 1}^{120} \displaystyle{{{\rm Survival}_C^a} \over {{\lpar {1 + r_i} \rpar }^{a-C}}}} \right) + CtsAdj} \right] \times \; \displaystyle{{{\rm Survival}_A^C} \over {{\lpar {1 + r_i} \rpar }^{C-A}}}$$
Next define F[A,C] as follows:
 $$F\lsqb {A,C} \rsqb = PV\lsqb {A, Def\;C} \rsqb /PV[A]$$
Then the formula for the present value of the leveling benefit is:
 $$PV_{{\rm LEV}}\lsqb A \rsqb = B_{{\rm MAX}} \times 12 \times PV\lsqb A \rsqb + SS \times F \times 12 \times PV\lsqb A \rsqb -SS \times 12 \times PV[A, Def\;C]$$
where SS is the monthly benefit estimate obtained from the Social Security Administration.
Returning to Table 1, the hypothetical retiree shown claimed benefits at age 60 and was eligible for a maximum benefit of $2,000. The retiring worker reports to the retirement system that her expected Social Security benefit at age 62 is $1,200. Using this information and the leveling factor based on the system's mortality experience and the assumed interest rate, the system would calculate the benefit prior to age 62 and the benefit from age 62 through the rest of the life of the retiree. In this example, the retiree would receive a monthly benefit of $2,996 each month prior to age 62 and $1,796 each month beginning at age 62. Together with a Social Security benefit of $1,200, the post-62 total retirement income is ‘level’ at $2,996.
4. Data and descriptive statistics
We examine the annuity choices of recent retirees in North Carolina using a combination of administrative and survey data. The administrative records on individuals who first claimed pension benefits between 2009 and 2014 are from the NCRTS-BC data on retirees from the North Carolina TSERS, and LGERS. These data are merged with survey responses to a survey conducted in spring 2015 and a follow-up survey conducted in spring 2017.
The administrative records contain detailed information about each retiree including earnings, job information, years of service, creditable service, year of retirement, annuity option chosen, and benefit amount. The surveys gathered information about race/ethnicity, education level, household income and wealth, work status after claiming retirement benefits, and marital status, along with questions about their spouses’ characteristics (if applicable). In addition, the surveys included questions on retiree well-being and satisfaction with retirement-related decisions.Footnote 10 Measures of financial literacy and preferences toward risk and time are also elicited from the survey.Footnote 11 The first set of survey responses were received in 2015, which is 1 to 6 years after the retiree had made their annuity choice. Thus, some answers (such as wealth and health) may differ from those the individual might have given at the time of the retirement decision.Footnote 12
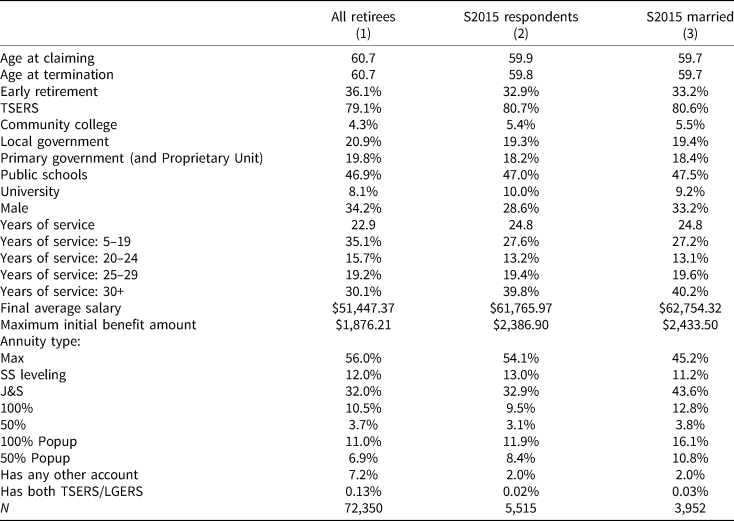
Table 2 presents summary statistics from the administrative records (column 1), the first survey respondents (column 2), and the first survey respondents who reported being married or living with partner (column 3, where we refer to both groups simply as married). The survey was sent to 27,434 individuals from the population in column 1. Our estimation sample includes 5,515 useable responses, which represents a survey response rate of roughly 20%.Footnote 13 Comparing columns 1 and 2, our survey sample is reasonably representative of the population of interest. Survey respondents have higher final average salary and maximum initial benefit amounts, and they were more likely to have more than 30 years of service at retirement.
Means of individuals claiming retirement benefits between 2009 and 2014

Notes: Only primary TSERS and LGERS accounts are included in the sample, as described in Appendix A. The second last row indicates the percent of the sample that has both a TSERS and LGERS account in the data.
From columns 2 to 3, we restrict the sample to survey respondents who are married. Our focus is individuals who consider both a single-life and J&S annuity; for married individuals considering a J&S annuity, their spouse represents a focal beneficiary. While unmarried individuals do choose J&S, their rates are much lower.Footnote 14 Further, the survey data provide information on spousal characteristics for married individuals and this information allows us to reconstruct the annuity benefit associated with each annuity option, assuming the spouse would have been the beneficiary. Comparing columns 2 and 3, the restriction to married respondents changes the sample in relatively minor ways. There are a larger proportion of males in column 3 and, consistent with the arguments above, a larger proportion of men choose J&S.
For all married survey respondents in column 3, the average retiree is around 60 years of age upon retirement. Around 48% of all retirees are teachers, 19% are local government employees, and 18% are state government employees. In general, the public sector tends to be majority female and the North Carolina data are consistent with this observation, as 66.8% of the married respondents are women. In total, 40.2% of married respondents retired with 30 or more years of service, while the average final salary is $62,754.32 and the initial benefit check had the retiree chosen the Maximum Benefit annuity option is $2,433.50 on average.
5. Theoretical predictions regarding saving and borrowing in retirement
We offer several predictions for various individual and household characteristics that may influence annuity choice. Individuals with higher personal discount rates place greater value on money in the early retirement years. Thus, they are expected to favor a single-life annuity instead of a J&S annuity and among those requesting such a benefit, Social Security Leveling should be more appealing than the maximum benefit. Given that the retiree prefers a single-life annuity, those with lower life expectancies will be more likely to choose leveling. Between the single-life annuity and J&S annuity, retirees will be more likely to choose a J&S annuity if they have low life expectancy and are married to spouses with high life expectancy, holding age constant. Since the retirement system prices the annuity options based on a blended life expectancy between men and women, the leveling option is relatively more favorably priced for men with average life expectancy than for women with average life expectancy.
The work history of the spouse is expected to directly influence the annuity choice. If the spouse has been a career worker and expects to receive a pension in his or her own right, the retiree is predicted to be less likely to request a J&S benefit since the spouse expects to receive this benefit after the death of the retiree. Other employer-provided benefits earned by the spouse or the retiree or purchased by the household, such as retiree health insurance, long term care insurance, or life insurance (LI), should also should define the optimal annuity choice. LI could be considered a substitute for J&S benefits, i.e., similar to the lower benefit required by J&S in that individuals pay a premium for LI to provide funds for the beneficiary. The predicted effect for years of service on the annuity choice is ambiguous. On the one hand, longer tenure is generally associated with higher pension benefits, which may reduce the demand for higher income immediately after retirement. However, shorter tenure might be related to retirement at younger ages with the intension to pursue a second career.
As shown in Appendix Table B3, men are much more likely to choose a J&S annuity compared to women (61% compared to only 35%). We note that gender is highly correlated with many of the other variables that affect annuity choice and as such, gender may serve as a proxy for other characteristics. To the extent that the benefit level is correlated with household finances, we expect that those with higher benefits are more likely to have alternative sources of liquidity. Moreover, higher earners have a longer life expectancy, on average (Galama et al., Reference Galama, Lleras-Muney and van Kippersluis2018). As such, they may be more willing to defer some of their pension income by selecting one of the J&S options. Similarly, those without a college degree tend to have lower life expectancies, so lower educated retirees may be more likely to choose leveling due to shorter life expectancy. To the extent that race/ethnicity correlates with life expectancy, we expect that non-Hispanic blacks are more likely to choose leveling than non-Hispanic whites.
Holding constant mortality expectations, personal discount rate, and the absolute level of benefits, we find no clear prediction on the relationship between age at claiming and annuity option choice. Note that the age of the retiree and the spouse determines the reduction in benefits associated with a J&S annuity. Next, while individuals in poor health may have lower life expectancies, the prediction for the relationship between poor health and annuity choice is ambiguous (McGarry, Reference McGarry2014). Individuals may require additional funds for medical expenditures if they are in poor health or may want to consume more during a period of good health.
Among those who prefer a single-life annuity, risk aversion could manifest itself in a preference for leveling if near-term consumption shocks are predominant in one's decision process. However, if mortality risk (i.e., dying young) is predominant, then one is likely to prefer immediate consumption and therefore choose leveling. If instead an individual is worried about longevity risk (i.e., outliving one's savings), the individual is less likely to prefer leveling so that the benefit in later years is higher. Thus, the prediction on risk preferences is ambiguous.
It is important to remember that the annuity choice is a difficult and complex decision, which will influence well-being throughout the retirement years. Knowledge concerning the annuity choices, how the benefits are calculated, and how they may change over time and in response to specific events are crucially important (Chan and Stevens, Reference Chan and Stevens2008). However, we have no prediction on how financial literacy might affect which annuity options is chosen.
6. Regression analysis of annuity choice
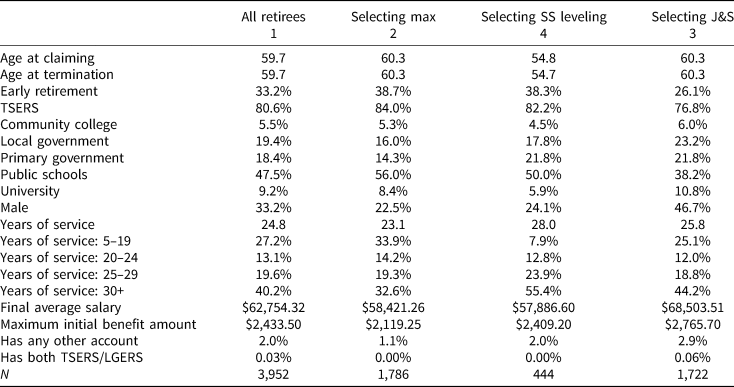
We first examine the annuity choices of recent retirees in North Carolina through analyzing mean characteristics of those choosing each annuity option. The first column in Table 3 reproduces column 3 of Table 2, while columns 2–4 of Table 3 split the married respondent sample among the three annuity options.
Means of married S2015 respondents claiming retirement benefits between 2009 and 2014

Notes: Only primary TSERS and LGERS accounts are included in the sample, as described in Appendix A. The second last row indicates the percent of the sample that has both a TSERS and LGERS account in the data.
Comparing columns 2–4, the characteristics of those choosing the three annuity options are quite different along several dimensions. Those choosing leveling tended to be younger at retirement (which is intuitive because leveling is only possible for those retiring under 62), had lower salaries, and had more years of service. Those choosing J&S tended to have higher salaries and were eligible for more from the retirement system in the form of higher benefits had they chosen the maximum benefit. A meaningfully higher proportion of men chose a J&S annuity relative to women. These are univariate differences along correlated dimensions, so now we conduct a regression analysis to explore ceteris paribus associations.
Our main regression analysis is estimated using data from married respondents to the first survey, as shown in column 1, Table 3. As mentioned above, we include individuals who reported that they are married or living with partner and simply say married. The survey of retirees provides us with the opportunity to examine the annuity choice process utilizing personal information that is not available in the administrative records. Tables 4 and 5 present regression estimates from a nested logit regression model (McFadden, Reference McFadden, Manski and McFadden1981).Footnote 15 A nested logit model is a generalized multinomial logit model with less restrictive assumptions regarding the independence of the error terms affecting choice among each annuity option. Choice is nested and the error terms for options in the same nest can be correlated. In our setting, there are two nests: the single-life nest includes the Maximum Benefit and Social Security Leveling, while the J&S nest includes the four J&S options (two 100% and two 50 J&S options).
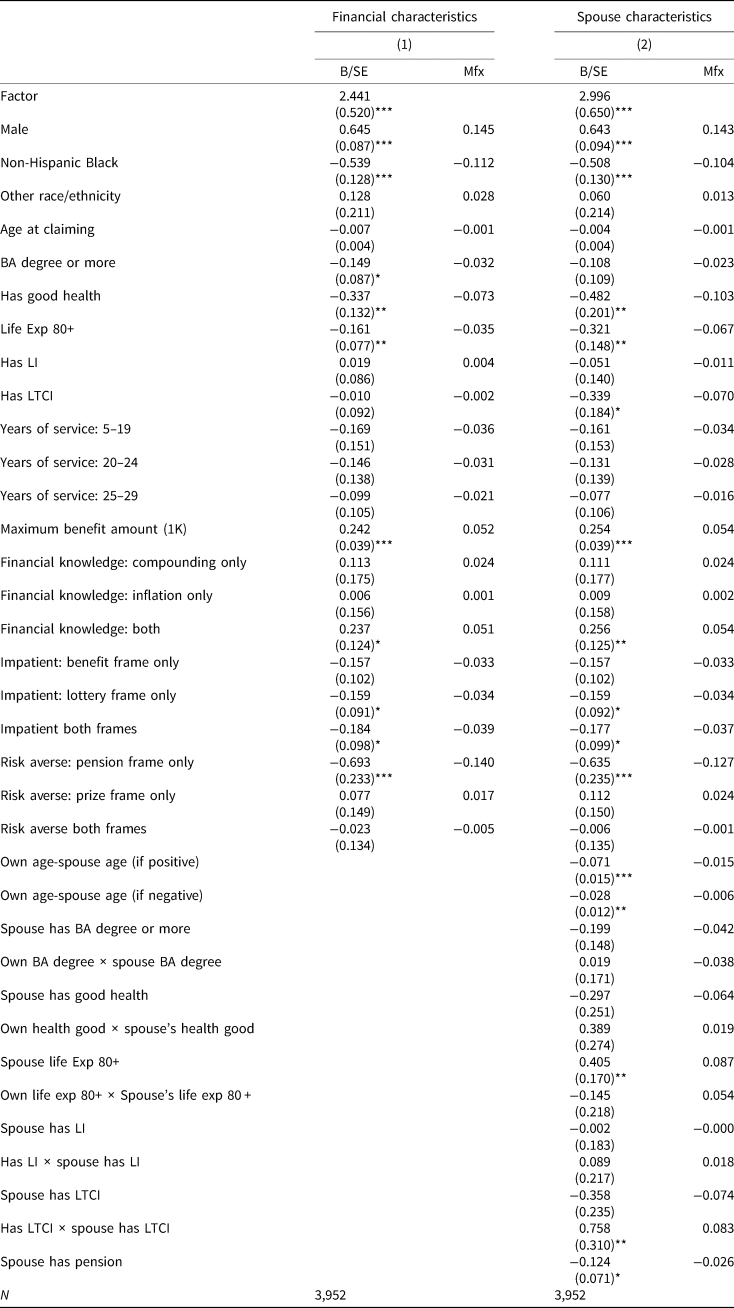
Nested logit regression results: determinants of J&S annuity choice

Notes: Data are from administrative records on pension benefit claimants merged with survey responses. Coefficients are estimates from a nested logit model with standard errors in parentheses. All specifications include agency type and year of claiming fixed effects and a dummy variable for Hispanic ethnicity (mean 0.005). *p < 0.1; **p < 0.05; ***p < 0.01.

Our nested logit regression analysis in Table 4 shows estimates at the ‘top level’ of the nesting structure, thus the coefficients reflect the effects of observable characteristics on the choice of J&S, with single life as the baseline. An alternative is a multinomial logit regression model; we show nested logit results because specification tests favor our nested logit regression model over this alternative.Footnote 16 Clark et al. (Reference Clark, Hammond, Morrill and Vanderweide2018a, Reference Clark, Hammond and Vanderweide2018b) provide an analysis of the choice of leveling, among individuals who chose a single-life annuity. Table 4 displays regression results and marginal effects. Column 1 includes the baseline covariates, while column 2 adds spousal characteristics. The results are similar in both columns, so we focus on column 2.
The first covariate is the only alternative-specific covariate in the model (i.e., varies across individuals and annuity options), which ensures identification of the nested logit model. In our setting, this is the annuity factor, defined as the ratio of the net present value of the annuity option relative to the net present value of the maximum benefit.Footnote 17 The factor coefficient is not our focus, and its positive coefficient simply says that a higher present value is preferred. We simply control for the annuity factor to ask how observable characteristics affect annuity choice.
Men are more likely to choose J&S, with a large effect size of 14.3 percentage points. This is consistent with the fact that men have shorter life expectancies, on average, which implies that the survivor benefit is valued more by men than women. We explore gender more in the next table. Non-Hispanic black retirees choose J&S at a 10.4 percentage point lower rate. Later age at claiming lowers the propensity to choose J&S, an effect of around 0.5 percentage point for 5 years older at claiming. We account for spousal age by constructing two age difference variables, the number of years the retiree is older if the difference is positive and separately the number of years younger if negative. Larger age gaps among spouses are associated with less choice of J&S, with 1.5 percentage points per year of difference if positive and 0.6 percentage points per year of difference if negative. The negative effect of age difference for retirees who are younger than their spouse might reflect the fact that the survivor benefit is less valuable to a retiree who is much younger. As shown in Table 1, younger spouses are associated with a lower J&S benefit, relative to maximum benefit, which probably explains the effect of positive age difference.
Next, reporting being in good health is associated with a 10.3 percentage point lower rate of choosing J&S; reported spousal good health also lowers J&S choice, but neither the level effect nor the interaction with spousal health is statistically significant. A retiree's perception of their life expectancy and his or her perception of their spouse's life expectancy both have the expected effect (while the interaction is not significant). Expecting a long life is associated with 6.7 percentage point lower rate of J&S choice, while expecting one's spouse to live a long life is associated with 8.7 percentage point higher rate of J&S choice. The survey also asked retirees whether they and/or their spouse had LI and long-term care insurance (LTCI) as well as whether their spouse had access to a pension from their current or previous employer (either currently receiving pension benefits or eligible to receive in the future).
While LI is not associated with J&S annuity choice, having purchased LTCI has a strong effect. Retirees with LTCI are 7.0 percentage points less likely to have chosen J&S, which suggests that these two products are substitutes. There is an effect of spousal LTCI, but it interacts with the covariate for both retiree and spouse having LTCI. Spousal pension also affects J&S choice: retirees whose spouse has their own pension are 2.6 percentage points less likely to choose J&S. Years of service has a monotonic effect, such that those retiring with less service are less likely to choose J&S. Each $1,000 additional in a retiree's initial benefit amount is associated with 5.4 percentage points higher rate of J&S choice.
Finally, we examine the effects of financial literacy and preferences toward risk and time on annuity choice. High levels of objective financial literacy (as measured by answering both questions correctly) are associated with a choice of J&S at a rate that is 5.4 percentage points higher relative to a single-life annuity. Time preferences affect J&S annuity choice as expected. Those who are measured as impatient on the lottery frame only and on lottery and benefit frames have 3.4 and 3.7 percentage points lower rates of J&S choice respectively. Risk preferences reveal one statistically significant association, where those who are measured as being risk averse on the pension frame chose J&S at a rate that is 12.7 percentage points lower. However, the risk results on the lottery prize frame and from retirees who answered consistently across both frames are opposite signed relative to the pension results. This suggests that the framing of our pension question, rather than risk preferences per se, may be at work here.
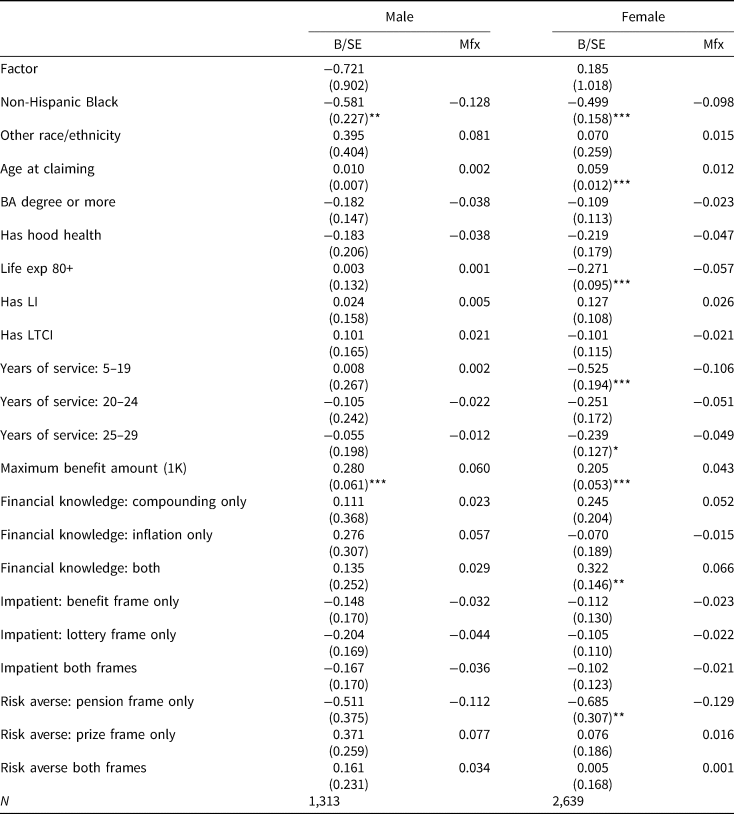
Next, we explicitly examine gender by presenting results for men and women separately. Table 5 estimates the baseline specification of Table 4 separately by gender. The results in Table 5 are similar to the aggregate results. Several coefficients are more precisely estimated for women, which may be driven by our larger female sample; notably, the negative effect of long life expectancy is driven entirely by women. Our main goal in separate gender estimation is to decompose the difference in J&S choice into observable differences among men and women.
In our sample of married public sector workers, 61.3% of men and 34.7% of women choose a J&S annuity, a 26.6 percentage point difference (see Appendix Table B3). Is this difference explained by observable characteristics that differ by gender? From Table 4, the predicted probability of choosing J&S (holding all covariates at their sample means) is 53.6% for men and 39.0% for women, a 14.5 percentage point difference. If the women in our sample had observable characteristics that took the same values as our men, then the predicted probability of choosing J&S would be 41.4% for women. Relative to the predicted probability reported above of 53.6% for men, the difference is 12.2 percentage points. In total, we can explain more than half of the gender difference in J&S choice by observable characteristics. The remaining gender difference represents the residual gender effect.
We place our public sector workers in context using private sector workers in the Health and Retirement Study (HRS) 2014 wave. Note that the sample of public sector workers in the HRS is very small, which emphasizes the importance of new data such as ours for this segment of the workforce. Restricting to married private sector workers in the HRS, 75.8% of men and 49.4% of women choose a J&S annuity.Footnote 18 Thus, both males and females in our sample choose J&S annuities at rates that are more than 10 percentage points lower than private sector workers in the HRS.Footnote 19 Overall, 43.6% of our sample chooses a J&S annuity, while 66.9% of married private sector workers in the HRS choose J&S, where the overall gap between J&S choice in our sample and J&S choice in the HRS is wider due to the larger proportion of women among our public sector workers.
In total, we find that retirees choose among annuity options in ways that are consistent with predictions over which individuals might benefit from each annuity option. J&S is more likely to be chosen by individuals for whom survivor motives are more salient (e.g., those with lower life expectancies such as males, those with low subjective life expectancy, and those whose spouse does not have alternative sources of retirement incomes such as a pension or LTCI). Leveling is more likely to be chosen by individuals whose near-term retirement income needs are more salient (e.g., those with low subjective life expectancy and those whose time preferences are consistent with impatience). To study retirement outcomes for individuals who chose different annuities, we now analyze self-reported retirement well-being.
7. Well-being in retirement
Is the choice of annuity an important determinant of well-being in retirement? Our surveys of retirees provide information on several measures of well-being in retirement, which we group into two sets of measures. The information measures are retirees’ satisfaction with their retirement choices and the information available upon annuity choice. The income security measures are retirees’ satisfaction with their standard of living, belief that they saved enough, and confidence in not outliving their savings. Each measure takes a positive value when the individual ‘agrees’ or ‘strongly agrees’ with the statements.Footnote 20
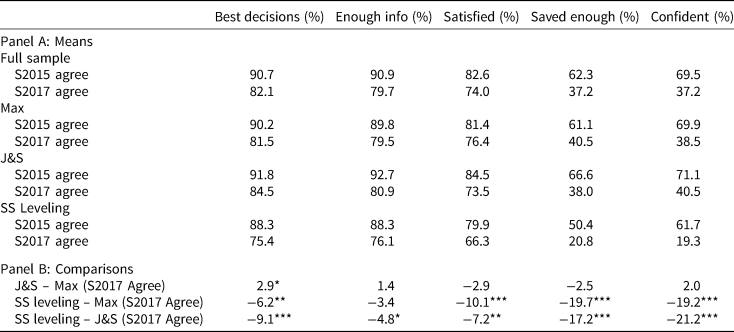
Table 6 presents means along each dimension of information and income security, shown separately using responses to the first survey in 2015 and from the follow-up survey in 2017 (S2015 and S2017, respectively). The sample in this, and the subsequent tables, is married individuals who claimed benefits between 2009 and 2014 who responded to both surveys.Footnote 21 First, we focus on the initial responses in 2015 and then turn to the follow-up responses in 2017. Among all married individuals in the first survey, we observe high rates of agreement with having made the best decisions regarding annuity choice and having had enough information upon retirement (both rates are over 90%). For income security, 82.6% of respondents are satisfied with their standard of living in retirement, while only 62.3% of respondents believe they saved enough and 69.5% are confident in not outliving their savings. Overall, we interpret these figures as being consistent with high rates of well-being in retirement but with magnitudes that vary with the framing of the question.
Retirement income well-being

Note: Data are from two surveys of individuals who initiated retirement benefits from 2009 to 2014 in 2015 and 2017. The sample is restricted to married individuals. ‘Agree’ refers to selecting ‘Strongly Agree’ or ‘Agree’ to the specified statement in 2015 or 2017 surveys. Asterisks in panel B indicate that the proportion of takers of an annuity option agreeing with the specified statement is statistically significantly different from the proportion of takers of another annuity option agreeing with the specified statement.
Individuals report lower levels of satisfaction with information and income security, on average, 2 years after the original survey. Table 7 presents additional information on changes between the two surveys, but it is clear that the means are lower in 2017 along every dimension. Comparing responses across individuals who chose different annuity options, J&S annuitants are similar to maximum benefit annuitants with the exception of satisfaction with annuity choice, where J&S is associated with 2.9 percentage points higher satisfaction. Relative to J&S or maximum benefit, leveling is associated with less satisfaction in terms of information and income security. Those who chose leveling are particularly unlikely to report belief in having saved enough and unlikely to report having confidence in not outliving their savings, which is also documented in Clark et al. (Reference Clark, Hammond, Morrill and Vanderweide2018a, Reference Clark, Hammond and Vanderweide2018b).
Retirement income well-being in S2015 and S2017

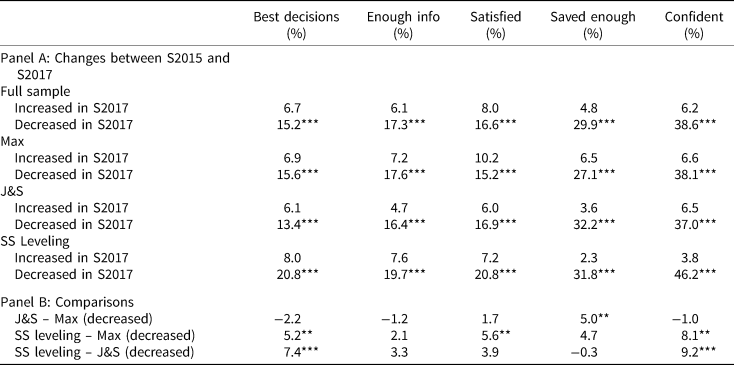
Note: Data are from two surveys of individuals who initiated retirement benefits from 2009 to 2014 in 2015 and 2017. The sample is restricted to married individuals. An ‘increase’ refers to agreeing with the specified statement in 2017 survey but not 2015. A ‘decrease’ refers to agreeing with the specified statement in 2015 survey but not 2017. Asterisks in panel A indicate that the proportion of individuals whose well-being decreased between surveys is statistically significantly different from the proportion of individuals whose well-being increased between surveys, among those with a well-being change. Asterisks in panel B indicate that the proportion of takers of an annuity option with a well-being decrease between surveys is statistically significantly different from the proportion of takers of another annuity option with a well-being decrease.
Table 7 reports the proportion of individuals who increased or decreased along each dimension from the original survey to the follow-up survey. The statistical test results shown in panel A are from tests of whether changes are equally likely to be increases and decreases. For each cell, decreases are statistically significantly more likely than increases. Thus, perceived retirement well-being decreases for these individuals. Panel B compares measures across annuity options, where the statistical test results are from tests of whether the proportion of individuals reporting less satisfaction is different across annuity options.
Relative to maximum benefit, individuals who chose J&S are similar with the exception of belief in having saved enough, where J&S is associated with a larger decrease in satisfaction (5.0 percentage points). Relative to maximum benefit, for individuals who chose leveling, the decrease between the two surveys is statistically significantly larger for leveling in terms of having made the best annuity choice decision, satisfaction with standard of living, and confidence in not outliving their savings. Overall, we find small differences among maximum and J&S annuitants, but large differences between leveling annuitants and others. Those choosing leveling are less satisfied and more likely to report lower satisfaction over time. This result should not be surprising since many of those that selected leveling will have reached age 62 and would have had their pension benefit reduced by the specified formula.Footnote 22
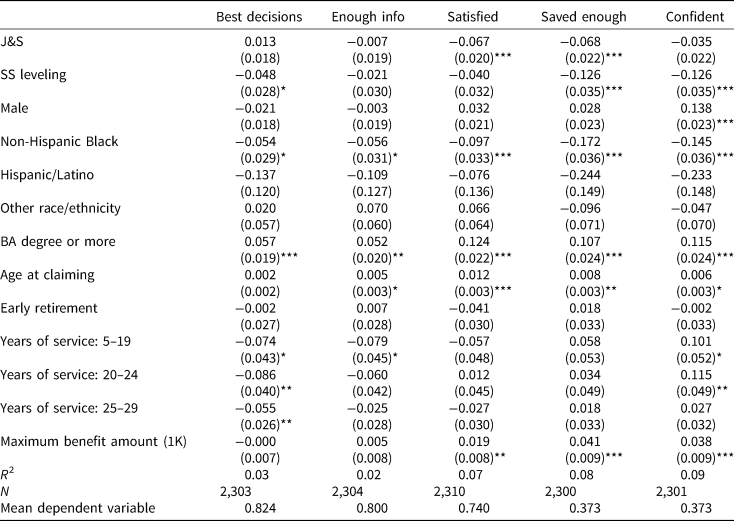
Finally, Table 8 presents a regression analysis of these five measures using the responses to the follow-up survey in 2017, which is 3 to 8 years after the claiming decision for these retirees. Using the follow-up survey responses allows us to measure retirement well-being several years into retirement. The results shown in Table 8 were obtained following the same approach used in Clark et al. (Reference Clark, Hammond, Morrill and Vanderweide2018a, Reference Clark, Hammond and Vanderweide2018b) to examine whether choosing Social Security Leveling option affected retirement well-being. Each column presents the results from a linear probability model. J&S is similar to maximum benefit on some measures, but J&S is associated with less satisfaction with their standard of living in retirement (6.7 percentage points) and less belief in having saved enough (6.8 percentage points). Consistent with the comparison of means, leveling is generally associated with less satisfaction than maximum benefit: 4.8 percentage points less satisfied with annuity choice decision, 12.6 percentage points less satisfied with having saved enough, and 12.6 percentage points less confident about not outliving their savings. In total, leveling is associated with less perceived well-being in retirement, with large effect sizes.
Retirement income well-being regression results

Notes: Data are from a survey of individuals who initiated retirement benefits from 2009 to 2014. Administrative records as of spring 2015 and survey responses are as of spring 2017. The sample is restricted to married individuals. Dependent variables are indicated in the column headings. Coefficients are estimates from a linear probability model with standard errors in parentheses. All specifications include agency type and year of claiming fixed effects. Details are provided in the appendix. ***p < 0.01, **p < 0.05, *p < 0.1.
The other covariates in Table 8 provide additional insights regarding the characteristics associated with well-being in retirement. Males are much more confident in not outliving their savings than females, but they do not believe they saved enough at higher rates and are not more satisfied with their standard of retirement living. Non-Hispanic black retirees report less satisfaction along all dimensions, with large effect sizes. Individuals with at least a BA degree report more satisfaction, as do those who claimed at older ages. Interestingly, those with higher initial benefit checks report more satisfaction with their well-being in terms of income security, but they are no more likely to report satisfaction in terms of information/decision quality.
The results in Table 8 do not provide causal interpretations because these covariates are correlated with a host of unobserved factors that limit precise interpretations. However, controlling for these observed factors, we find that individuals who chose different annuities upon retirement report different levels of satisfaction in retirement. J&S annuitants are somewhat less satisfied than maximum benefit annuitants in terms of income security (standard of living and saved enough). Leveling annuitants are less satisfied than maximum benefit annuitants in all five measures, with statistically significant differences for three measures.
8. Conclusions
Using combined administrative records and survey data, we analyze how individuals choose among annuity options at retirement. Several findings are particularly relevant to policymakers. First, only 44% of North Carolina public sector retirees select a J&S annuity. This is much lower than the rate of 67% that we document among private sector workers in the HRS. Some portion of the difference between our finding and those from the HRS may be due to differences among the private sector workers in the HRS and our public sector workers. However, we conjecture that there is an important role played by ERISA regulations for a J&S default annuity, which does not cover the plans we study.
Second, as has been found previously, males are much more likely than females to choose a J&S annuity. Our regression analysis controls for a large set of individual and household characteristics and holding these constant, the results suggest that men value survivor benefits more than women. Men are also more likely to choose J&S when their spouse does not have access to a pension of their own, while a spouse's pension plays a less important role for women in the choice of annuity. We decompose the gap between men and women in the choice of a J&S annuity; observable characteristics explain more than half of the gender difference, but a sizeable gap remains. Annuity choice appears to be a household decision that involves bargaining between household members in ways that are consistent with predictions over which households might benefit most from each annuity option.
Our final analysis exploits the panel nature of our survey data to track self-reported well-being several years into retirement. Retirees who made different annuity choices report very different levels of well-being in retirement and changes in well-being also differ markedly. The Social Security Leveling annuity option (which provides a level retirement income before and after age 62) is associated with substantially less retirement income security, relative to the Maximum Benefit or a J&S annuity. J&S annuitants are relatively similar in their self-reported well-being with respect to those who chose the Maximum Benefit, but there is some evidence that the Maximum Benefit is associated with slightly higher levels of retirement income security. In total, the annuity an individual chooses matters a lot for their outcomes in retirement.
Supplementary material
The supplementary material for this article can be found at https://doi.org/10.1017/S1474747218000410.
Acknowledgement
We thank Melinda Sandler Morrill, whose contributions at an earlier stage of this project are greatly appreciated. This research is part of an on-going project that is being conducted in partnership with the North Carolina Retirement Systems Division and is being funded by the Sloan Foundation, Grant Numbers 2013-10-20 and G-2016-7054. We gratefully acknowledge the help and support of Janet Cowell, former North Carolina State Treasurer, Steven C. Toole, Director of the Retirement Systems Division, Mary Buonfiglio, Deputy Director of Supplemental Retirement Plans, and Sam Watts, Policy Director of the Retirement Systems Division; Nino Abashidze, Bryan Allard, Christelle Khalaf, Siyan Liu, Aditi Pathak, and Emma Turner for research assistance; and Jonathan Reuter and participants at the NBER Conference on Incentives and Limitations of Employment Policies on Retirement Transitions for comments and suggestions. The opinions and conclusions expressed herein are solely those of the authors and do not represent the opinions or policy of the North Carolina Retirement System or any other institution with which the authors are affiliated.