





1. Introduction
1.1. Background
Historically, Design instruction was organised and articulated through the medium of crafts like sculpture and architecture, where a specific clan was involved in training apprentices under a full-time practitioner of the craft. The science of this craft was later formalised into treatises such as De Architectura in ancient Rome (Morgan Reference Morgan1914) and the Vāstushāstra in India (Balaram Reference Balaram2005) for architecture. Nevertheless, its instruction with a prescribed syllabus, as practised in the design schools of today, is an offshoot of the Bauhaus school of design (Findeli Reference Findeli2001) founded in Germany to address the surging need for mass production in the early twentieth century. Apprenticeship prevailed as the mode of learning even then, bounded within a particular discipline of design practice. Later, researchers (Simon Reference Simon1969) realised the all-pervasive nature of design activity, which includes identifying and solving ill-structured problems in every profession and championed the need to impart design fundamentals in tertiary professional education as well. Recent studies (Lawson Reference Lawson1980) claim this might be too late, as specialisation begins at school itself.
Evidently, this need has been addressed by integrating design into the school curricula via:
-
1. design certification in arts or technology; and
-
2. design thinking as a pedagogy for teaching regular subjects like science (Zhu et al. Reference Zhu, Shu, Tian, Sun and Luo2024), mathematics (Painter Reference Painter2018) and geography (Carroll et al. Reference Carroll, Goldman, Britos, Koh, Royalty and Hornstein2010).
However, instead of empowering the young minds, strategy 1 was found to straightjacket them too soon into specialisations (Lawson Reference Lawson1980), while strategy 2 found it hard to simulate the entire design process due to the evolving levels of the cognitive maturity of the child (Campbell Reference Campbell2019). Despite its shortcomings, the former seems to dominate the most widely adopted curricula across the globe, namely the International General Certificate of Secondary Education with its Arts and Design and Design and Technology coursebooks; and in India (where the authors hail from), namely the Central Board of Secondary Education by prescribing exclusive coursebooks for Design Thinking and Innovation and Tinkering Lab at the secondary level (Piaget & Inhelder Reference Piaget and Inhelder1969). While the course in arts is studio-centric (Schön Reference Schön1983), the course in technology is laboratory-centric. Using such specialised courses to teach an interdisciplinary domain as design is not only inadequate but also defeats the fundamental purpose of education, viz., “to develop holistic and well-rounded individuals” (MoE 2020). Hence, it has become imperative to redefine foundational design learning.
1.2. Rationale
In addition to the identification of the aforementioned shortcomings of the prescribed courses in design, a reconnaissance survey of Indian schools further revealed that these courses were handled by teachers of traditional subjects. This extrinsic lack of design-oriented training in teachers, along with the intrinsic disciplinary bias of the curriculum, made teaching and assessing the design learner even more daunting. To overcome these inadequacies and ensure effective learning among design learners, a Competence-based assessment is advocated here. Its potential to evolve a standard for the design curriculum towards developing the learners’ ability to “understand the world, to grapple with its issues, to act, and to develop further knowledge” (MoE 2023) also has to be tapped. Therefore, Design Competence is defined as the ability to perform any design task effectively (Horvath Reference Horvath2006). Studies so far have discussed the nature of this ability in extensive detail, but they have not addressed the types of tasks that can be administered for its assessment. Hence, the current study aims to plug this lacuna.
1.3. Aim and objectives
Aimed at characterising design tasks for assessing Learners’ Design Competence (LDC), the objectives of the current study are defined as follows:
-
1. To identify the primary factors that determine a design task;
-
2. To validate the comprehensiveness of these factors across the design disciplines;
-
3. To propose a standard code for defining the design tasks and evaluate its application.
1.4. Scope and significance
The current study is an extension of the authors’ earlier work on “Understanding the construct of Design Competence” (Sona, Biswas, & Chakrabarti Reference Sona, Biswas and Chakrabarti2026), in which an existing model relevant to explain this construct was identified, validated and revised into a Design Task Ontology. The evolution of this ontology is further elucidated through its multiple iterations, based on theoretical and empirical observations. Furthermore, a cross-disciplinary validation of the ontology, checking for its content and criterion validity, is also done. It is considered that this will not only enhance its applicability and dependability for framing design tasks but also will pave the way for unifying the competence-based assessment across disciplines, especially for design learning at the foundational level.
2. Literature review
Evolutionary biology considers competence as the fundamental human capacity to interact with one’s environment effectively (White Reference White1959). It is contended as “intelligence” (Gardner Reference Gardner2011) in developmental psychology, where the former is the application of the latter to elicit required behaviour for performing a task in a given context (Mitchelmore & Rowley Reference Mitchelmore and Rowley2010; OECD 2002). An individual is declared competent if he/she could successfully complete the given task (Hager & Gonczi Reference Hager and Gonczi1996; Moore, Cheng, & Dainty Reference Moore, Cheng and Dainty2002), measured by his/her effectiveness in behaviour to meet or surpass the expected standards of performance (Butler Reference Butler1978; Eraut Reference Eraut1994). Among individuals, it is compared (Mulder Reference Mulder, Torniainen, Mahlamäki-Kultanen, Nokelainen and Ilsley2011) as to how efficiently one could complete the same task relative to the other (Conley Reference Conley2004). These qualities can be nurtured in an individual through adequate training. Hence, competence is identified as the ability to perform successfully in different contexts within a given domain (Schneider Reference Schneider2019; Vitello, Greatorex, & Shaw Reference Vitello, Greatorex and Shaw2021), using one’s inner prerequisites (Enke, Kraft, & Metternich Reference Enke, Kraft and Metternich2015) encompassing knowledge, skills and attitudes (Fass, Rutgers, & Chui Reference Fass, Rutgers and Chui2018) acquired in that domain.
However, the general understanding of competence in the design domain is limited merely to the skill involved in completing the design task. Some researchers consider Design Competence as a set of skills required to carry out a given design task, like the abilities to frame problems insightfully, abstract them appropriately, solve them laterally, communicate their solutions visually, manipulate their form and function purposefully and add to their value meaningfully (Conley Reference Conley2004). These skills pertain to the distinct stages of the design process, namely exploration, communication, manipulation and evaluation (Kimbell Reference Kimbell1999). Further, Competence is also credited as the amalgamation of these skills with the managerial skills required for team management, scheduling and written documentation, crucial to monitor the design process itself (Ramachandran & Siddique Reference Ramachandran and Siddique2016). These skills are sometimes further classified into basic and specialised disciplinary skills (Kramer, Agogino, & Roschuni Reference Kramer, Agogino and Roschuni2016), depending on their applicability to a specific discipline. To prescribe such skills in creating a desired curriculum, recent works suggest assessment frameworks for the teacher (Sudhindra & Blessing Reference Sudhindra and Blessing2021), as well as the learner (Fass, Rutgers, & Chui Reference Fass, Rutgers and Chui2018). However elaborate these schemata are, they are skewed to only the competencies in parts, without holistically addressing design competence per se.
Competence involves an active integration of knowledge, attitude and skill to contextually perform a given task (Horvath Reference Horvath2006; Vitello, Greatorex, & Shaw Reference Vitello, Greatorex and Shaw2021), whereas competency is just the skill. While both pertain to abilities, they vary in their scope of application (Hyland Reference Hyland1994). The former encompasses the task in its totality, whereas the latter does this only in parts. For instance, this is the difference between one’s ability to plan a streetscape and the ability to sketch it well. Although proficiency in sketching is necessary for a competent designer, it is not sufficient unless actively integrated with the knowledge of human scale per se and attitude towards user behaviour and applied in unison to plan the streetscape. The competence herein is also amenable to the context of the design task, be it a town or countryside where the streetscape is planned. Therefore, Design Competence is defined as the ability to perform a design task by integrating knowledge, skills and attitudes appropriate to its context. Since this construct is not discipline-specific (Lawson Reference Lawson1980), it is found applicable for foundational design learning, and thus the term LDC is used for the present study.
Towards assessing LDC, it was found crucial to identify the factors that determined the design context, and in turn, the design task. However, this was found lacking in the existing models mentioned so far. Unlike these models, the Design Aspects model (Chakrabarti Reference Chakrabarti2024) outlined the distinct aspects of the design context that controlled the associated competence. It interpreted design competence in terms of the design outcome as:
appropriate (parts of) systems and their lifecycle phases for the various elements within the innovation process developed by drawing on knowledge of specific disciplines in the applications of interest. (Chakrabarti Reference Chakrabarti2024)
Notwithstanding its assessment of LDC by merely the design outcome, the model was considered a good starting point, owing to its generalisability across disciplines. Hence, it was subjected to further investigation to verify if and how it could characterise a design task in its entirety, to account for the design process beyond disciplinary boundaries comprehensively.
3. Methodology
The present study has warranted a mixed methods approach, since it is both deterministic and stochastic simultaneously, involving the characterisation of design tasks theoretically and applying them empirically in real-world design contexts for the assessment of LDC (Figure 1). The overall methodology is as follows:
Overall research methodology with tools and methods to fulfil the corresponding objectives of the study.

Figure 1. Long description
The flowchart consists of four levels.
Level 1: A rectangular box labeled Design Aspects Model (existing) points right to a peach box labeled Construct Validity, which corresponds to Objective 1: To identify the primary factors that determine a design task.
Level 2: A downward arrow from the first level leads to a parallelogram labeled Design Task Ontology (proposed). This points right to a peach box labeled Content Validity, corresponding to Objective 2: To validate the comprehensiveness of these factors across the design spectrum.
Level 3: A downward arrow leads to a parallelogram labeled Design Task Ontology (revised). This points right to a peach box labeled Criterion Validity, corresponding to Objective 3: To propose and evaluate a standard code for framing design tasks in real application.
Level 4: A final downward arrow leads to a parallelogram labeled Design Task Syntax. This points right to a green cylinder labeled Design Task Generator, which corresponds to the final Aim: To characterise design tasks for assessing Learners’ Design Competence, L D C.
3.1. Design Aspects model (existing)
The Design Aspects model (Chakrabarti Reference Chakrabarti2024), as outlined in Figure 2, was the culmination of concurrent epistemological studies (Srinivasan & Chakrabarti Reference Srinivasan and Chakrabarti2010; Kota & Chakrabarti Reference Kota and Chakrabarti2014) that analysed a host of design guidelines, methods, tools and methodologies towards demarcating the state space in designing. It suggested the existence of five areas of design competence, that is, Design Aspects, whose integration was essential to actualise desired change (Chakrabarti & Papalambros Reference Chakrabarti and Papalambros2015) by any designer, typical to their field of designing. The design aspects were namely: Discipline, Lifecycle, System, Application and Innovation process, which were subsequently divided into corresponding sub-areas of design competence, that is, Design Sub-aspects as follows:
-
1. Discipline: It encompassed the sectors of knowledge determining the design criteria, viz., society, economy, ecology and technology, where the first three addressed the sustainability needs of the stakeholder and technology entailed the building blocks of design viz., form, function and organisation.
-
2. System: It identified the degree of focus within which the design was bounded, that is, within the component or the system as a whole.
-
3. Lifecycle: It denoted the phase in the design timeline when the intervention was made, that is, during materials procurement (sic), manufacturing, use or retirement.
-
4. Application: It pertained to the nature of specialisation of the designer as to whether the designer was specific or generic to a particular domain.
-
5. Innovation process: It defined the type of systems that the designer innovated for, including only parts or the whole of a product, process, service or business.
Design Aspects model as proposed by Chakrabarti Reference Chakrabarti2024. (Sub)aspects marked with an asterisk (*) found inconsistent with the construct of Learners’ Design Competence by the authors, upon validation as detailed in Section 3.2.

Figure 2. Long description
A hierarchical flowchart titled Design Aspects at the top. Five dark gray boxes branch out horizontally below the title. From left to right, they are:
* Discipline asterisk: contains sub-aspects Society, Economy, Ecology, and Technology asterisk.
* System asterisk: contains sub-aspects Component asterisk and System.
* Lifecycle asterisk: contains sub-aspects Materials asterisk, Manufacturing asterisk, Use, and Retirement.
* Application asterisk: contains sub-aspects Specific asterisk and Generic asterisk.
* Innovation Process asterisk: contains sub-aspects Product, Process, Service, and Business asterisk.
All sub-aspects are in white boxes connected by vertical and horizontal lines to their respective main pillar.
Considering that the model intended to classify designers and their designs (Chakrabarti Reference Chakrabarti2024), its potential to determine the underlying nature of a design task, universal to disciplines, had to be validated.
3.2. Model validation - construct validity
Construct validity is a measure of how well a model represents the underlying theory of interest (Sanders & McCormick Reference Sanders and McCormick1993), in this case, a design task. To identify the primary factors that determine a design task, a qualitative analysis of the Design Aspects model (Chakrabarti Reference Chakrabarti2024) was undertaken to corroborate its construct validity. The Kipling method was used to understand the given situation comprehensively. Accordingly, the model was evaluated against the 5Ws1H questions of inquiry viz., the “what, when, where, who, why, and how” of the method, to check if the model truly explained the theoretical concept of the task “to design.” Each aspect with its sub-aspects was tested for its capacity to answer any one of the 5Ws1H questions correctly and completely. Based on the observations of this validation, the (sub)aspects were realigned, replaced or removed, in order to propose a design task ontology that identified the (sub)factors of the design context which are essential to determine a design task theoretically.
3.2.1. What to design?
The Innovation process in Figure 2 responded to this, although misleadingly, as the design process per se does not necessitate innovation, until it is “any course of action aimed at changing existing situations to preferred ones” (Simon Reference Simon1969). Since what is to be designed is better expressed by the solution devised to achieve the goal of the design task, it may be suitably termed as Artefact (Simon Reference Simon1969 ). Furthermore, business overlapped with the remaining sub-aspects based on how it was implemented. To represent such an artefact yielding profit, inclusive of societal, economical or ecological benefits, organisation is befitting. Thus, a given design task could be aimed at creating (m)any or all of the following artefacts, namely:
-
- Product: Tangible good that can be offered for sale (Kotler, Armstrong, & Scott Reference Kotler, Armstrong and Scott2001),
-
- Process: Series of actions planned towards a particular end,
-
- Service: Intangible good offered for consumption by the user (Kotler, Armstrong, & Scott Reference Kotler, Armstrong and Scott2001),
-
- Organisation: Structured group of people working together for a shared purpose (Mooney & Reiley Reference Mooney and Reiley1939).
3.2.2. When to design?
Lifecycle in Figure 2 answered this but did not specify when the design task was to be executed. This can be duly recognised by redefining it as Implementation. Further, its sub-aspects aligned well only with products of industrial manufacturing, unlike buildings or other artefacts. To remedy this, materials and manufacturing can be combined as production, as the former is incongruent with the remaining phase, and not all artefacts are manufactured. Another phase crucial for the consumption of the artefact has been overlooked in the model, which can be redressed by adding distribution before the rest. Thus, a design task could be directed towards (m)any or all of the stages of implementation of the artefact, namely:
-
- Production: Process of procuring and transforming raw materials into the artefact (Ulrich & Eppinger Reference Ulrich and Eppinger2016);
-
- Distribution: Process of transporting and delivering the artefact to the end user (Ulrich & Eppinger Reference Ulrich and Eppinger2016);
-
- Use: Process of operating and maintaining the artefact to fulfil its purpose (Ulrich & Eppinger Reference Ulrich and Eppinger2016);
-
- Retirement: Process of disposing and recovering the artefact at its end-of-life (Ulrich & Eppinger Reference Ulrich and Eppinger2016).
3.2.3. Where to design?
System in Figure 2 addressed this, despite being tautologous with one of its sub-aspects. It also limited the scope of the design task to the boundary of the artefact, missing touchpoints outside, like its environment and their interface. Therefore, to improve its clarity and continuity, it could be renamed as Scope to localise where, in the system–environment continuum, the design task is focussed, namely at the level(s) of the:
-
- System: Refers to the components and organisation of the artefact;
-
- Environment: Refers to the surroundings in which the artefact operates;
-
- Interface: Refers to the shared boundary between the system and environment (Simon Reference Simon1969).
3.2.4. How to design?
Technology under discipline in Figure 2 was the only sub-aspect that related to this question, contrary to its counterparts pointing to the stakeholder for whom the design task was to be carried out. Although design processes may vary across disciplines (Lawson Reference Lawson1980), their implications on the artefact can be unified (Gero & Kannengiesser Reference Gero and Kannengiesser2013). Hence, they were collectively clarified as techne to suggest these means to manipulate the artefact within the scope of the context. Among its further divisions, organisation could be adopted as value instead, to address the human-centred benefits it represents. The techne thus manipulated could be any or all of its:
-
- Form: Structure of the artefact (Conley Reference Conley2004);
-
- Function: Purpose that the artefact fulfils (Gero & Kannengiesser Reference Gero and Kannengiesser2013);
-
- Value: Benefits generated by the artefact (Conley Reference Conley2004).
3.2.5. Whom to design for?
Application was found to be the only aspect in Figure 2 explicitly related to this. Even then, it only answered “who designs” rather than “whom for,” which was inadvertently recognised by the sub-aspects of discipline, save technology. Focussing the design task on the beneficiary rather than the benefactor by replacing it with stakeholder could identify it as a part or whole of the:
-
- Society: Group of individuals distinguished by a certain behaviour from others (Ginsberg Reference Ginsberg1921);
-
- Economy: Pertains to wealth and its distribution in the society (Smith Reference Smith1776);
-
- Ecology: Pertains to the relationship between living things and their environment (Haeckel Reference Haeckel1866).
3.2.6. Why to design?
No aspect in the model in Figure 2 represented “why” the design task was necessary. While design is a purposive, life-centric activity beyond mere problem-finding/solving, its motivation for change is derived from its needs to fulfil the stakeholders’ desires for:
-
- Existence: Basic needs for one’s survival and safety (Alderfer Reference Alderfer1969);
-
- Sustenance: Maintenance needs to support and improve well-being over time (Alderfer Reference Alderfer1969);
-
- Furtherance: Growth and development need to realise one’s full potential (Maslow Reference Maslow1943).
Thus, the construct of the Design Aspects model is validated qualitatively. This brought to light its shortcomings in identifying the primary factors involved in a design task.
3.2.7. Identification of the design task factors
pt?>In consideration of the observations in Section 3.2.6., a paradigm shift from aspects that classified a designer (Chakrabarti Reference Chakrabarti2024) to factors unique and central to the act of designing was necessitated. So, the corresponding (sub)aspects in Figure 2 were revised to the ones highlighted in orange in Figure 3. Hence, an ontology for design task factors was proposed to contextualise the design task irrespective of discipline.
Proposed ontology for design task (sub)factors, highlighting revisions to the Design Aspects model, in orange.

Figure 3. Long description
A hierarchical flowchart titled Design Task Factors at the top. Six main categories branch out horizontally below it, each containing a primary label and a bracketed question.
1. Artefact [What?]: Orange box. Sub-factors include Product, Process, and Service in white boxes, and Organisation in an orange box.
2. Implementation [When?]: Orange box. Sub-factors include Production and Distribution in orange boxes, followed by Use and Retirement in white boxes.
3. Techne [How?]: Orange box. Sub-factors include Form and Function in white boxes, and Value in an orange box.
4. Scope [Where?]: Orange box. Sub-factors include System in a white box, followed by Environment and Interface in orange boxes.
5. Stakeholder [Whom for?]: Orange box. Sub-factors include Society, Economy, and Ecology, all in white boxes.
6. Needs [Why?]: Orange box. Sub-factors include Existence, Sustenance, and Furtherance, all in orange boxes.
3.3. Content validity
Content validity measures how completely a model explains the theory in its various facets (Sanders & McCormick Reference Sanders and McCormick1993). To ensure the reliability of the proposed ontology in unifying the design task across the design spectrum, the comprehensiveness of its content across disciplines had to be validated. Accordingly, its content validity was assessed empirically. In this regard, a thematic analysis of the existing design curricula for the disciplines of art, architecture and engineering was carried out, owing to their primacy in the design spectrum (Lawson Reference Lawson1980). For this, a Codebook was developed by defining each of the design task subfactors, as detailed in Section 3.3.4. Coding sessions were conducted with three coders, including the researcher, a non-designer and a designer, to categorise a stratified sample of 60 learning objectives from the chosen curricula into the proposed ontology deductively, after adequate training. A subsequent quantitative analysis of their Inter-Coder Reliability (ICR) revealed that their discrepancies were resolved through a better understanding of the codebook. Later, the coding session was repeated with the revised ontology, and its outcome was verified against the ground truth, with Krippendorff’s alpha coefficient, K-α, for each coder. Any probability (p) of chance agreement was controlled significantly to p ≤ 0.01, thus validating the content of the ontology empirically.
3.3.1. Data collection
Against the backdrop of assessing LDC towards eliminating the shortcomings of foundational design curriculum, empirical data on the Learning Objectives (LOs) from the foundation level of the existing design curricula were collected. For this, the entire design spectrum spanning from art characterised by “imaginative, unpredictable and spontaneous” processes to engineering involving “relatively technical, systematic and even mechanical” processes was accounted for including architecture as “one of the most centrally placed fields” (Lawson Reference Lawson1980). Therefore, LOs in the foundation years of graduation in these three disciplines, typically the first year in art and architecture and the second year in engineering, were collected. To account for both the global and local contexts, data was sourced from the top five higher educational institutes ranked internationally by Quacquarelli Symonds (QS 2025), and in India by National Institutional Ranking Framework (NIRF 2025) for the year 2025, to carry out the thematic analysis. The corresponding undergraduate programmes included Bachelor of Arts, Fine Arts, Design, Architecture, Science, Technology and Engineering, spanning across the entire design spectrum. The overall population aggregated to 1078 LOs, viz., 485 internationally and 593 in India respectively.
3.3.2. Data cleaning
A sample of these LOs collected from the scheme of instruction of the institute is as follows:
Learn the fundamental principles of statics, kinematics and dynamics as applied in an engineering context. You’ll advance your understanding of key equations, derivations and proofs that provide a strong basis for future solid mechanics units. You’ll work in teams and individually to solve online quizzes and problem sheets on the material covered.
Thematically coding such LOs in their hundreds could be cognitively heavy, as one has to first understand the structure of these sentences and then classify them under relevant codes. This necessitated cleaning the dataset prior to further analysis, to overcome associated cognitive biases. Hence, data cleaning was done in the following three steps (refer Figure 4a):
-
• Remove irrelevant LOs: to eliminate all subjects including electives and non-core, except the design core as prescribed by the institute. Likewise, (parts of) LOs that digressed towards associated pedagogical or metacognitive approaches were also removed.
-
• Combine similar LOs: to reduce the effort in reading multiple LOs with redundant phrasing into one compound LO with multiple parts.
-
• Convert LO structure: to enhance their readability by restructuring them into imperative sentences of type Verb-Object-Adjunct, ensuring consistency.
(a) Data cleaning steps to pre-process the collected LOs before sampling for code-based thematic analysis. (b) Experimental setup for code-based deductive thematic analysis of the LO sample with training and triangulation.

Figure 4. Long description
Panel a shows a horizontal flowchart with three stages.
1. Step 1 underscore REMOVE is marked with a minus sign and contains bubbles labeled Elective, Non-Core, and Meta-Cognitive.
2. Step 2 underscore COMBINE is marked with a plus sign and shows two overlapping circles labeled L O sub 1 and L O sub 2.
3. Step 3 underscore CONVERT is marked with a delta symbol and shows a dashed circle containing the text Imperative Structure V O A.
Panel b shows a triangular experimental setup.
At the top vertex is CODER underscore 0 Researcher, depicted as a person with a book.
At the bottom left is CODER underscore 1 Non-designer.
At the bottom right is CODER underscore 2 Designer.
Two solid arrows labeled TRAINING point from CODER underscore 0 down to CODER underscore 1 and CODER underscore 2.
A dashed horizontal line at the base connects the two bottom coders and is labeled TRIANGULATION.
At the center of the triangle is a clipboard icon with checkmarks and crosses.
Parsing systematically through these steps in Figure 4a, the LO sample was refined into:
Learn the fundamental principles of statics, kinematics and dynamics. Understand key equations, derivations and proofs in solid mechanics.
3.3.3. Data sampling
Cleaning the dataset filtered it to 600 LOs, with an average of 200 LOs in each discipline, namely art, architecture and engineering. Since manually coding such a large dataset could be cognitively biased and time-intensive, a representative sample was found practical for the purpose of thematic analysis. The minimum size of such a sample that can generalise the results for the population with a confidence ratio of 95% ± 5% was found to be 60 (Dean, Sullivan, & Soe Reference Dean, Sullivan and Soe2013). Consequently, one-tenth of the total dataset was taken as a stratified sample, by funnelling down from the discipline to the institute, to the semester of study. Of the total 30 top institutes from which the data was originally sourced, two LOs (one from each semester) were randomly chosen to represent the population evenly. Given that each institute had an average of four courses per semester that were core to design, there was a one in four chance of a certain course being represented. Nonetheless, since the LOs were restricted to only the foundational year of design study, the same set of courses repeated across institutes within the same discipline. This increased the chance of representation of a certain course with every additional institute that was surveyed. Cumulatively, due care was taken to ensure the representation of each course within the foundational curricula, thereby overcoming any bias arising from disproportionate representation of a specific subpopulation.
3.3.4. Experimentation setup
To carry out the thematic analysis of the sampled LOs, a Codebook (refer Appendix A) was developed. It compiled the overall structure of the design task ontology proposed in Figure 3, defining each corresponding subfactor as detailed in Sections 3.2.1–3.2.6. A Checksheet (refer Appendix B) was formatted with all the 60 LOs indexed to their corresponding course titles to record coder observations, including relevant keywords from each LO and their mapping with one or more design task subfactors as found suitable, in the “Keyword: Subfactor” column. This not only enabled the coders to organise their reasoning but also facilitated the researcher to identify points of disagreement among coders, later in the study. These mapped keywords were then sorted using the drop-down lists under the relevant design task factor, against each LO. In case a specific keyword could not be classified as a (sub)factor, the coder could record it separately with a suggestive (sub)factor in the “Unclassified” column.
Using the codebook and checksheet, thematic coding sessions were conducted individually with three participants, whose roles and highest training are as denoted in the brackets, namely:
-
• Coder 0 (The researcher, Bachelor of Architecture),
-
• Coder 1 (Non-designer, Master of Arts in English Literature and Journalism) and
-
• Coder 2 (Designer, Bachelor of Design).
The coders have been identified as C0, C1 and C2 respectively, as depicted in Figure 4b. C0 coded all 60 LOs ahead to set the ground truth for triangulating with the other coders, thus not only simulating a first-hand use of the experimentation tools but also checking their consistency, effectiveness and efficiency for coding in its entirety. Coders C1 and C2 were then trained with an additional set of 10 LOs to practise in preparation for the coding sessions.
3.3.5. Data interpretation
The recorded checksheets of coders C1 and C2 were subsequently processed to analyse how well they agreed on classifying a certain LO as a certain subfactor, in the following two steps:
-
• Binary Encoding: Each coder response was encoded as 1 or 0 against a given subfactor, based on whether or not at least one keyword identified from that LO was mapped to it. Thus, the entire checksheet was encoded for all 20 subfactors of the design task ontology.
-
• Confusion Matrix: Once the encoding was done, a confusion matrix, as shown in Figure 5a was drawn up for each of the subfactors to compare the responses between C1 and C2 statistically, as it is instantiated in Figure 5b for the subfactor product. It summarised the number of LOs that were classified as the subfactor by:
-
i. Both C1 and C2
-
ii. Only C1
-
iii. Only C2, and
-
iv. Neither C1 nor C2.
-
(a) Confusion matrix between coders 1 and 2 for tallying their agreements and disagreements on occurrence of a subfactor X. (b) Sample confusion matrix for the subfactor “Product.”

The row sums of the matrix, namely (i + ii) and (iii + iv), depicted the number of LOs that C1 had classified as the given subfactor X and otherwise, with their total summing up to the sample size N = 60. Similarly, the column sums, namely (i + iii) and (ii + iv), depicted the same for C2. Summing along its principal diagonal, namely (i + iv), resulted in the magnitude of agreement between coders C1 and C2 to classify the LOs as the given subfactor X and otherwise. For a given subfactor, this sum of agreements between the coders on its respective occurrences and non-occurrences, namely
$ \left[n\left(\bigcap Yes\right)+n\left(\bigcap No\right)\right], $
 expressed as a percentage of the sample size N, determined the ICR, as below:

Conversely, perfect agreement was observed when all the LOs classified by C1 as the given subfactor and otherwise were classified alike by C2, resulting in an ICR = 100%. A minimum of 80% ICR was necessary for a subfactor to be declared reliable. However, it was sufficient only if it was greater than or equal to the minimum acceptable reliability, ICRo improbable by chance p ≤ 0.01 (Birkimer & Brown Reference Birkimer and Brown1979). Graphically, the loci of these thresholds calculated for the corresponding median rate of recorded occurrence (Õ) by Birkimer and Brown (Reference Birkimer and Brown1979) for N = 50 and N = 100, were duly interpolated to plot the threshold of improbability for N = 60, as shown in Figure 12, which the ICR reflected true agreement. Hence, besides the observed ICR, Õ for each subfactor was calculated to verify its improbability.
3.3.6. Coding session 1
Once the coders were individually trained as shown in Figure 4b, the coding session began. To avoid the risk of cognitive fatigue, they were encouraged to take breaks every 40 minutes given the demanding nature of the task. While coding, discipline-specific jargons in the LOs that challenged the coders’ understanding like human scale, microprocessors and hydraulic flow, were clarified to them. After the completion of the task which lasted 2.5 to 3 hours, a short discussion followed to record the coders’ feedback on the coding task and its tools. Careful examination of the corresponding confusion matrices for each subfactor revealed the following on how reliable the Codebook was in encoding the Design Task ontology:
-
• Artefacts in Figure 6 were found to be interpreted with reliability ranging from a high 97% to a moderate 77% ICR. While the first two artefacts attributed their high ICRs almost solely to their non-occurrence, the significant share of disagreement in the latter two was found to be due to their confusion with system and production respectively, based on triangulation with the ground truth. Despite being the least reliable of the lot, process, unlike other artefacts, was found to reflect true agreement free from chance in Figure 12. The others could cross this threshold of improbability only if their agreement on occurrence improved, given their true agreement on non-occurrence.
-
• Implementation stages in Figure 7 reported high reliability except in production with 73% ICR. None of them showed significant agreement on occurrence, which could be either due to their true non-occurrence or misrepresentation in the ontology. All of them reflected true non-occurrence except production which was unidentified in 13 LOs. However, their agreements were likely to be by chance, as they fell below the threshold of improbability in Figure 12 for their corresponding Õ(s). Triangulation confirmed this to result from their misrepresentation as a “process,” which is also an artefact in the codebook (refer Appendix A). Production was the most affected due to this anomaly.
-
• Techne in Figure 8 showed high reliability only for function with 82% ICR, yet not enough to be unlikely by chance occurrence. Conversely, form, despite its moderate 77% ICR evident from its neglected identification in 27 LOs, proved to be free from the effect of chance as per Figure 12. Value, however, with a similar ICR, did not escape this probability due to its ambiguity with function, thus hiking their disagreements concurrently too high to be improbable by chance.
-
• Foci in Figure 9 reported high reliability in interface and environment, yet, insufficient to reflect improbability, as shown in Figure 12. System with 77% ICR was found to be confused with product, thereby increasing its disagreement rate between C1 and C2. In parallel, its relevant keywords were missed out in 13 LOs, lowering its rate of agreement too, leading to its moderate reliability. While environment owed its share of disagreement to its ambiguity with ecology (stakeholder), the other two ascribed their agreements to their non-occurrence. These discrepancies indicated a need to strengthen the understanding of all the foci accordingly.
-
• Needs in Figure 10 stood in contrast to all the factors discussed so far, with high reliability throughout, though infested by chance. Given their reported occurrence in less than 5% of the LOs to be true as triangulated, increasing their agreement on these few occurrences can alone compensate for the effect of likelihood on their ICRs, as shown in Figure 12.
-
• Stakeholders in Figure 11 were found to be consistently interpreted with high reliability. Unlike the previous factor, this reflected true agreement dictated by their corresponding Õ in Figure 12, except for ecology misinterpreted as environment (focus), leading to its likelihood by chance. Nevertheless, the factor was well-interpreted with utmost consistency across all factors.
Figure 6.Confusion matrices for C1 (vs) C2 with decreasing ICR for the subfactors of Artefact.

Figure 6. Long description
A multi-panel figure with four confusion matrices. Each matrix has Coder_1 on the vertical axis and Coder_2 on the horizontal axis, both with Yes and No options. Green shading highlights the diagonal agreement cells.
* Panel 1: Organisation. I C R equals 97 percent, O-tilde equals 2 percent. Grid values: Yes/Yes is 0, Yes/No is 2, No/Yes is 0, No/No is 58.
* Panel 2: Service. I C R equals 88 percent, O-tilde equals 6 percent. Grid values: Yes/Yes is 0, Yes/No is 7, No/Yes is 0, No/No is 53.
* Panel 3: Product. I C R equals 87 percent, O-tilde equals 8 percent. Grid values: Yes/Yes is 1, Yes/No is 5, No/Yes is 3, No/No is 51.
* Panel 4: Process. I C R equals 77 percent, O-tilde equals 27 percent. Grid values: Yes/Yes is 9, Yes/No is 8, No/Yes is 6, No/No is 37.
Figure 7.Confusion matrices for C1 (vs) C2 with decreasing ICR for the subfactors of implementation.
Figure 7. Long description
The figure contains four panels, each representing a confusion matrix for a specific subfactor. Each matrix has Coder_1 on the vertical axis and Coder_2 on the horizontal axis, both with Yes and No categories.
1. Retirement panel. Top left text: I C R equals 98 percent, O-tilde equals 1 percent. Grid values: Coder_1 Yes and Coder_2 Yes is 0 (shaded green). Coder_1 Yes and Coder_2 No is 1. Coder_1 No and Coder_2 Yes is 0. Coder_1 No and Coder_2 No is 59 (shaded green).
2. Distribution panel. Top left text: I C R equals 93 percent, O-tilde equals 5 percent. Grid values: Coder_1 Yes and Coder_2 Yes is 1 (shaded green). Coder_1 Yes and Coder_2 No is 4. Coder_1 No and Coder_2 Yes is 0. Coder_1 No and Coder_2 No is 55 (shaded green).
3. Use panel. Top left text: I C R equals 88 percent, O-tilde equals 6 percent. Grid values: Coder_1 Yes and Coder_2 Yes is 0 (shaded green). Coder_1 Yes and Coder_2 No is 7. Coder_1 No and Coder_2 Yes is 0. Coder_1 No and Coder_2 No is 53 (shaded green).
4. Production panel. Top left text: I C R equals 73 percent, O-tilde equals 13 percent. Grid values: Coder_1 Yes and Coder_2 Yes is 0 (shaded green). Coder_1 Yes and Coder_2 No is 12. Coder_1 No and Coder_2 Yes is 4. Coder_1 No and Coder_2 No is 44 (shaded green).
Figure 8.Confusion matrices for C1 (vs) C2 with decreasing ICR for the subfactors of Techne.
Figure 8. Long description
The figure consists of three side-by-side confusion matrices. Each matrix has Coder underscore 2 on the horizontal axis and Coder underscore 1 on the vertical axis, both with Yes and No options.
* The first matrix on the left is for Function. Metadata shows I C R equals 82% and O-tilde equals 11%. The grid values are: Coder 1 Yes and Coder 2 Yes is 1 (shaded green). Coder 1 Yes and Coder 2 No is 5. Coder 1 No and Coder 2 Yes is 6. Coder 1 No and Coder 2 No is 48 (shaded green).
* The middle matrix is for Value. Metadata shows I C R equals 78% and O-tilde equals 16%. The grid values are: Coder 1 Yes and Coder 2 Yes is 3 (shaded green). Coder 1 Yes and Coder 2 No is 2. Coder 1 No and Coder 2 Yes is 11. Coder 1 No and Coder 2 No is 44 (shaded green).
* The third matrix on the right is for Form. Metadata shows I C R equals 77% and O-tilde equals 30%. The grid values are: Coder 1 Yes and Coder 2 Yes is 11 (shaded green). Coder 1 Yes and Coder 2 No is 4. Coder 1 No and Coder 2 Yes is 10. Coder 1 No and Coder 2 No is 35 (shaded green).
Figure 9.Confusion matrices for C1 (vs) C2 with decreasing ICR for the subfactors of Focus.
Figure 9. Long description
The figure contains three panels from left to right.
Panel 1: Interface. Header shows I C R equals 92 percent and O tilde equals 4 percent. The matrix compares Coder_1 (rows) and Coder_2 (columns) with Yes or No options.
- Coder_1 Yes, Coder_2 Yes: 0 (shaded green).
- Coder_1 Yes, Coder_2 No: 4.
- Coder_1 No, Coder_2 Yes: 1.
- Coder_1 No, Coder_2 No: 55 (shaded green).
Panel 2: Environment. Header shows I C R equals 83 percent and O tilde equals 13 percent.
- Coder_1 Yes, Coder_2 Yes: 3 (shaded green).
- Coder_1 Yes, Coder_2 No: 4.
- Coder_1 No, Coder_2 Yes: 6.
- Coder_1 No, Coder_2 No: 47 (shaded green).
Panel 3: System. Header shows I C R equals 77 percent and O tilde equals 12 percent.
- Coder_1 Yes, Coder_2 Yes: 0 (shaded green).
- Coder_1 Yes, Coder_2 No: 10.
- Coder_1 No, Coder_2 Yes: 4.
- Coder_1 No, Coder_2 No: 46 (shaded green).
Figure 10.Confusion matrices for C1 (vs) C2 with decreasing ICR for the subfactors of Needs.
Figure 10. Long description
The figure contains three panels, each representing a confusion matrix for inter-coder reliability.
Panel 1 (Left): Sustenance.
Header: I C R equals 97 percent and O-tilde equals 2 percent.
Grid: Coder 1 (rows) versus Coder 2 (columns).
- Row Yes: Coder 2 Yes is 0 (green background), Coder 2 No is 2.
- Row No: Coder 2 Yes is 0, Coder 2 No is 58 (green background).
Panel 2 (Center): Existence.
Header: I C R equals 90 percent and O-tilde equals 5 percent.
Grid: Coder 1 (rows) versus Coder 2 (columns).
- Row Yes: Coder 2 Yes is 0 (green background), Coder 2 No is 6.
- Row No: Coder 2 Yes is 0, Coder 2 No is 54 (green background).
Panel 3 (Right): Furtherance.
Header: I C R equals 83 percent and O-tilde equals 12 percent.
Grid: Coder 1 (rows) versus Coder 2 (columns).
- Row Yes: Coder 2 Yes is 2 (green background), Coder 2 No is 4.
- Row No: Coder 2 Yes is 6, Coder 2 No is 48 (green background).
Figure 11.Confusion matrices for C1 (vs) C2 with decreasing ICR for the subfactors of Stakeholder.
Figure 11. Long description
The figure consists of three panels. Each panel features a two-by-two grid with Coder_1 on the vertical axis and Coder_2 on the horizontal axis, both with Yes and No options. Diagonal cells representing agreement are shaded green.
Panel 1, Economy. Header shows I C R equals 100% and O-tilde equals 0%. The grid contains 0 in the Yes-Yes cell, 0 in the Yes-No cell, 0 in the No-Yes cell, and 60 in the No-No cell.
Panel 2, Ecology. Header shows I C R equals 97% and O-tilde equals 2%. The grid contains 0 in the Yes-Yes cell, 0 in the Yes-No cell, 2 in the No-Yes cell, and 58 in the No-No cell.
Panel 3, Society. Header shows I C R equals 88% and O-tilde equals 18%. The grid contains 7 in the Yes-Yes cell, 5 in the Yes-No cell, 2 in the No-Yes cell, and 46 in the No-No cell.
Figure 12.Plot showing the observed ICRs in relation to the thresholds for agreement and improbability by chance, p < 0.01.
Figure 12. Long description
A scatter plot with the Y-axis representing Inter Coder Reliability I C R in percent, p less than or equal to 0.01, ranging from 60 to 100. The X-axis represents the Median rate of recorded occurrence O-tilde in percent, ranging from 0 to 100.
Key structural elements include:
- A horizontal blue dash-dot line at Y equals 80 labeled Threshold of Reliability.
- Three U-shaped dashed curves representing Thresholds of Improbability for different sample sizes: N equals 20 (highest curve), N equals 50, and N equals 100 (lowest curve). A bold black dashed line specifically marks the Threshold of Improbability for N equals 60.
- Data points are categorized into Session 1 (red dots) and Session 2 (green dots).
- Special markers include a red gear-like icon for Removed factor and a green gear-like icon for Added factor.
- Thin grey lines connect specific red dots from Session 1 to green dots in Session 2, showing shifts in reliability and occurrence.
- Most data points are concentrated on the left side of the graph (0 to 20 percent occurrence). Session 1 points frequently fall below the 80 percent reliability threshold, while Session 2 points generally show higher reliability, often staying above the N equals 60 improbability curve.


3.3.7. Reliability check
The proposed ontology was interpreted with decreasing consistency from Stakeholder, Need, Focus, Implementation, Artefact to Techne, as shown in Table 2. The corresponding subfactors, barring the following 6 out of the 20, namely: system, production, product, process, form and value, were found highly reliable based on their agreement among the coders. However, their probability of resulting from chance was above the threshold of improbability, except for society, economy, process and form, showing true agreement with a significantly low probability of p ≤ 0.0,1 as depicted in Figure 12. Still among these subfactors, process and form required at least an additional ICR of 3% to cross the threshold of reliability.
3.3.8. Revised design task ontology
To ensure that ICR for all the subfactors crossed the prescribed threshold of reliability, marked as a bold dash-dot line at 80% ICR, and threshold of improbability, marked as a bold dashed curve for N = 50 in Figure 12, the following revisions in the ontology were proposed.
-
• Resolve ambiguity between subfactors. As per Figure 12, probability of agreement by chance increased with decreasing ICR for a given reported Õ. To avoid this, it was essential to minimise disagreement, which on triangulation with C0 was inferred to be primarily driven by ambiguity (refer Table 1) between the following subfactor pairs:
-
○ Process – Production
-
○ Product – System
-
○ Function – Value
-
○ Environment – Ecology
-
-
• Reinforce definitions with examples. Another variable controlling the effect of chance on reliability was the reported Õ, namely the median rate of reported occurrence of the subfactor in the given LO sample. Subfactors lying below the threshold of improbability in Figure 12, with ICRs contributed solely by their non-occurrence in the sample, like service, organisation, production, use, retirement, system, interface, existence, sustenance and ecology can benefit from improving their agreement on occurrence, and in turn a higher Õ. This could be achieved by supporting the definition of the aforementioned subfactors with examples that reinforce their understanding and enable their identification in the LOs, thus improving Õ reported by the coders.
-
• Address unclassified keywords. It is important to note that not all keywords identified by the coders were reported to be represented by the ontology, especially ones pertaining to the stage of implementation prior to production involving the planning and development of any artefact, like “ideas, concepts, problems, and mock-ups.” This was addressed by introducing a new subfactor namely Development to refer to the stage of refining initial ideas into practical solutions fit to execute. Furthermore, Production and Distribution were found to be exclusive to products and hence were combined into Realisation, to make it inclusive for all the artefacts.
Triangulated instances of identified keywords with ambiguity in the LO sample, as per coder responses

Table 1. Long description
The table consists of five columns: S.No., Relevant keywords identified, Coder_1 (C 1), Coder_2 (C 2), and Ground Truth (C 0). It is divided into four main serial numbered sections, each containing two sub-items (i and ii) with specific phrases and underlined keywords.
* S.No. 1:
- Item i: Apply basics of urban planning and design to define urban problems. Keyword: Urban planning. C 1: dash. C 2: Production. C 0: Process.
- Item ii: Practice the ideas, concepts and critical approaches acquired by working on projects. Keyword: Ideas. C 1: Production. C 2: Process. C 0: Production.
* S.No. 2:
- Item i: Introduce digital fabrication as a method of home, hut and shelter delivery or construction. Keywords: Home, hut, shelter. C 1: System. C 2: System. C 0: Product.
- Item ii: Understand the architecture of microprocessors and microcontrollers. Keyword: Microprocessors. C 1: Product. C 2: Product. C 0: System.
* S.No. 3:
- Item i: Familiarise with human scale and basic ergonomics. Keyword: Ergonomics. C 1: Value. C 2: Value. C 0: Function.
- Item ii: Expose to renewable energy-based systems towards sustainable development of society. Keyword: Renewable energy. C 1: Function. C 2: dash. C 0: Function.
* S.No. 4:
- Item i: Understand creative applications of nature and science in design. Keyword: Nature. C 1: Environment. C 2: Environment. C 0: Ecology.
- Item ii: Know the climatic elements, their influence on building with passive design strategies. Keyword: Climatic elements. C 1: Environment. C 2: Ecology. C 0: Environment.
3.3.9. Coding session 2
The aforementioned revisions, based on the observations from coding session 1, were duly carried out by making the following changes as highlighted in green in Figure 13. In addition to the updated subfactors in implementation, these changes included the following:
-
• Renaming scope as focus to specify nothing more than the physical boundary within which the task was to be executed. Of its subfactors, environment was reframed as surrounding to overcome its ambiguity with ecology.
-
• Among techne, further clarifying form into form/structure ensured that both the external and internal physical attributes of any artefact were duly considered. Since value could be fundamentally controlled by either or both form and function, it was removed.
Revised ontology for design task (sub)factors, highlighting corresponding revisions (in green) to the original proposal in Figure 3. * is used to refer to the revision adopted after coding session 2.

Figure 13. Long description
A hierarchical tree diagram with a root node at the top titled Design Task Factors. Six primary categories branch out horizontally below it. From left to right, they are.
1. Implementation [When?]. Sub-factors include Development (green), Realisation (green), Maintenance* (green), and Retirement.
2. Artefact [What?]. Sub-factors include Product, Process, Service, and Organisation.
3. Techne [How?]. Sub-factors include Form / Structure (green) and Function.
4. Focus [Where?] (green). Sub-factors include System, Surrounding (green), and Interface.
5. Needs [Why?]. Sub-factors include Existence, Sustenance, and Furtherance.
6. Stakeholder [Who?]. Sub-factors include Society, Economy, and Ecology.
Green shading indicates revised elements. The asterisk on Maintenance indicates a revision adopted after coding session 2.
These changes were intended to improve the clarity and comprehensiveness of the design task ontology. Additionally, coder feedback revealed that identifying the keywords was the most demanding part of the entire task in terms of time and effort. Therefore, the expected keywords were specified in the checksheet as part of the experimentation setup, based on the ground truth (already established). A subsequent session of coding with these revisions not only stabilised their consistency of identification by the coders but also reduced the coding time by half.
The reported ICRs in Table 2 between coder pairs C0–C1, C1–C2, and C0–C2, as labelled in the principal diagonal of the ICR matrix, divided each into the lower half for results of session 1 and upper half for session 2 of coding. ICRs of at least 80% (in green) and 60%–80% (in yellow) depict strong and moderate agreements (Simon Reference Simon1969) between a coder pair. Moreover, ICR for C1–C2 encircled in Table 2 tested reliability, while the rest validated their truth value against C0. Comparing these results declared that the revisions in green in Figure 13 significantly improved the original proposal in Figure 3, with a high reliability (≥ 90%) across the ontology. Thus, the comprehensiveness of the content of the ontology was validated.
Comparison of the ICRs observed in coding sessions 1 (below) and 2 (above), among the coder pairs

Table 2. Long description
The table consists of four columns and four rows. The columns are labeled Coder Pair, Cohen’s Kappa, P A B A K, and Percent Agreement.
Row 1 (Coder Pair 1 and 2): Session 2 shows a Kappa of 0.83, P A B A K of 0.88, and 94 percent agreement. Session 1 shows a Kappa of 0.72, P A B A K of 0.80, and 90 percent agreement.
Row 2 (Coder Pair 1 and 3): Session 2 shows a Kappa of 0.76, P A B A K of 0.83, and 91 percent agreement. Session 1 shows a Kappa of 0.65, P A B A K of 0.75, and 88 percent agreement.
Row 3 (Coder Pair 2 and 3): Session 2 shows a Kappa of 0.81, P A B A K of 0.86, and 93 percent agreement. Session 1 shows a Kappa of 0.70, P A B A K of 0.79, and 89 percent agreement.
3.4. Criterion validity
Criterion validity measures how well a model can predict application in the real-world (Sanders & McCormick Reference Sanders and McCormick1993). To facilitate the application of the revised ontology, a standard code for defining design tasks was proposed and validated. To set the criteria for validation, the inherent relationships among the ontology factors had to be studied.
3.4.1. Design task syntax
Understanding the relationship among the identified design task factors in Figure 13 was found pertinent to standardising the definition of design tasks, genuine to its context. Algebraically, if each of these factors, say F 1, …, F 6 were notated as finite sets, their corresponding subfactors denoted the elements of the sets, as depicted below:
Here, the order of the factors did not reflect their relative importance but rather the order in which the design impact of a particular task was read. For a given undesirable situation, the design process originated from its stakeholders (F 6), so as to determine their needs (F 5); then scoped the design focus (F 4), so as to determine its techne (F 3); and culminated in the design artefact (F 2), so as to determine its implementation (F 1). Conversely, in terms of the desired situation, a design task could be routed backwards from its implementation to the stakeholders (F 1 → F 6), to understand its planned impact. While the former (problem) is outcome-driven, the latter (task) is purpose-driven. As per the latter, the relations among the design task factors could be graphically interpreted as shown in Figure 14, where an ordered six-tuple from F 1 → F 6 defined a valid design task. The Cartesian product of these six sets in order, namely F 1 × F 2 × F 3 × F 4 × F 5 × F 6, therefore suggested the existence of a total of 864 (4 × 4 × 2 × 3 × 3 × 3) such six-tuples that could characterise a unique design task.
Mapping diagram of the relation among the design task (sub)factors of the ontology, characterising a design task.

Figure 14. Long description
A conceptual diagram consisting of six vertical, light-gray ellipses labeled F sub 1 through F sub 6 from left to right. Each ellipse contains vertically stacked black dots representing subfactors f sub i j.
* F sub 1 contains four dots: f sub 1 1, f sub 1 2, f sub 1 3, and f sub 1 4. These correspond to Develop, Realise, Maintain, and Retire.
* F sub 2 contains four dots: f sub 2 1, f sub 2 2, f sub 2 3, and f sub 2 4. These correspond to Product, Process, Service, and Organisation.
* F sub 3 contains two dots: f sub 3 1 and f sub 3 2. These correspond to Form/Structure and Function.
* F sub 4 contains three dots: f sub 4 1, f sub 4 2, and f sub 4 3. These correspond to System, Surrounding, and Interface.
* F sub 5 contains three dots: f sub 5 1, f sub 5 2, and f sub 5 3. These correspond to Existence, Sustenance, and Furtherance.
* F sub 6 contains three dots: f sub 6 1, f sub 6 2, and f sub 6 3. These correspond to Society, Economy, and Ecology.
A red line with arrows traces a specific path through the sets, connecting circled dots in the following order: f sub 1 4 to f sub 2 2, then to f sub 3 2, then to f sub 4 2, then to f sub 5 2, and finally terminating at f sub 6 1. Text on the right provides the set notation F sub i = {f sub i j | i = 1 to 6; j = 1 to 4} and defines the categorical labels for each set.
Each design task, be it real or hypothetical, could hence be represented as a unique subset of this senary relation R ⊆ F 1 × F 2 × F 3 × F4 × F5 × F6, by the design task syntax, namely:
Plan to implement an artefact, by manipulating techne in its focus, towards stakeholder needs
Given the fact that “to design” is to plan an intervention towards a desired impact (Simon Reference Simon1969) (Chakrabarti Reference Chakrabarti2024), this syntax not only indicates the genuineness of a design task to its context, but also its discipline-neutrality. The real open-ended nature of the task was thus preserved, steering clear of any influence from discipline-based confounds. However, care must be taken to note that these tasks are elemental units of a design problem and should not be confused with the problem itself. In the prescribed syntax, substituting the highlighted design task factors with more than one subfactor each, increased the order of task complexity. However, only design tasks of the first order of complexity, that is, one subfactor per factor (as marked by the solid red line in Figure 14) were investigated further, owing to their relevance in foundational design learning.
3.4.2. Validation criteria
Out of the possible 864 design tasks, a sample not smaller than 270 was found adequate to generalise their application in real-life design situations, with a 95% ± 5% confidence level (Dean, Sullivan, & Soe Reference Dean, Sullivan and Soe2013). However, testing the application of the syntax for a sample, one-third the size of the entire population, may overlook the nuances. Therefore, the sampling was optimised such that the results could be extrapolated for the entire population. Since implementation and artefact had the highest number of subfactors among all the factors, these were found suitable to strategically control the sample. Firstly, the set of tasks all-for-one artefact was selected, as traced in Figure 15 by the green lines, taken one at a time from F 1 → F 6. Despite this exhaustive set of all 216 tasks (4 × 1 × 2 × 3 × 3 × 3) for one artefact, it fell short in explaining tasks with the other artefacts. Therefore, for each of the three remaining artefacts, a one-for-all strategy was adopted by exploring one implementation phase per artefact for all the possible combinations of the remaining factors. These tasks could be traced in Figure 15, by the pink lines taken one at a time from F 1 → F 3 and crossing over to the green lines from F 3 → F 6. This representative set of 54 tasks (1 × 1 × 2 × 3 × 3 × 3), coupled with the exhaustive set, could extrapolate the application for the remaining tasks. Hence, this entire sample of 270 tasks was tested for its application in the field of Architecture, owing to its centrality in the design spectrum (Lawson Reference Lawson1980).
Relation-mapping diagram tracing the sampled design tasks for assessing criterion validity, including the exhaustive set of all-for-one artefact (in green) and the representative one-for-all artefacts (in pink).

Figure 15. Long description
The diagram consists of six vertical elliptical clusters labeled F sub 1 through F sub 6 from left to right.
* Cluster F sub 1 contains four nodes: f sub 1 1, f sub 1 2, f sub 1 3, and f sub 1 4.
* Cluster F sub 2 contains four nodes: f sub 2 1, f sub 2 2, f sub 2 3, and f sub 2 4.
* Cluster F sub 3 contains two nodes: f sub 3 1 and f sub 3 2.
* Clusters F sub 4, F sub 5, and F sub 6 each contain three nodes arranged vertically, labeled f sub n 1, f sub n 2, and f sub n 3 respectively.
Green dash-dot arrows represent the exhaustive set of all-for-one artefacts. These arrows originate from all nodes in F sub 1 and converge on node f sub 2 1. From F sub 3, green arrows fan out from both nodes to all three nodes in F sub 4. Between F sub 4, F sub 5, and F sub 6, green arrows create a dense mesh where every node in a preceding cluster points to every node in the subsequent cluster.
Pink dash-dot arrows represent representative one-for-all artefacts. These arrows show a direct one-to-one mapping from f sub 1 2 to f sub 2 2, f sub 1 3 to f sub 2 3, and f sub 1 4 to f sub 2 4. From cluster F sub 2, pink arrows converge from nodes f sub 2 2, f sub 2 3, and f sub 2 4 into nodes f sub 3 1 and f sub 3 2. Node f sub 2 1 also has a green arrow pointing to f sub 3 1.
The robustness of the syntax was, however, controlled by the validity of the relation R among its six domains F 1 → 6. It was further scrutinised to check if there existed real-world examples for design tasks with each subfactor of a given factor, related to the other factors kept constant. On testing thus for all the factors, the syntax could be considered robust in its application across the ontology. So, the following validation criteria were developed, such that Ri referred to the complete set of ordered six-tuples with real-world application for the factor Fi, when the subfactors f ij of the remaining factors were kept constant for each criterion.
-
• Designing at multiple stages of implementation, that is, R 1 ⊆ F 1× {(f 21, f 31, f 42, f 51, f 63)}
-
• Designing for any artefact, that is, R 2 ⊆ F 2 × {(f 13, f 31, f 42, f 52, f 61)}
-
• Designing by manipulating either of the techne, that is, R 3 ⊆ F 3 × {(f 14, f 24, f 41, f 53, f 63)}
-
• Designing in varying foci, that is, R 4 ⊆ F 4 × {(f 12, f 21, f 32, f 51, f 62)}
-
• Designing for multiple stakeholders, that is, R 5 = F 5 × {(f 11, f 23, f 31, f 53, f 62)}
-
• Designing towards changing needs, that is, R 5 = F 5 × {(f 13, f 21, f 32, f 41, f 52)}
The above criteria were checked within the earlier sample of 270 design tasks in Architecture, in addition to other disciplines tested randomly for one of the aforementioned criteria. The details are as discussed in the following sections.
3.4.3. At multiple stages of implementation
A design task ontologically prescribed as a: Plan to implement a product by manipulating form/structure in its surroundings towards ecological existence can be applied at multiple stages of implementation, as shown in Table 3. One can develop, realise, maintain or retire an eco-park by manipulating similar form/structure, like grading the thickness, reconstructing the layers, regulating the mulch cover or reshaping abandoned pits, respectively, of the same surroundings, that is, quarry soil, for the survival of the native species. Such planning for all the implementation phases represents the real-world problem of managing the entire project lifecycle.
Real-world examples of a design task at multiple implementation stages with their respective task factors in bold

Table 3. Long description
The table consists of a header row and four data rows labeled a through d.
Header Row: The first two columns list the sequence Implement, Product, Form/Structure, Surroundings, Ecology, Existence. The third column provides the overarching goal: Plan to implement a product by manipulating form/structure in its surroundings towards ecological existence.
Row a: Develop. Lists Eco-park, Thickness, Quarry soil, Native species, and Secure root anchorage. The goal is to plan to develop an eco-park by grading the thickness of its quarry soil to secure root anchorage for native species.
Row b: Realise. Lists Eco-park, Layer, Quarry soil, Native species, and Create habitat substrates. The goal is to plan to realise an eco-park by reconstructing the layers of its quarry soil to create habitat substrates for native species.
Row c: Maintain. Lists Eco-park, Mulch cover, Quarry soil, Native species, and Prevent desiccation. The goal is to plan to maintain an eco-park by regulating the mulch cover of its quarry soil to prevent desiccation for the survival of native species.
Row d: Retire. Lists Eco-park, Abandoned pits, Quarry soil, Native species, and Restore safe habitat. The goal is to plan to retire an eco-park by reshaping abandoned pits of quarry soil into wetlands to restore safe habitat for native species.
3.4.4. For any artefact
A design task ontologically prescribed as a: Plan to maintain an artefact by manipulating form in its interface towards societal sustenance, can be applied in a design problem warranting multiple artefacts, as shown in Table 4. Here, typical to an urban design project, pedestrian access in the city is improved by manipulating the relevant interface to maintain a heritage boulevard, Transit-Oriented Development, public transportation and last-mile connectivity providers. Unbiased to any particular discipline, it enables the designer to experiment with various kinds of artefacts and pick (m)any that is found suitable for the situation at hand.
Real-world examples of a design task for any artefact with their respective task factors in bold

Table 4. Long description
The table is organized into three columns. The header row defines the general framework: Maintain – Artefact – Form/Structure – Interface – Society – Sustenance, synthesized as: Plan to maintain an artefact by manipulating form in its interface towards societal sustenance.
Row a:
- Task factors: Adapt – Heritage boulevard – Scale – Arcade – Neighbourhood – Improve pedestrian access.
- Synthesis: Plan to adapt a heritage boulevard by humanising the scale of its arcade to improve pedestrian access to its buildings.
Row b:
- Task factors: Regulate – Transit-oriented development – Format – Feedback surveys – Neighbourhood – Pedestrian friendliness.
- Synthesis: Plan to regulate transit-oriented development by optimising the format of feedback surveys to encourage a pedestrian friendly neighbourhood.
Row c:
- Task factors: Operate – Public transportation service – Format – Ticket platform – Neighbourhood – Incentive for pedestrian access.
- Synthesis: Plan to operate a public transportation service by simplifying the format of the ticketing platform to incentivise pedestrian access in the neighbourhood.
Row d:
- Task factors: Monitor – Last-mile connectivity providers – Number – Permits – Neighbourhood – Ensure pedestrian priority.
- Synthesis: Plan to monitor last-mile connectivity providers by regulating the number of permits to ensure pedestrian priority in a transit-oriented neighbourhood.
3.4.5. Manipulating either of the techne
A design task ontologically prescribed as a: Plan to retire an organisation by manipulating techne in its system towards ecological furtherance, can apply either of the techne like in Table 5, where a heritage trust is retired by manipulating the heritage expert team, formally or functionally towards ecological stewardship. Form and function are two sides of the same coin in a given problem and hence dealt with simultaneously, with one influencing the other.
Real-world examples of a design task manipulating techne with their respective task factors in bold

Table 5. Long description
The table consists of a header row and two data rows.
Header: Retire – Organisation – Techne – System – Ecology – Furtherance. The corresponding goal is to plan to retire an organisation by manipulating techne in its system towards societal sustenance.
Row a: Retire – Heritage trust – Composition – Heritage expert team – Ecology – Foster stewardship. The goal is to plan to retire a heritage trust by restructuring the composition of its heritage expert team to foster ecological stewardship.
Row b: Retire – Heritage trust – Responsibility – Heritage expert team – Ecology – Foster stewardship. The goal is to plan to retire a heritage trust by reallocating the responsibilities of its heritage expert team to foster ecological stewardship.
3.4.6. In varying foci
A design task ontologically prescribed as a: Plan to realise a product by manipulating function in its focus towards economic existence can be applied to a design problem in varying foci, as depicted in Table 6. The household spinning unit here is required to be realised in different foci namely the module, the backyard and the pyol by manipulating their relevant function towards economic self-reliance, which, interestingly was a problem Indians faced in their struggle for freedom in reality.
Real-world examples of a design task in varying foci with their respective task factors in bold

Table 6. Long description
The table consists of a header row and three data rows labeled a, b, and c.
Header Row: The first two columns contain the sequence Realise – Product – Function – Focus – Economy – Existence. The third column contains the sentence: Plan to realise a product by manipulating function in its focus towards economic existence.
Row a:
- Column 2: Realise – Household spinning unit – Cost – Module – Indian freedom struggle – Economic self-reliance. The word Module is in bold.
- Column 3: Plan to realise a household spinning unit by optimising the cost of its module for economic self-reliance during the Indian freedom struggle.
Row b:
- Column 2: Realise – Household spinning unit – Shared use – Backyard – Indian freedom struggle – Economic self-reliance. The word Backyard is in bold.
- Column 3: Plan to realise a household spinning unit by facilitating the shared use of the backyard for economic self-reliance during the Indian freedom struggle.
Row c:
- Column 2: Realise – Household spinning unit – Openness – Pyol – Indian freedom struggle – Economic self-reliance. The word Pyol is in bold.
- Column 3: Plan to realise a household spinning unit by capitalising on the openness of the pyol for economic self-reliance during the Indian freedom struggle.
3.4.7. Designing for multiple stakeholders
A design task ontologically prescribed as a: Plan to develop a service by manipulating form in its surroundings towards stakeholder furtherance can be exemplified, as shown in Table 7 for a design problem addressing multiple stakeholders. Here, a cultural experience is developed to further tourism for different stakeholders, namely, the artisan community; the city business; and the site ecosystem, by enhancing the form of their corresponding surroundings, be it participatory workshops, allied commercial activities or the seasonal variations, respectively. Without compromising the open-ended nature of the design tasks, these describe how to cater to the three pillars of sustainability (Brundtland Reference Brundtland1987).
Real-world examples of a design task for multiple stakeholders with their respective task factors in bold

Table 7. Long description
The table is organized into three columns. The header row defines the general framework: Develop - Service - Form/Structure - Surroundings - Stakeholder - Furtherance, which translates to the plan: Plan to develop a service by manipulating form/structure in its surroundings towards stakeholder furtherance.
Row a) focuses on the Artisan Community. Task factors: Develop - Cultural experience - Showcase - Participatory workshops - Artisan Community - Sustainable tourism. Resulting plan: Plan to develop a cultural experience by curating live craft showcases in participatory workshops to empower the artisan community towards sustainable tourism.
Row b) focuses on City business. Task factors: Develop - Cultural experience - Location - Commercial activities - City business - Empower sustainable tourism. Resulting plan: Plan to develop a cultural experience by zoning the location of associated commercial activities to empower the city business towards sustainable tourism.
Row c) focuses on Site ecology. Task factors: Develop - Cultural experience - Patterns - Seasonal variations - Site ecology - Empower sustainable tourism. Resulting plan: Plan to develop a cultural experience by integrating with the patterns of its seasonal variations to empower the site ecology towards sustainable tourism.
3.4.8. Designing towards changing needs
A design task prescribed at the ontological level, namely: Plan to maintain a product by manipulating function in its system towards societal needs, can be applied to a design problem addressing transient stakeholder needs. It can exemplify design situations in Table 8, where a classroom maintains its (a) structure to exist, (b) comfort to sustain and (c) occupant quality to further thereby improving the structural, acoustic and visual performance of its built system.
Real-world examples of a design task towards changing needs with their respective task factors in bold

Table 8. Long description
The table consists of a header and three rows labeled a, b, and c.
Header: The first two columns list the sequence Maintain – Product – Function – System – Society – Needs. The third column provides the corresponding planning statement: Plan to maintain a product by manipulating function in its system towards societal needs.
Row a: The sequence is Repair – Classroom – Shear strength – Floor – Students – Reduce risk of structural failure. The planning statement is: Plan to repair a damaged classroom by increasing the shear strength of its floor to reduce risk of structural failure in the future.
Row b: The sequence is Optimise – Classroom – Sound absorption – Walls – Students – Improve acoustic comfort. The planning statement is: Plan to optimise a classroom by improving the sound absorption of its walls to improve acoustic comfort for students.
Row c: The sequence is Renovate – Classroom – Visual diffusion – Display wall – Students – Encourage creativity. The planning statement is: Plan to renovate a classroom by improving the visual diffusion of its display wall to encourage student creativity.
3.4.9. Across the design spectrum
A design task at a prescribed ontological level, namely: Plan to develop a product by manipulating function in its interface towards societal sustenance, could be applied in varying disciplines of the design spectrum, namely: art, architecture and technology as depicted in Table 9. Within the same realm of air travel, the product to be developed for user comfort could vary from an airline mascot to an airport or an aircraft, by manipulating aesthetics, sound insulation and compatibility in their gesture, enclosure and controls respectively, based on the discipline of interest. The open-ended nature of these design tasks is thus preserved while unifying their application across different disciplines.
Real-world examples of a design task applied in diverse disciplines with their respective task factors in bold

Table 9. Long description
The table is structured with three columns. The header row establishes a general template: Develop – Product – Function – Interface – Society – Sustenance, which translates to the plan: Plan to develop a product by manipulating function in its interface towards societal sustenance.
Row a:
- Task factors: Develop – Airline mascot – Aesthetics – Gesture – Passenger – Reassure comfort.
- Design plan: Plan to develop an airline mascot by augmenting the aesthetics of its gesture to reassure passenger comfort.
Row b:
- Task factors: Develop – Airport – Sound insulation – Enclosure – Travellers – Ensure acoustic comfort.
- Design plan: Plan to develop an airport by optimising the sound insulation of its enclosure to ensure acoustic comfort for the travellers.
Row c:
- Task factors: Develop – Aircraft – Compatibility – Controls – Pilot – Reduce fatigue.
- Design plan: Plan to develop an aircraft by improving the compatibility of its controls to reduce pilot fatigue.
4. Results and discussion
4.1. Design task (sub)factors identified
Assessing the construct validity of the existing model of Design Competence (Chakrabarti Reference Chakrabarti2024) led to the identification of the (sub)factors that could determine a design task, theoretically, leading to the proposal of the Design Task Ontology in Figure 3. However, it lacked content validity due to discrepancies in reliability when triangulated with different coders. These discrepancies were routed back to the relevant (sub)factors and accordingly revised. The revisions discussed in Section 3.3.9 significantly improved its content validity, as inferred from Figure 12, except in the case of the subfactor use. Since it could misrepresent the phase of implementation, it was redefined as Maintenance, as asterisked in Figure 13. Thus, objective 1 of “identifying the primary factors influencing the design task” was achieved.
Corroborating the ICRs with Krippendorff’s alpha coefficients (K-α), summarised agreements between C0–C1, C0–C2 and C1–C2 were 0.91, 0.93 and 0.86, respectively. These indicated high agreement in all pairs and almost perfect agreement in C0–C2 (Marzi, Balzano, & Marchiori Reference Marzi, Balzano and Marchiori2024). The higher K-α with C2 than with C1 could be attributed to the former’s exposure to the expected keywords in his/her own background in design. Nonetheless, the high K-α of C0 with both C1 and C2 proved that the revised ontology was not only reliable but also valid, empirically. Thus, objective 2 of “validating the comprehensiveness of the design factors” was accomplished, as below:
4.2. Standard code for framing design tasks
Relating the ontological factors as detailed in Section 3.4.1 led to the formulation of a design task syntax, which standardised the framing of any design task. Verifying its applicability against the respective criteria in Section 3.4 not only demonstrated the flexibility of the ontology in defining unique design tasks within the same design problem but also confirmed its versatility in application across disciplines. The examples discussed are merely a glimpse of the 270 tasks explored for its criterion validity. All these tasks have been reposited online on https://design-education.github.io/DesignTaskDashboard/ (Design Task Generator 2025), as a design task generator tool to interactively access relevant real-world design tasks that are open-ended and unbiased, for every combination of the subfactors of the ontology, as shown in Figure 16. Thus, objective 3 of “proposing and evaluating a standard code to define design tasks” was fulfilled.
Screenshot of the interactive dashboard of the online Design Task Generator tool retrieving a relevant design task.

Figure 16. Long description
The interface is divided into three main horizontal sections.
Top Section: Six columns labeled Implement, Artefact, Techne, Focus, Need, and Stakeholder. Each column contains selectable subfactors. Currently selected items highlighted in orange are Develop, Product, Form, System, Sustenance, and Society. Other unselected options include Maintain, Realise, Retire, Organisation, Process, Service, Function, Interface, Surroundings, Existence, Furtherance, Ecology, and Economy.
Middle Section: A bold summary sentence synthesized from the selections reads: Plan to Develop a Product by manipulating the Form of its System towards the Sustenance of the Society.
Bottom Section: Under the heading Design Task, a specific prompt is generated: Plan to develop a beach resort by framing A-shaped walls to enhance the visual comfort of the lodgers. To the right is a photo of a multi-level white building with triangular A-frame roofs nestled among palm trees. A U R L link is provided at the very bottom: h t t p s forward slash forward slash Design-Education dot github dot i o forward slash DesignTaskDashboard forward slash Develop-Product-Form-System-Sustenance-Society dot p n g.
5. Conclusion
5.1. Summary of findings
In summary, the study reported in this paper evaluated whether the chosen model for design competence was valid by construct, content and criterion to characterise design tasks for the assessment of LDC at the foundational level. “Design situations vary not just because the problems are dissimilar but also because designers habitually adopt different approaches” (Lawson Reference Lawson1980). This dependency of the model (Chakrabarti Reference Chakrabarti2024) on the designers’ discipline, among other shortcomings discussed in Section 3.2, was overcome by reviewing its construct to conceptualise the (sub)factors primary to determining any design task into a design task ontology (refer Figure 3), theoretically. Consequently, these (sub)factors were validated with empirical evidence from existing design learning curricula to ensure that the content of the ontology was mutually exclusive and exhaustive, barring a few subfactors with ambiguity which were resolved later, thereby proposing a revised ontology (refer Table 10) of design task factors. Finally, to achieve the aim of characterising design tasks suitable for assessing the LDC, a standard template organising the relationship among the design task factors of the ontology was developed as the design task syntax, as discussed in Section 3.4.1. This syntax applied to real-world situations, led to the development of a Design Task Generator (2025), which is a compiled repository of design tasks illustrating a third of the 864 unique contexts possible at the first order of complexity, thus affirming the criterion validity of the ontology categorically.
Revised Design Task ontology comprising all the primary factors and their corresponding subfactors to comprehensively determine any design task specific to its context, irrespective of its field of application

Table 10. Long description
The table is organized into three columns: (Sub)Factors and Definition.
* Artefact includes:
- Product: Tangible good that can be offered for sale, e.g.: dwelling.
- Process: Series of actions planned towards a particular end, e.g.: slum rehabilitation.
- Service: Intangible good offered for consumption by the user, e.g.: building permit.
- Organisation: Structured group of people working together for a shared purpose, e.g.: N G O.
* Implementation includes:
- Development: Stage of refining initial ideas to practical solutions fit to execute, e.g.: cost estimation.
- Realisation: Stage of transforming raw materials and delivering the artefact, e.g.: prefab.
- Maintenance: Stage of operating and monitoring the artefact to fulfil its purpose, e.g.: retrofitting.
- Retirement: Stage of disposing or recovering the artefact at its end-of-life, e.g.: demolition.
* Techne includes:
- Form/Structure: Physical attributes of the artefact, e.g.: shape.
- Function: Performance attributes of the artefact to fulfil its purpose, e.g.: cost.
* Focus includes:
- System: Internal organisation of the artefact to perform a function, e.g.: floor.
- Surrounding: Immediate external condition within which the system operates, e.g.: climate.
- Interface: Shared boundary between the system and environment, e.g.: façade.
* Need includes:
- Existence: Basic needs for survival and safety of the user, e.g.: safety.
- Sustenance: Maintenance needs to support the well-being of the user, e.g.: comfort.
- Furtherance: Growth and development need to realise one’s full potential, e.g.: identity.
* Stakeholder includes:
- Society: Pertains to an individual/group marked off by a certain behaviour, e.g.: locals.
- Economy: Pertains to wealth and its distribution in the society, e.g.: trade.
- Ecology: Pertains to relationship of living things to their natural habitat, e.g.: biome.
5.2. Limitations of the study
The exhaustiveness of the ontology is limited only by the representation of its design task (sub)factors in the prescribed LOs for foundational design learning in art, architecture and engineering. Nevertheless, these results could be extrapolated to the entire spectrum given the key positioning of these disciplines within the design spectrum. It is essential to note that the dataset was specifically limited to design LOs in tertiary education, as these were found to be better articulated than those at the secondary level. Moreover, since foundational design education is the primary focus of the study, the later years of tertiary education were out of scope, although their contribution to LDC cannot be denied. Additionally, the application of the ontology exemplified with design tasks primarily in the field of architecture, may be extended to the whole spectrum while appraising the open-ended and unbiased nature of the design task. While the design task has been deconstructed into its (sub)factors for better comprehension of the design task per se, it should not be construed as the strategy for assessing LDC in its totality, which lies in the future scope of work.
5.3. Research implications
Consequently, the significant contributions of the study towards determining the nature of a design task, namely, the design task ontology, design task syntax and design task generator, have the following implications for future research both in academia and industry in areas as follows:
5.3.1. Codifying a unified design curriculum
The design task ontology developed can alleviate the ill effects of the prevailing system of discipline-based design learning, owing to its focus on the “foundations of designing independent of the designer, their situation” (Gero & Kannengiesser, Reference Gero and Kannengiesser2013). When codified appropriately based on the developmental needs of the learner, especially in schools, it can standardise the design curriculum by unifying all disciplines. This can empower learners to make an informed choice in pursuing their higher education in a specific discipline or simply equip themselves with the necessary fundamentals to tackle real-world, open-ended problems of every day.
5.3.2. Strategising LDC assessment
The design task syntax proposed can support the framing of open-ended design tasks in various contexts for assessing and measuring LDC. It not only gives the examiner the freedom to control the complexity of the tasks administered, which directly corresponds to the number of subfactors considered in a certain task, but also enables the assessment of how the different learning components are integrated, namely the knowledge of the implementation of the artefact, the attitude towards the needs of the stakeholder and the skill for manipulating the techne in the focus, unlike the existing models (Fass, Rutgers, & Chui Reference Fass, Rutgers and Chui2018; Thandlam Sudhindra et al. Reference Thandlam Sudhindra, Khan, Hendra, Muthalib and Blessing2023) that limit it to barely the skill. This can in turn provide insights into the critical areas that one might need to develop to improve his/her LDC.
5.3.3. Unitising design problems
The design task generator, when instrumentalised to break down a design problem into its elemental design task units, can develop a comprehensive understanding of the problem. Solving the problem depends mostly, if not entirely, on identifying the problem itself (Simon Reference Simon1969). When presented with a pre-defined design problem, the tool can act as a ready reckoner for designers and design learners to deconstruct the complex problem into simpler tasks, enabling them to plan their design activity accordingly. In the event of defining the design problem themselves, this can act as a checklist to corroborate better comprehension.
Acknowledgements
The authors would like to thank Mr Sachin Mathivanan and Ms Pranati Kompella for their active participation in the thematic coding sessions. Their valuable time and feedback in assessing and improving the ontology, respectively, are hereby acknowledged.
Appendix A: Codebook for coding session 1

Figure A1. Long description
The table is organized into three columns: Design Task Factor - Subfactor, and Definition.
* ARTEFACT (Based on multiple sources):
- Product: Tangible good that can be offered for sale.
- Process: Series of actions planned towards a particular end.
- Service: Intangible good offered for consumption by the user.
- Organisation: Structured group of people working together for a shared purpose.
* TECHNE (Conley, 2004):
- Form: Structure of the artefact.
- Function: Purpose that the artefact fulfils.
- Value: Benefits generated by the artefact.
* SCOPE (Simon H, 1968):
- System: Refers to the substance and organization of the artefact.
- Environment: Refers to the surroundings in which the artefact operates.
- Interface: Refers to the shared boundary between the system and environment.
* NEED (Maslow, Alderfer):
- Existence: Basic needs for one’s survival and safety.
- Sustenance: Maintenance needs to support and improve well-being over time.
- Furtherance: Growth and development needs to realise one’s full potential.
* STAKEHOLDER (Ginsberg, Smith, Haeckel):
- Society: Collection of individuals united by certain relations or behaviour which mark them off from others who differ.
- Economy: Pertains to wealth and its distribution in the society.
- Ecology: Relationship between living things and their environment.
* IMPLEMENTATION (Ulrich and Eppinger):
- Production: Process of procuring and transforming raw materials into the artefact.
- Distribution: Process of transporting and delivering the artefact to the end user.
- Use: Process of operating and maintaining the artefact to fulfil its purpose.
- Retirement: Process of disposing and recovering the artefact at its end-of-life.
Appendix B: Sample checksheet as filled by one of the coders

Figure B1. Long description
A spreadsheet with 12 rows of data under 12 column headers. The headers are Serial No, Course, Objectives, Keyword: Subfactor, Artefact, Techne, Scope, Need, Stakeholder, Implementation, and Unclassified.
Rows are grouped by color in the Serial No column.
Pink group (Rows 1 to 5):
- a_UAL_S1_01: Intro to Graphic & Media Design. Keywords: graphic: product, media: form, workshop: environment. Categorized as Product (Artefact), Form (Techne), and Environment (Scope).
- a_PSD_S1_02: Integrative Seminar - 1. Keywords: writing: system, inspiration: furtherance. Categorized as System (Scope) and Furtherance (Need).
- a_RISD_S1_03: Spatial Dynamics I. Keywords: physical: existence, spatial: environment, temporal: unclassified. Categorized as Environment (Scope), Existence (Need), and temporal (Unclassified).
- a_PI_S1_05: Literary & Critical Studies I. Keywords: composition: system, analysis: process, research: process. Categorized as Process (Artefact) and System (Scope).
- a_AU_S1_04: Programming for Designers. Keywords: interactive: form, website: service, programming: interface. Categorized as Service (Artefact), Form (Techne), and Interface (Scope).
Yellow group (Rows 6 to 10):
- r_UCL_S1_01: Environmental Design. Keywords: environmental: environment, architectural: function. Categorized as Function (Techne) and Environment (Scope).
- r_MIT_S1_03: Design Computing. Keywords: digital: service, shelter: existence, delivery: distribution. Categorized as Service (Artefact), Existence (Need), and Distribution (Implementation).
- r_MSA_S1_02: Architectural Context. Keywords: history: unclassified, global: society, issues: use. Categorized as Society (Stakeholder), Use (Implementation), and history (Unclassified).
- r_NUS_S1_03: Design & Make. Keywords: engineering: production, prototyping: process. Categorized as Process (Artefact) and Production (Implementation).
- r_PDM_S1_04: Elements of Architectural Typology. Keywords: theoretical: form, application: use. Categorized as Form (Techne) and Use (Implementation).
Blue group (Rows 11 to 13):
- t_ICL_S1_01: Design Engineering Principles. Keywords: scope: interface, contexts: function, mindsets: organisation, methodologies: process. Categorized as Organisation, Process (Artefact), Function (Techne), and Interface (Scope).
- t_TUD_S1_05: People: Understanding Humans. Keywords: human: society, physical: existence, perceptual: value, ergonomics: value. Categorized as Value (Techne), Existence (Need), and Society (Stakeholder).
- t_UN_S1_03: Engineering Design Project. Keywords: principle: system, practical: function. Categorized as Process (Artefact), Function (Techne), and System (Scope).

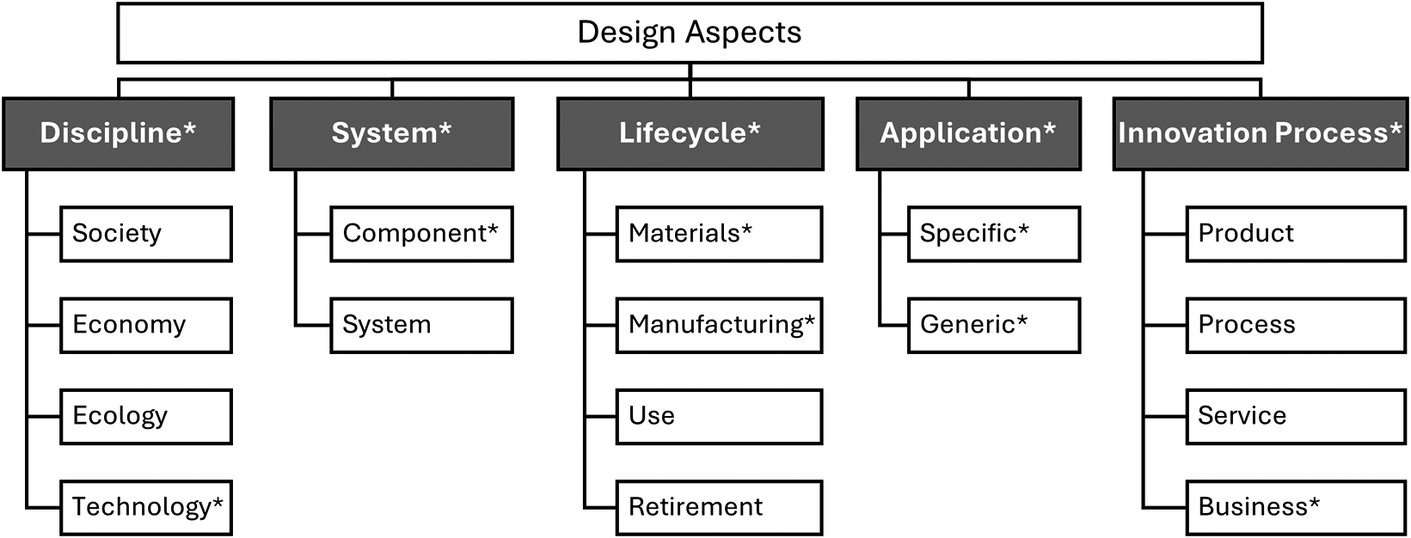


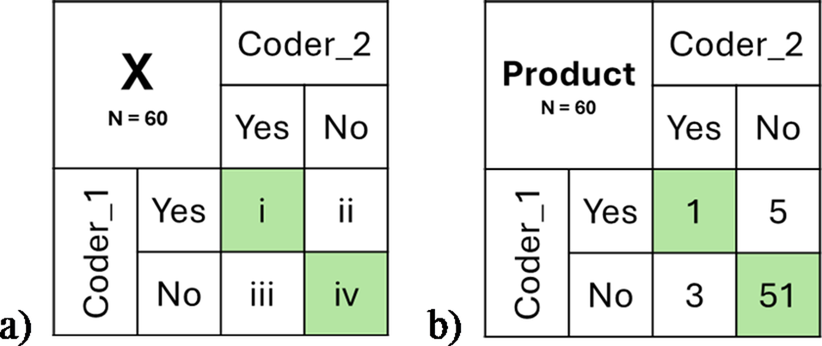


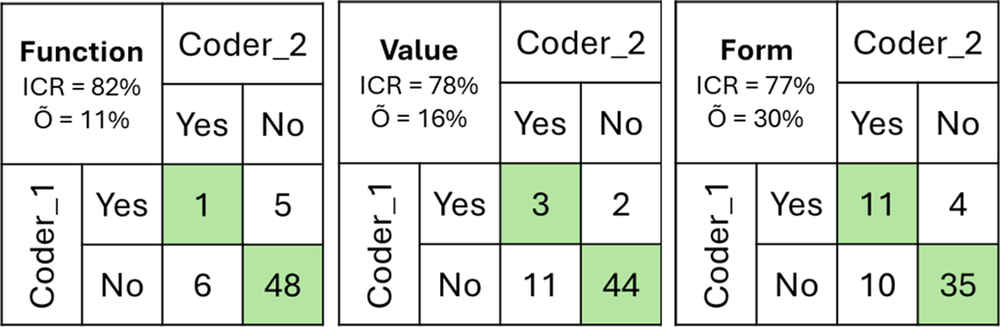
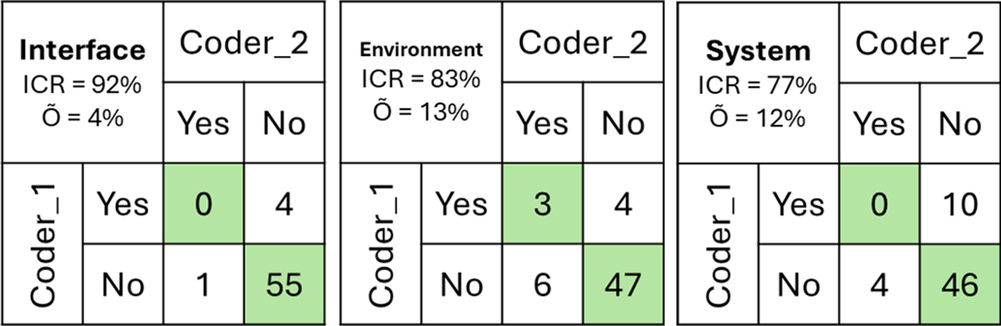
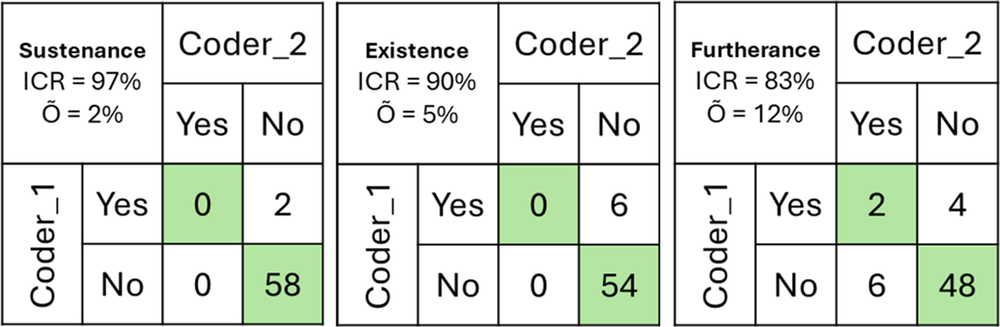
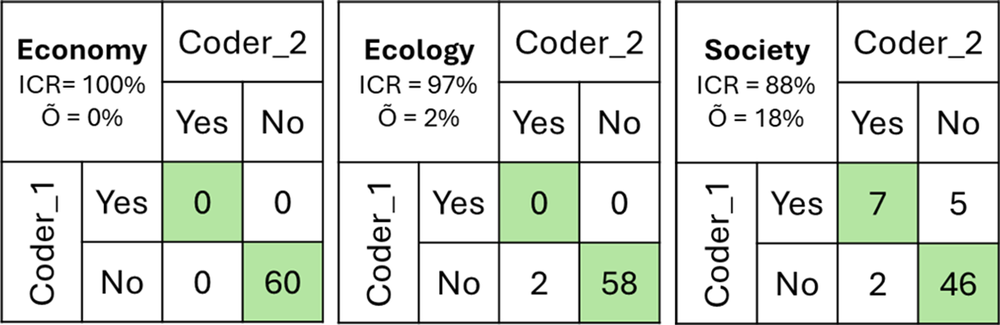


 Open access

