Introduction
The Brazilian semiarid region experiences fluctuations in both space and time in rainfall, with annual variations of 400 to 800 mm, a rainy season lasting three to five months and droughts that can vary from seven to nine months (Silva et al., Reference Silva, Queiroz, Zolnier, Souza, Souza, Moura, Araújo, Steidle Neto, Santos, Melo, Cruz Neto, Silva and Alves2020; Reference Silva, Rocha, Lucas, Souza, Montenegro, Souza, Jardim, Souza, Salvador, Carvalho and Araújo Júnior2025). These conditions limit agricultural activities in this region (Fonseca et al., Reference Fonseca, Santos, Silva, Donato, Rodrigues and Brito2019; Brito et al., Reference Brito, Rodrigues Donato, Magalhães Arantes, Silva, Rodrigues Donato and Santos2021; Alves et al., Reference Alves, Jardim, Araújo Júnior, Souza, Araújo, Souza, Salvador, Leite, Pinheiro and Silva2022). In this region, livestock farming plays an important role in the economy, but the soil and climate conditions do support the production of high quantities of good-quality conventional forages, which contributes to poor herd performance (Brito et al., Reference Brito, Rodrigues Donato, Magalhães Arantes, Silva, Rodrigues Donato and Santos2021; Alves et al., Reference Alves, Jardim, Araújo Júnior, Souza, Araújo, Souza, Salvador, Leite, Pinheiro and Silva2022). Given this scenario, the use of forage plants adapted and/or tolerant to local climate conditions becomes essential as a strategy to promote the sustainability of production and guarantee food security for livestock (Fonseca et al., Reference Fonseca, Santos, Silva, Donato, Rodrigues and Brito2019).
The forage cactus is a xerophytic plant that belongs to the Cactaceae family and has morphophysiological characteristics (i.e., thick cuticles, large vacuoles, modified leaves, succulent stems and an adapted root system) that allow it to adapt to semiarid conditions (Marques et al., Reference Marques, Gomes, Mouthé, Braz and Pires Neto2017; Jardim et al., Reference Jardim, Silva, Sandra and Souza2020). It has a Crassulacean Acid Metabolism (CAM), where the stomata open at night to capture atmospheric CO2 and close during the day, thus minimizing the loss of water by the plant to the atmosphere (Taiz et al., Reference Taiz, Zeiger, Moller and Murphy2017; Souza et al., Reference Souza, Silva, Souza, Jardim, Araújo Júnior and Alves2019; Jardim et al., Reference Jardim, Santos, Alves, Ferreira-Silva, Souza, Araújo Júnior, Souza, Araújo, Souza and Silva2021a).
In the semiarid region, the main forage palm clones are the Mexican Elephant Ear (OEM) – Opuntia stricta, the Miuda (MIU) and IPA Sertânia (IPA), both belonging to the species Nopalea cochenellifera. They are widely used due to their distinct agronomic characteristics, which influence the productivity and nutritional value of the forage. Generally, OEM has cladodes with larger area, greater water use efficiency and greater biomass accumulation, while MIU and IPA clones stand out for their greater number of cladodes, but lower water use efficiency (Jardim et al., Reference Jardim, Souza, Alves, Araújo, Souza, Pinheiro, Araújo, Campos, Tabosa and Silva2021c). The use of Opuntia and Nopalea species in feeding ruminant animals has advantages as it is a food rich in water and energy, but includes a low concentration of dry matter (50 – 150 g/kg DM), crude protein (30 – 100 g/kg DM) and fibre [neutral detergent fibre – NDF (220 – 320 g/kg DM) and acid detergent fibre – ADF (100 – 200 g/kg DM)], with variation depending on the season, environmental factors, age, position and clone. (Fonseca et al., Reference Fonseca, Costa, Silva, Donato, Donato and Souza2020; Dubeux Junior et al., Reference Dubeux Junior, Santos, Cunha, Santos, Souza, Mello and Souza2021).
It is known that the response of the morphophysiological indices, phenophases, agronomic characteristics and soil water balance of this crop is linked to the adoption of different agronomic managements (Alves et al., Reference Alves, Silva, Alves, Jardim, Souza, Cruz Neto and Santos2019; Araújo Júnior et al., Reference Araújo Júnior, Silva, Souza, Souza, Araújo, Moura, Santos, Jardim, Alves and Alves2021; Jardim et al., Reference Jardim, Santos, Alves, Ferreira-Silva, Souza, Araújo Júnior, Souza, Araújo, Souza and Silva2021a; Souza et al., Reference Souza, Araújo Júnior, Souza, Jardim, Silva, Araújo, Campos, Leite, Tabosa and Silva2022). The morphophysiological indices allow us to understand the development of the crop, while the phenophase allows us to understand each phase and its duration (Silva et al., Reference Silva, Morais, Souza, Jardim, Alves, Salvador, Souza, Simões, Campos, Steidle Neto, Silveira, Montenegro and Silva2024). In a cactus-sorghum intercropping system, Jardim et al. (Reference Jardim, Silva, Souza, Araújo Júnior, Alves, Souza, Araújo and Moura2021b) observed variations in the growth dynamics and in the variation in the duration and number of phenological phases. While Araújo Júnior et al., Reference Araújo Júnior, Silva, Souza, Araújo, Moura, Alves, Salvador, Souza, Montenegro and Silva2021a also observed these variations in their study when the clones were subjected to different water regimes. Therefore, understanding the different responses to the adopted management becomes a very important strategy for decision-making and, thus, ensuring the success of crop production (Alves et al., Reference Alves, Jardim, Araújo Júnior, Souza, Araújo, Souza, Salvador, Leite, Pinheiro and Silva2022; Salvador et al., Reference Salvador, Jardim, Alves, Araújo Júnior, Silva, Souza, Queiroz, Campos, Gois, França, Nunes Filho, Steidle Neto, Souza and Silva2024).
The intervals of cutting, that is, the interval between harvest cycles, is a decisive factor for the efficiency of use of forage cactus. More frequent cuttings tend to compromise the accumulation of biomass and the full development of cladodes, although they provide better nutritional value. On the other hand, longer intervals favour productivity, but result in a reduction in nutritional quality (Rocha et al., Reference Rocha, Voltolini and Gava2017; Reis Filho et al., Reference Reis Filho, Carneiro, Pereira, Furtado, Morais Neto, Magalhães, Alves and Lopes2022). Therefore, determining the ideal cutting interval is essential to balance production and forage quality.
Farias et al. (Reference Farias, Lira, Santos, Tavares Filho, Santos, Fernandes and Santos2000) studied the ‘Gigante’ forage cactus clone intercropped with forage sorghum and subjected to cuts every two and four years and found greater productivity with the cut performed every four years. Rocha et al. (Reference Rocha, Voltolini and Gava2017) evaluating the forage cactus clones Opuntia stricta and Nopalea cochenillifera, with four cutting intervals (4, 8, 12 and 16 months), observed better performance in the number of cladodes, cladode area index and productivity at 16 months. Similarly, Reis Filho et al. (Reference Reis Filho, Carneiro, Pereira, Furtado, Morais Neto, Magalhães, Alves and Lopes2022), identified the same behaviour when testing cutting intervals of 6, 9, 12 and 18 months in the same clone, with gains in productivity and structural characteristics as cutting interval decreased, observing an increase in water use efficiency in the 6-month cutting interval. These results highlight the importance of understanding the response of forage cactus under different cutting managements, to guide more efficient and efficient decisions by producers.
Although previous studies have shown that higher cutting interval favour the productivity and structural development of forage cactus, there is still little integration between these variables and aspects such as water use efficiency, soil water balance and the economic impacts of this management in semiarid conditions. Thus, the gap that this study sought to fill was the absence of a multidimensional approach that simultaneously evaluated the effects of different cutting intervals and clones on morphological, phenological, agronomic, water and economic parameters. Therefore, the study hypothesis was that the use of lower cutting frequencies (with longer cutting intervals) could have a positive influence on morphophysiological indices, productivity, soil water balance components, water use efficiency and economic indicators. The objective was to evaluate the influence of different cutting intervals and forage cactus clones on the response of morphophysiological indices, phenophases, cutting times, agronomic characteristics, soil water balance, water use efficiency and economic indicators of forage cactus grown in a semiarid environment.
Materials and methods
Location characterisation
The research was carried out at the Federal Rural University of Pernambuco – Academic Unit of Serra Talhada, specifically at the International Reference Center for Agrometeorological Studies of Cactus and Other Forage Plants, located in the municipality of Serra Talhada, Pernambuco, Brazil (7º56’20” S, 38º17’31” W and elevation of 499 m above sea level). According to the Köppen climate classification, the region’s climate is BSh (i.e., hot semiarid) (Alvares et al., Reference Alvares, Stape, Sentelhas, Moraes Gonçalves and Sparovek2013). It has an average air temperature of 24.8 ºC, relative humidity of 63%, with rainfall and reference evapotranspiration of 642 and 1,800 mm/year, respectively (Pereira et al., Reference Pereira, Silva, Zolnier, Morais and Santos2015; Silva et al., Reference Silva, Primo, Moura, Silva, Morais, Pereira and Souza2015a).
The soil of the experimental area is located on a flat terrain and was classified as a Typical Eutrophic Ta Haplic Cambisol, according to the Brazilian Soil Classification System (Santos et al., Reference Santos, Jacomine, Anjos, Oliveira, Lumbreras, Coelho, Almeida, Filho, Oliveira and Cunha2018), with a sandy texture. The chemical and physical analyses of the soil were performed from samples collected at a depth of 0.00 to 0.20 m, which were sent to the Embrapa Semi-Arid Soil Laboratory for characterization. The result of the physical characterization was sand of 831.8 g/kg, silt of 123.6 g/kg, clay of 291.7 g/kg, total porosity of 35.7% and soil density of 1.45 g/cm3. The chemical characterization was pH (water) of 6.8, electrical conductivity of the saturated soil paste extract of 0.69 dS/m, phosphorus (P) of 72.3 mg/dm3, potassium (K+) of 1.0 cmolc/dm3, sodium (Na+) of 0.03 cmolc/dm3, calcium (Ca2+) of 4.25 cmolc/dm3, magnesium (Mg2+) of 1.90 cmolc/dm3, cation exchange capacity (CEC) of 7.80 cmolc/dm3, base saturation (V) of 92.3% and organic carbon (SOC) of 5.30 g/kg.
Experimental design, irrigation management and cultural treatment
The experiment was arranged in randomised blocks in a 4 x 3 factorial scheme, with four cutting intervals: 6, 9, 12 + 6 (2 harvests) and 18 months (these cutting intervals were determined through previous studies, referring to the harvest of irrigated forage cactus) and three clones of forage palm, belonging to the Opuntia genera: ‘Orelha de Elefante Mexicana’ [O. stricta (Haw.) Haw] – OEM, ‘Miúda’ [N. cochenillifera (L.) Salm-Dyck] – MIU and ‘IPA Sertânia’ [N. cochenillifera (L.) Salm-Dyck] – IPA, with four replicates, totalling 48 experimental units (Figure 1).
Details of the experimental design.

The forage cactus clones were planted at fixed spacing of 1.00 × 0.20 m (50,000 plants/ha), with bilateral alignment, burying 50% of the total length of the clade. Each experimental unit was 5 m long, with four rows each and 25 plants, totalling an area of 20 m2. The two central rows of each plot were considered the useful plot, disregarding one plant at each end. This results in an area of 9.20 m2/plot.
The experiment was conducted between October/2020 and May/2022 [totalling ∼18 months (576 days)], during the fourth productive cycle of the crop, starting with the presence of fully developed primary cladodes in the field. Table 1 shows the cuts performed at each cutting interval. The forage cactus clones were planted in January 2016, with a history of the area being intercropped with forage sorghum [Sorghum bicolor (L.) Moench], cultivars IPA-467, SF11, Progenitor 288 and 2502.
Start dates of treatments and cuts, at each frequency used in the study in different clones of forage palm cultivated in a semiarid region

The experiment was irrigated on Mondays, Wednesdays and Fridays using a drip irrigation system with emitters spaced 0.20 m apart, a flow rate of 1.57 L/h, a working pressure of 100 kPa and a water application uniformity coefficient of 92%. The water used for irrigation came from an artesian well with a depth of 48 m and a flow rate of 12 m3/h, located 30 m from the experimental area, with an electrical conductivity of 1.62 dS/m. According to the FAO (Food and Agriculture Organization of the United Nation), the water was classified as slightly saline (electrical conductivity ranging from 0.7 to 2.0 dS/m) (Westcot and Ayers, Reference Westcot, Ayers, Pettygrove and Asano1985) and with a pH of 6.84. Management was based on the crop’s water requirements (crop evapotranspiration – ETc), with a crop coefficient (Kc) of 0.52 (Queiroz et al., Reference Queiroz, Silva, Zolnier, Silva, Souza and Carvalho2016). ETc was determined by the product of reference evapotranspiration (ET0) and Kc, with ET0 determined daily by the Penman-Monteith equation (Equation 1), parameterised by the FAO (Allen et al., Reference Allen, Pereira, Raes and Smith1998).
 $${\rm{E}}{{\rm{T}}_{\rm{0}}}{\rm{ = }}{{{\rm{0}}{\rm{.408}}\Delta \left( {{\rm{Rn - G}}} \right){\rm{ + \gamma }}{{{\rm{900}}} \over {{\rm{T + 273}}}}{\rm{\mu 2(es - ea)}}} \over {\Delta {\rm{ + \gamma (1 + 0}}{\rm{.34\,\mu 2)}}}}$$
where ET0: reference evapotranspiration (mm/day); Δ: slope of the water vapour saturation pressure curve (kPa/ºC); Rn: net radiation (MJ/m2/day); G: sensible heat flux density in the soil (MJ/m2/day); T: daily average air temperature at a height of 2 m (ºC); µ2: daily wind speed at a height of 2 m (m/s); es: saturation vapour pressure (kPa); ea: actual air vapour pressure (kPa); and γ: psychrometric constant (kPa/ºC).
Meteorological variables were obtained daily from an automatic meteorological station belonging to the National Institute of Meteorology (INMET – http://www.inmet.gov.br/portal/), located 10 m from the experiment. From April 2022 onwards, meteorological variables were monitored using an Onset meteorological station model: HOBO U30 installed 10 m from the experimental area.
The development cycle of the forage cactus with different cutting interval was approximately 18 months (October–2020 to May–2022), where there was a total rainfall (P) of 1457.9 mm and irrigation depth (ID) of 275.65 mm, the total reference evapotranspiration was 2923.14 mm (Figure 2), with an average of 5.07 mm day-1.
Reference evapotranspiration (ET0, mm) and water availability via rainfall (R, mm) and irrigation depth (ID, mm) in the cultivation of forage cactus, clones ‘Orelha de Elefante Mexicana’ (Opuntia stricta – OEM), ‘Miúda’ (Nopalea cochenellifera – MIU) and IPA Sertânia (Nopalea cochenellifera – IPA) in a semiarid environment, cultivated under different cutting practices.

Morphophysiological indices, phenology and cutting time
Biometric data of the forage cactus clones was collected at different cutting intervals to measure growth, morphophysiological indices, phenophases and other responses to harvest. These data were obtained from one plant per experimental unit, totalling 48 plants in the whole experiment. The variables measured were plant height and width (PH and PW), total number of cladodes (TNC, units), number of first order cladodes (CN1, units) and number of successively higher orders (CN2 – where the number represents the order in which the cladode appeared).
Cladode biometric data was also obtained, with one cladode chosen for each order, such as cladode length, cladode width, cladode thickness and perimeter of the cladode (CL, CW, CT and CP, respectively). Biometric data was obtained using a tape measure, with the exception of CT, which was obtained using a calliper. From these data, it was possible to calculate the cladode area (CA, cm2) for the three forage cactus clones and the cladode area index (CAI, m2/m2) using Equations 2, 3, 4 and 5, respectively (Pinheiro et al., Reference Pinheiro, Silva, Sousa Carvalho, Santos, Morais, Zolnier and Santos2014; Silva et al., Reference Silva, Primo, Moura, Silva, Morais, Pereira and Souza2015a).
 $${\rm{C}}{{\rm{A}}_{{\rm{IPA}}}}{\rm{\; = \;1}}{{\rm{.6691}}}{{{\left( {{\rm{1 - exp}}\left( {{\rm{0}}{\rm{.0243\; \times \;CP}}} \right)} \right)}} \over {{{\rm{ - 0}}{\rm{.0243}}}}}$$
 $${\rm{C}}{{\rm{A}}_{{\rm{MIU}}}}{\rm{\; = \;0}}{\rm{.7198\; \times \;CL\; \times \;CW}}$$
 $${\rm{C}}{{\rm{A}}_{{\rm{OEM}}}}{\rm{\; = \;0}}{\rm{.7086}}{{{\left( {{\rm{1 - exp}}\left( {{\rm{ - 0}}{\rm{.000045765\; \times \;CL\; \times \;CW}}} \right)} \right)}} \over {{{\rm{0}}{\rm{.000045765}}}}}$$
 $${\rm{CAI\; = }}{{{{{\left( {\mathop \sum \nolimits_{\rm{n}}^{{\rm{i = 1}}} {\rm{CA}}} \right)}} \over {{{\rm{10000}}}}}} \over {{{\rm{S1\; \times \;S2}}}}}\;$$
where CA – cladode area (cm2); CL, CW and CP – cladode length, cladode width and perimeter of the cladode, respectively; 10000 – conversion factor from cm2 to m2; S1 and S2 – row and plant spacing.
Data on the morphophysiological indices of the three forage cactus clones were obtained from regression analyses using a three-parameter sigmoidal model, with the values of dry matter (DM) or CAI being correlated with the independent variable thermal sum, or accumulated degree days (ADD, ºCday). The ADD was determined using data on the average air temperature (ºC) and the lower base temperature of the forage cactus, which is 22 ºC, according to the methodology of Araújo Júnior et al. (Reference Araújo Júnior, Silva, Souza, Araújo, Moura, Alves, Salvador, Souza, Montenegro and Silva2021a). With a high coefficient of determination (R2 ≥ 0.80) and the significance of the model parameters, the equation was derived to determine the absolute growth rate (AGR, Mg/ha/ºCday). From the AGR, the relative growth rate (RGR, Mg/Mg/ºCday), net assimilation rate (NAR, Mg/Mg/ºCday) and specific cladode area rate (SCA, ha/Mg) were also determined, according to the methodology of Souza et al. (Reference Souza, Araújo Júnior, Souza, Jardim, Silva, Araújo, Campos, Leite, Tabosa and Silva2022).
Three-parameter regression analyses were carried out using the number of cladodes of each respective order, correlated with the ADD. The model was derived to obtain the cladode emission rate (CER). The phenophase was determined using the CER, considering a change when the rate of any higher order was exceeded by the rate of cladode emission of the previous order (Araújo Júnior et al., Reference Araújo Júnior, Silva, Souza, Araújo, Moura, Alves, Salvador, Souza, Montenegro and Silva2021a; Souza et al., Reference Souza, Araújo Júnior, Souza, Jardim, Silva, Araújo, Campos, Leite, Tabosa and Silva2022). To determine the ideal cutting time, the absolute growth rate (AGR), or DM accumulation, was taken into account, where 25% of the ADD of the maximum biomass accumulation (i.e., the ideal cutting time is after 25% of the AGR).
Forage yield
The productivity of the cactus pear was determined at the end of cycles equivalent to 18 months in all treatments. The cutting intervals evaluated were 6, 9, 12 + 6 and 18 months. In the 6-month treatment, three cuts were performed throughout the experimental period: on April 14, 2021, October 12, 2021, and May 10, 2022. In the 9-month treatment, two cuts were performed: on July 13, 2021, and May 10, 2022. In the 12 + 6 treatment, one cut was made at 12 months (October 12, 2021) and another at 6 months (May 10, 2022), totalling two cuts, which allowed evaluating the effect of a late cut followed by an earlier cut. The 18-month treatment consisted of only one cut at the end of the cycle (May 10, 2022). This experimental strategy allowed comparing different management regimes, maintaining the same total evaluation period (18 months). In each cut, the useful parcel (central rows) of crop development was taken into account, with only basal cladodes and first-order cladodes remaining in the field. The cladodes were weighed on an electronic scale to determine the fresh mass yield.
To determine the dry matter content, a representative plant from each plot was harvested and weighed, with only the basal cladode remaining in the field. Subsequently, a representative cladode of each order was selected from each plot, weighed, cut, packed in paper bags and placed in a forced-air oven, at 55 ºC, until a constant weight was reached. The final fresh matter yield was estimated from the fresh mass (FM, Mg/ha) and final plant density (plants/ha), where there was a mortality rate of 10%, 74% and 73% for OEM, IPA and MIU clones, respectively. The dry mass yield (DM, Mg/ha) was obtained from the final FM yield and the DM content.
Components of soil water balance
The soil water balance (SWB) makes it possible to quantify the water input variables in the soil (i.e., rainfall, irrigation, capillary rise and surface runoff) and the output variables (i.e., surface runoff, evaporation and deep drainage). In this study, SWB was determined using the method of Libardi (Reference Libardi2005), which is based on the law of conservation of water mass in a known volume of soil (Equation 6).
 $${\rm{ \pm }}\Delta {\rm{S = R + ID \pm SR \pm Q - ETa}}$$
where ΔS – variation in water storage in the soil (mm); R – rainfall (mm); ID – irrigation depth (mm); SR – surface runoff (mm); Q – vertical flow of water in the soil (mm), when it is positive, capillary rise has occurred, when it is negative, drainage (DD) has occurred; ETa – actual evapotranspiration (mm).
Soil moisture was monitored using a capacitive probe (Diviner 2000®, Sentek Pty Ltd., Australia) and access tubes inserted to a depth of 0.70 m from the surface, obtaining frequency and moisture values every 0.10 m. These readings were taken three times a week (Mondays, Wednesdays and Fridays), always before the irrigation events. The probe was calibrated according to the methodology of Araújo Primo et al. (Reference Araújo Primo, Silva, Silva, Moura and Souza2015).
To determine the SWB components, the data set was organised to obtain responses on a weekly basis (i.e., every seven days), taking into account the control layer at a depth of 0.60 m (z). The variation in soil water storage was determined by the difference between the final and initial soil water storage values. Rainfall (R) was monitored using an automatic rain gauge from the National Meteorological Institute (INMET) station, located near the experimental area. The volumes of water applied during irrigation depth (ID) were also calculated, using the methods described above. In the end, the R and ID values were summed for an interval of every seven days. Surface runoff (SR) was determined using polynomial regression (y = y0 + ax + bx2, R2 = 0.92), with a correlation between the amount of water precipitated and surface runoff. The rainfall runoff was obtained by installing drainage gutters measuring 1.00 × 1.00 m (1 m2).
The density of water flow in the soil (Q) can be positive or negative, being capillary rise (CR = positive), or deep drainage (DD = negative), this was determined using the Darcy-Buckingham equation (Libardi, Reference Libardi2005), which uses the hydraulic conductivity of the soil [K(θ)] and total water potential gradient in the soil (Δψt/Δz), with the total water potential in the soil obtained at depths of 0.70 m. These parameters were obtained using procedures described by Silva et al. (Reference Silva, Araújo Primo, Morais, Diniz, Souza and Silva2015b), using the instantaneous profile method (Libardi, Reference Libardi2005). By determining the components of the SWB, it was possible to determine the actual evapotranspiration (ETa), which is the residue of the SWB.
Water use indicators and economic analysis
The determination of water indices was based on the methodology of Fernández et al. (Reference Fernández, Alcon, Diaz-Espejo, Hernandez-Santana and Cuevas2020), which takes into account actual evapotranspiration data, rainfall and crop data such as fresh and dry matter yields. This determined the crop’s water use efficiency (WUEc, m3/m3), which takes into account the ratio of the sum of ETa, P and ID (Equation 7). Water indices were also determined, with water use efficiency (*WUEc, kg/m3) (Equation 8), crop water productivity in relation to DM and evapotranspiration (WPc, kg/m3) (Equation 9), or also in relation to the amount of water received via rainfall plus irrigation (*WPc, kg/m3) (Equation 10). In addition to the productivity of irrigation water (WPi, kg/m3) (Equation 11).
 $${\rm{WUEc = }}{{{{\rm{\Sigma ETa}}}} \over {{{\rm{\Sigma R + ID}}}}}$$
 $${\rm{*WUEc = }}{{{{\rm{Biomass}}}} \over {{{\rm{\Sigma ETa}}}}}$$
 $${\rm{WPc = }}{{{{\rm{YieldDM}}}} \over {{{\rm{\Sigma ETa}}}}}$$
 $${\rm{*WPc = }}{{{{\rm{YieldDM}}}} \over {{{\rm{\Sigma R + ID}}}}}$$
 $${\rm{WPi = }}{{{{\rm{YieldDM}}}} \over {{{\rm{\Sigma ID}}}}}$$
where ETa – actual evapotranspiration (m3/ha); R + ID – rainfall + irrigation depth (m3/ha); Biomass – crop fresh matter yield (kg/ha); YieldDM – dry matter yield (kg/ha).
Using the same data input as the water indices, it was also possible to determine economic indicators, which also required determining the fixed and variable costs of setting up the cactus grove. This study used the US dollar as its base. As a result, the gross economic productivity of water via irrigation was calculated (GEWPI, US$/m3); economic net productivity of irrigation (NEWPi, US$/m3); economic water productivity of the crop (EWPc – US$/m3); and economic productivity of irrigation water (EWPi – US$/m3) (Equations 12, 13, 14 e 15, respectively), obtained according to Fernández et al. (Reference Fernández, Alcon, Diaz-Espejo, Hernandez-Santana and Cuevas2020).
 $${\rm{GEWPi = }}{{{{\rm{gross\;margin}}}} \over {{{\rm{\Sigma ID}}}}}$$
 $${\rm{NEWPi = }}{{{{\rm{net\;margin}}}} \over {{{\rm{\Sigma ID}}}}}$$
 $${\rm{EWPc = }}{{{{\rm{Profit}}}} \over {{{\rm{\Sigma R + ID}}}}}$$
 $${\rm{EWPi = }}{{{{\rm{Profit}}}} \over {{{\rm{\Sigma ID}}}}}$$
where gross margin – obtained by the difference between revenue and variable costs; net margin – difference between revenue and costs (variable and fixed); Profit – profit or loss generated by the crop; R and ID – rainfall and irrigation depth, respectively.
The economic analysis was based on the productive reality of the semiarid region, using a set of indicators adapted to the specific investment level of local agricultural systems. Total revenue was calculated based on the production of fresh mass of cladodes, expressed in megagrams per hectare (Mg/ha), using the market value of US$ 28.79 per Mg (exchange rate: 1 USD = 5.21 BRL). Fixed costs included the acquisition and installation of the motor pump set and suction system, crop implementation costs (soil preparation, acquisition of propagation material, fertilisation and planting), harvesting and depreciation of contained assets. Variable costs include expenses such as electricity and labour for maintenance of the cultivation area.
Furthermore, the opportunity cost of the crop was considered, estimated based on the potential value of the sale of commercial cladodes. This was determined from the quantity of second-order cladodes (representing the middle third of the plant, considered marketable) multiplied by the unit market value of US$ 0.03 per cladode.
Data analysis and statistical tests
The experimental data were initially organised in Excel spreadsheets and subsequently subjected to statistical analysis. First, descriptive statistics and verification of the assumptions of analysis of variance (ANOVA) were performed, including the normality test of residuals (Shapiro-Wilk) and homoscedasticity (Bartlett) test for residuals, using the statistical model of equation 16.
 $${Y_{ijk}}{\rm{ = \;\mu + }}{A_i}{\rm{ + }}{B_j}{\rm{ + }}{\left( {AB} \right)_{ij}}{\rm{ + }}{R_k}{\rm{ + }}{\varepsilon _{ijk}}$$
where: Yijk – Is the observed value of the response variable for the i-th level of factor A (cutting interval), j-th level of factor B (clone), in the k-th block; μ – overall average of the experiment; Ai - fixed effect of cutting interval level; Bj – fixed effect of forage cactus clone level; (AB)ij – fix ed effect of the interaction between cutting interval and forage cactus clones; Rk – random block effect; εijk – random error.
When necessary, data transformations (such as logarithm or square root) were applied to meet these assumptions. ANOVA was used for the structural characteristics of productivity and water use efficiency, and economics considering the factors ‘cutting interval’ and ‘clone’ as fixed effects, while the block was treated as a random effect, representing the uncontrolled variation of the experimental environment. When there was a significant interaction between the factors, the results were analysed together. Otherwise, the factors were evaluated separately. These data were interpreted and the means were compared using the Scott-Knott test at 5% probability (p <0.05). Statistical analyses were performed using RStudio software (R Core Team, 2018).
Results
Morphophysiological indices, phenophases and cutting times
When analysing different cutting managements for the different forage cactus clones, it was observed that the morphophysiological indices in the last cut of each studied interval behaved differently (Fig. 3). In terms of absolute growth rate (AGR), the forage cactus clone O. stricta – OEM showed greater biomass accumulation at the beginning and during the crop cycle. However, its highest AGR occurred at 18 months (Fig. 3D), at 0.02584 Mg/ha/ºCday [1069.2 ºCday, ∼206 days after cutting (DAC)]. The N. cochenillifera – IPA clone showed the highest biomass accumulation rate in all cutting managements, with the highest rate in the 18-month cut (0.0231 Mg/ha/ºCday, at 911.6 ºCday, ∼165 DAC). It is also worth mentioning that the IPA clone reached maximum AGR earlier than the OEM clone in the 18-month cut, with a difference of approximately 41 DAC.
Morphophysiological indices: absolute growth rate (AGR) in the cutting interval of 6 months (A), 9 months (B), 12 + 6 months (C) and 18 months (D); and relative growth rate (RGR) in the cutting intervals of 6 months (E), 9 months (F), 12 + 6 months (G) and 18 months (H) in the cultivation of forage cactus, clones ‘Orelha de Elefante Mexicana’ (OEM), ‘Miúda’ (MIU) and ‘IPA Sertânia’ (IPA).

The relative growth rate (RGR) generally showed its highest rate at the beginning of the cycle for all clones and cutting managements, with a significant reduction over the course of the crop development cycle. At 6 months, the MIU clone had the highest RGR of 0.0037333 Mg/Mg/ºCday (Fig. 3E), while the IPA clone had the highest RGR at 9 months (Figure 3F), with an average value of 0.0042 Mg/Mg/Cday. When the OEM clone was analysed, cutting at 12+6 and 18 months had the highest rates, 0.0027 and 0.0025 Mg/Mg/ºCday, respectively (Figs. 3G and H).
Figure 4 shows the net assimilation rates (NAR) and specific cladode area (SCA) for the three forage cactus clones subjected to the different cutting managements. The NAR showed different responses, where for the 6- and 9-month cutting managements the highest rate occurred at the beginning of the cycle for the OEM clone, being 0.097 and 0.020 Mg/ha/ºCday, respectively. However, the behaviour of the clones was different for the 12+6 and 18-month cutting managements, where the MIU clone was superior to the OEM and IPA clones, with a net assimilation rate of 0.015 and 0.022 Mg/ha/ºCday, respectively. It is worth noting that for this clone, the highest NAR also occurred at the beginning of the crop cycle.
Morphophysiological indices [net assimilation rate – NAR in the cutting interval of 6 months (A), 9 months (B), 12 + 6 months (C) and 18 months (D); and specific cladode area – SCA in the cutting intervals of 6 months (E), 9 months (F), 12 + 6 months (G) and 18 months (H) in cultivation of forage cactus, clone ‘Orelha de Elefante Mexicana’ (OEM), ‘Miúda’ (MIU) and ‘IPA Sertânia’ (IPA).

The specific cladode area (SCA) in the 9- and 18-month cutting management showed the highest SCA rate at the beginning of the cycle development, where clone IPA showed the highest SCA in the 9-month management (0.7615 ha/Mg), while at 18 months it was clone OEM (1.03 ha/Mg). When observing the response of the SCA in the clones studied, it can be seen that the cut made at 6 months showed a lower SCA at the beginning of the cycle for the OEM and MIU clones, with an increase until the highest SCA was obtained, which was 0.26 ha/Mg (364 ºCday) and 0.37 ha/Mg (1000 ºCday), respectively. At 12 months, the highest SCA occurred in the OEM clone, at 0.3581 ha/Mg (409 ºCday).
In general, the MIU forage cactus clone had more cladodes, with up to 5th order cladodes, compared to the IPA and OEM clones, which only had second and third order cladodes. The greatest number of cladodes was produced at the 18-month cutting stage for all three forage cactus clones (Fig. 5). The IPA and OEM clones showed only two phenophases (phases 2 and 3), characterised by the emission of second and third order cladodes. The MIU clone showed four phenophases (represented by the emission of fourth-order cladodes) in the 12+6 and 18-month cutting managements. It is worth noting that although the MIU clone had 5th order cladodes, the rate at which these cladodes were emitted was not enough to go beyond phenophase 4 and into phenophase 5.
Phenological stages in the vegetative phase of different forage cactus clones ‘Orelha de Elefante Mexicana’ (OEM), ‘IPA Sertânia’ (IPA) and ‘Miúda’ (MIU), subjected to different cutting management [6 months (A), 9 months (B), 12 + 6 months (C) and 18 Months (D)] depending on the accumulated degree days (ADD, ºCday).

When the forage cactus was managed after six months of cultivation, all the clones showed only second-order cladode emission, with the MIU clone being responsible for the highest cladode emission of this respective order (0.046 units/ºCday), with a rate increase of around 104.4% in relation to the other two clones studied.
Observing the clones separately, in relation to the different cutting managements, the highest rate of second-order cladode emission occurred in the 9- and 12+6-month treatments, with 0.028 (317 ºCday) and 0.033 (567 ºCday) units/ºCday. The 9-month and 18-month managements, on the other hand, required a greater amount of ADD, 647 and 870 ºCday, respectively. The OEM clone also had the highest rate of second-order cladode emission when cut at 9 months (0.015 units/ºCday).
Evaluating the ideal time for harvesting based on the absolute growth rate, that is, dry matter accumulation, it can be observed that in all cutting management methods, harvesting could be brought forward, as the AGR begins to slow, indicating low DM accumulation. In the management carried out at 6 months, regardless of the clone, the harvest was anticipated on average at 942 ºCday (∼171 DAC), about 12 days ahead of the harvest. For the 9-month cut, there was greater anticipation for the IPA and OEM clones of 1005.9 and 1107.1 ºCday (∼187 and 222 DAC, respectively), and the MIU clone required a greater amount of ADD to carry out the cut (1172.7 ºCday, ∼242 DAC).
In the 12+6-month treatment, there was no difference in the anticipation of the cutting of the forage cactus for the different clones, thus presenting an average of 1485 ºCday (∼358 DAC), reducing it by only 7 days. In the case of the 18-month cut, the MIU clone required a greater amount of ADD (2109 ºCday, ∼451 DAC) to bring forward the cut, although there was a reduction of 117 days (in relation to the harvest of the experiment). The IPA and OEM clones, on the other hand, were approximately 146 and 128 days earlier.
Biometric data
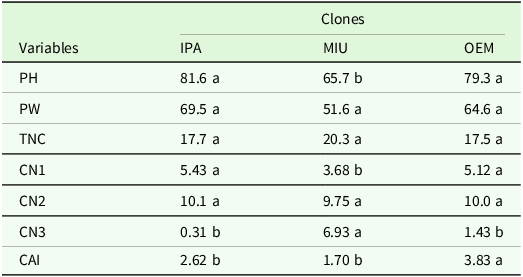
No significant interaction was observed between the forage cactus clone and cutting interval factors (p > 0.05), allowing the analysis of the main effects separately. When evaluating the clone factor (Table 2), significant differences (p < 0.05) were identified for the variables plant height (AP), total length of the new cladode (CNT), length of the first new cladode (CN1), length of the third new cladode (CN3) and cladode area index (CAI). The clones IPA and OEM presented the highest mean values for AP (81.6 cm and 79.3 cm, respectively) and CN1 (5.4 and 5.1 units). For IAC, the highest value was observed in the clone OEM (3.83 m2/m²). On the other hand, the MIU clone stood out with the highest number of cladodes in the third level (CN3), with an average of 6.93 units.
Mean of plant height (PH, cm), plant width (PW, cm), total number of cladodes (TNC, unit) and number of 1st, 2nd and third order cladodes (CN1, CN2 and CN3, in this order) and cladode area index (CAI, m2/m2) of three forage cactus clones (‘Orelha de Elefante Mexicana’ – OEM, ‘Miúda’ – MIU and ‘IPA Sertânia’ – IPA), under different cutting intervals

Lowercase letters that are the same in the row do not present significant differences between them according to the Tukey test at the 5% significance level (p > 0.05).
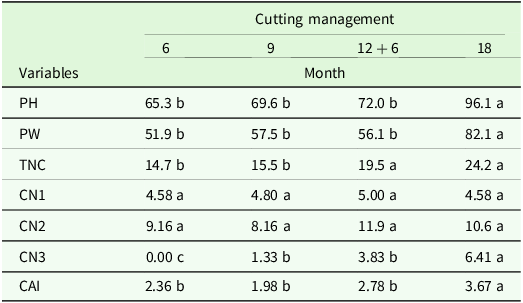
Analysing only the cutting managements (Table 3), there was a significant difference between the variables PH, PW, TNC, CN3 and CAI (p < 0.05) when cutting was performed at 18 months. As a result, there was an increase of 47%, 58%, 72%, 100% and 55%, respectively, with respect to the 6-month cutting interval.
Mean of plant height (PH, cm), plant width (PW, cm), total number of cladodes (TNC, unit) and number of 1st, 2nd and third order cladodes (CN1, CN2 and CN3, in this order) and cladode area index (CAI, m2/m2), subjected to different cutting management and forage cactus clones

Lowercase letters that are the same in the row do not present significant differences between them according to the Tukey test at the 5% significance level (p > 0.05).
Forage yield
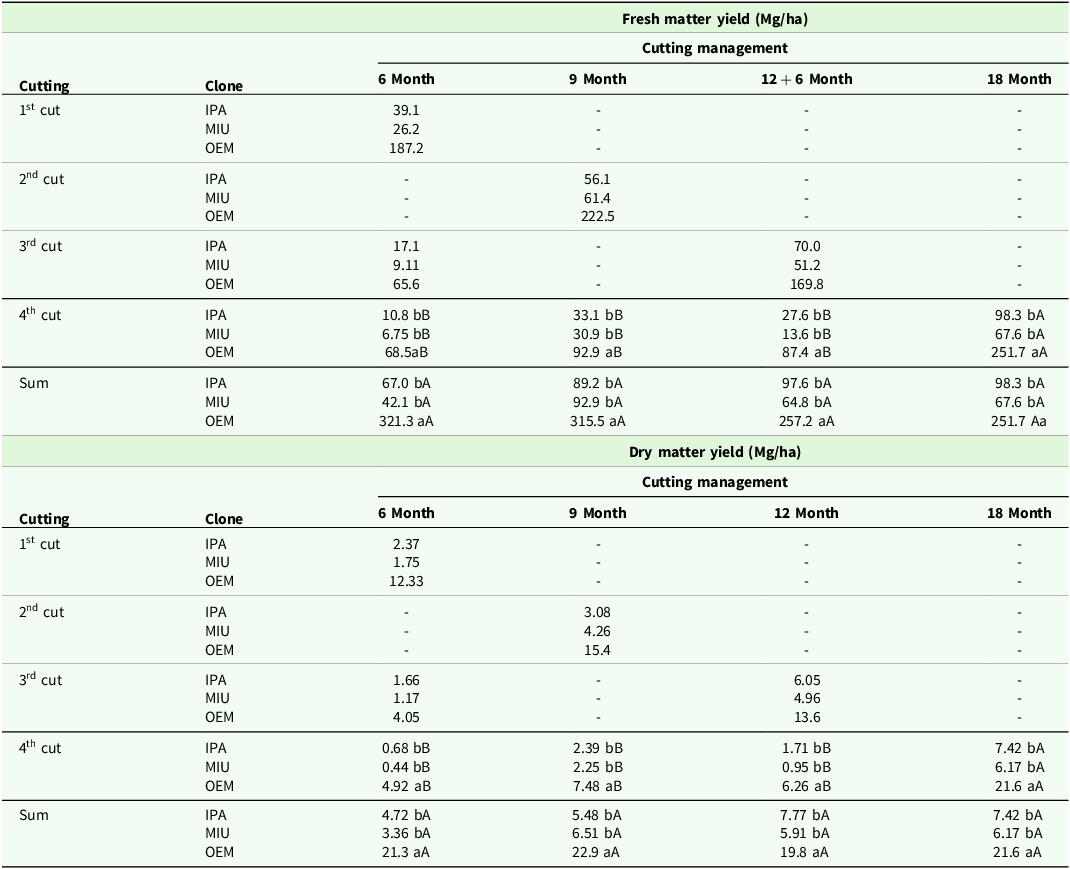
The productivity of the forage cactus pear crop was evaluated at 568 DAC. When analysing only the productivity of the cuts of each interval on May 10, 2022, it was observed that, for all clones, the highest productivity occurred at 18 months (p < 0.05), however, the treatment combination that presented the highest fresh mass (FM) and dry mass (DM) productivities was the OEM clone, regardless of the cutting interval (Table 4).
Mean of Fresh and dry matter yield (Mg/ha) of forage cactus, clones ‘Orelha de Elefante Mexicana’, ‘Miúda’ and ‘IPA Sertânia’, subjected to different cutting interval

Lowercase letters that are the same in the column and uppercase letters are the same in the row, do not show any statistical difference between them according to the Tukey test at 5% significance. 1st cut – 14/04/2021; 2nd cut – 13/07/2021; 3rd cut – 12/10/2021; 4th cut – 10/05/2022; and Sum of all production for each cutting management.
When analysing the total MF and DM productivity of the three forage cactus pear clones (Table 4) at different cutting intervals, the OEM clone showed a significant difference from the other clones (P < 0.05). The OEM clone had productivity of 286.4 Mg/ha and 21.4 Mg/ha of MF and DM, respectively.
Components of soil water balance
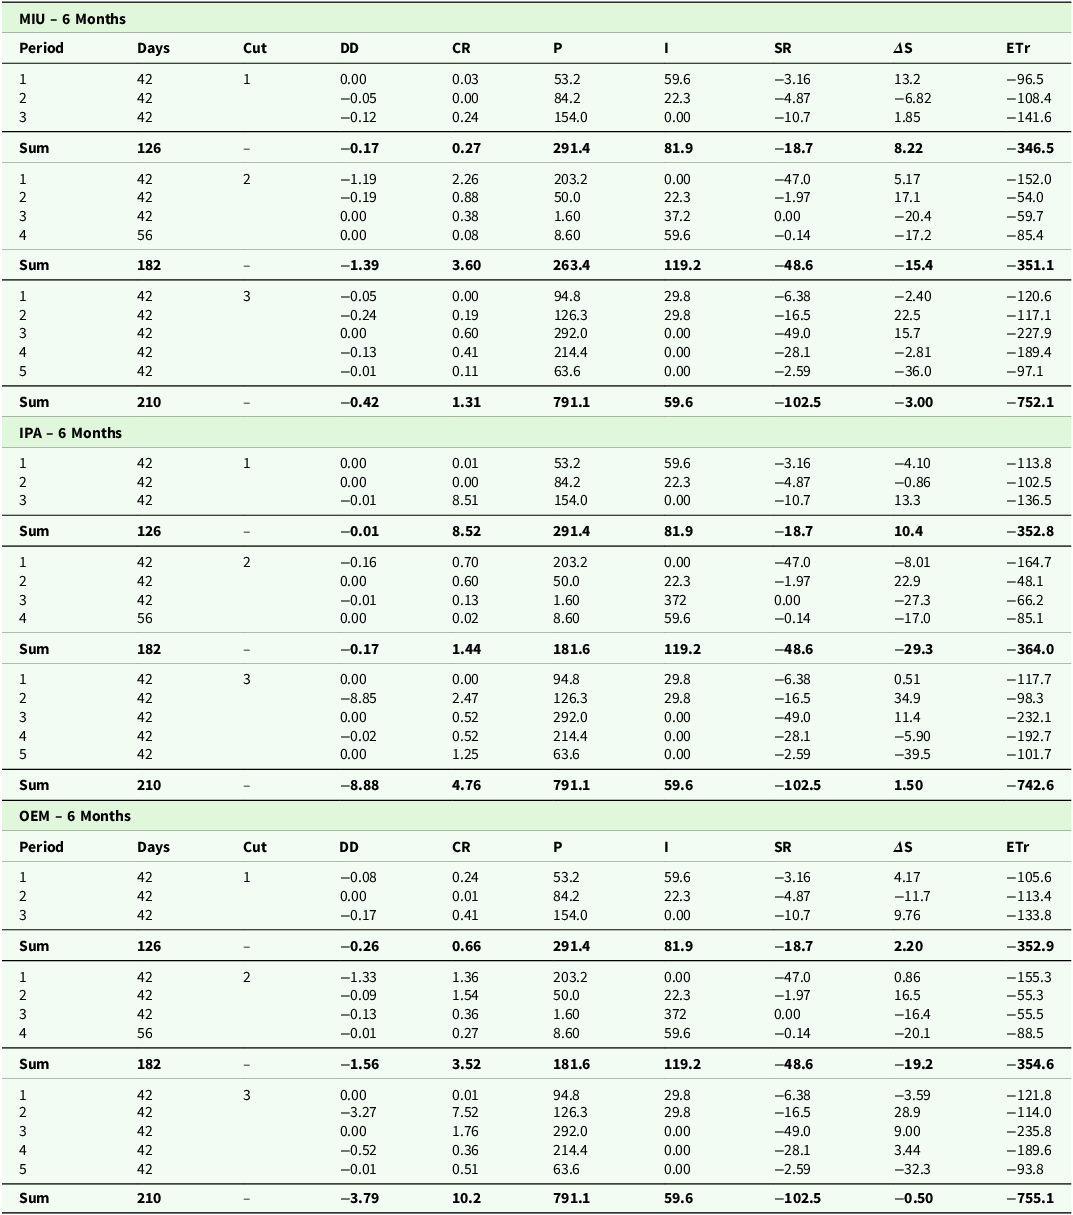
The components of SWB in the three forage cactus clones, in the 6-month cutting management (Table 5), show that for all the clones studied, the third cutting, which was carried out on May 10, 2022 (total period of 210 days), had the highest rainfall (791.1 mm), with the third period (January 4, 2022 to May 9, 2022) accounting for 37% of the total R (292 mm). In this same cut there was a greater event of surface water runoff (-102.5 mm, on average 1.5 mm/day) with the third period showing 48% of the total loss of R. The largest amount of water applied to the forage cactus crop via irrigation was in the second cut (October 12, 2021; ∼182 days), with 119.2 mm, where in the fourth period (August 22, 2021, to October 11, 2021) it accounted for 50% of the total ID.
Mean of components of soil water balance (SWB) in three forage cactus clones, clone ‘Orelha de Elefante Mexicana’, ‘Miúda’ and ‘IPA Sertânia’, in 6-month cutting management in a semiarid environment

R = Rainfall (mm); I = Irrigation (mm); DD = Deep drainage (mm); CR = Capillary rise (mm); SR = Surface runoff (mm); ΔS = Variation in water storage in the soil (mm) and, ETa = Actual evapotranspiration (mm). First cut – April 14, 2021; second cut – October 12, 2021; and third cut – May 10, 2022.
Flow density varied between the clones, both for deep drainage (DD) and capillary rise (CR). The highest total DD occurred in the third cut for the IPA clone, with −8.9 mm and the MIU and OEM clones showed the lowest DD in the sum of the three cuts made every 6 months (-2.0 and 5.6 mm, respectively). CR was higher in the system with the OEM and IPA clones, when the three cuts were added together (14.7 mm), an increase of 154% compared to the MIU clone, which had only 5.8 mm. The variation in soil water storage (ΔS) was positive for the three forage cactus clones in the first cut, with 8.2, 10.4 and 2.2 mm for the MIU, IPA and OEM clones, respectively. In the third cut, it only occurred for the IPA clone (1.5 mm).
The SWB residual, which shows actual evapotranspiration (ETa), was higher in the third cutting (October 10, 2021, to May 9, 2022) for all three clones studied, due to the greater number of days in this cutting and the greater rainfall. The ETa values were −752.1 mm (∼3.6 mm/day), −742.6 mm (3.5 mm/day) and −755.1 mm (3.6 mm/day) for the MIU, IPA and OEM clones, respectively.
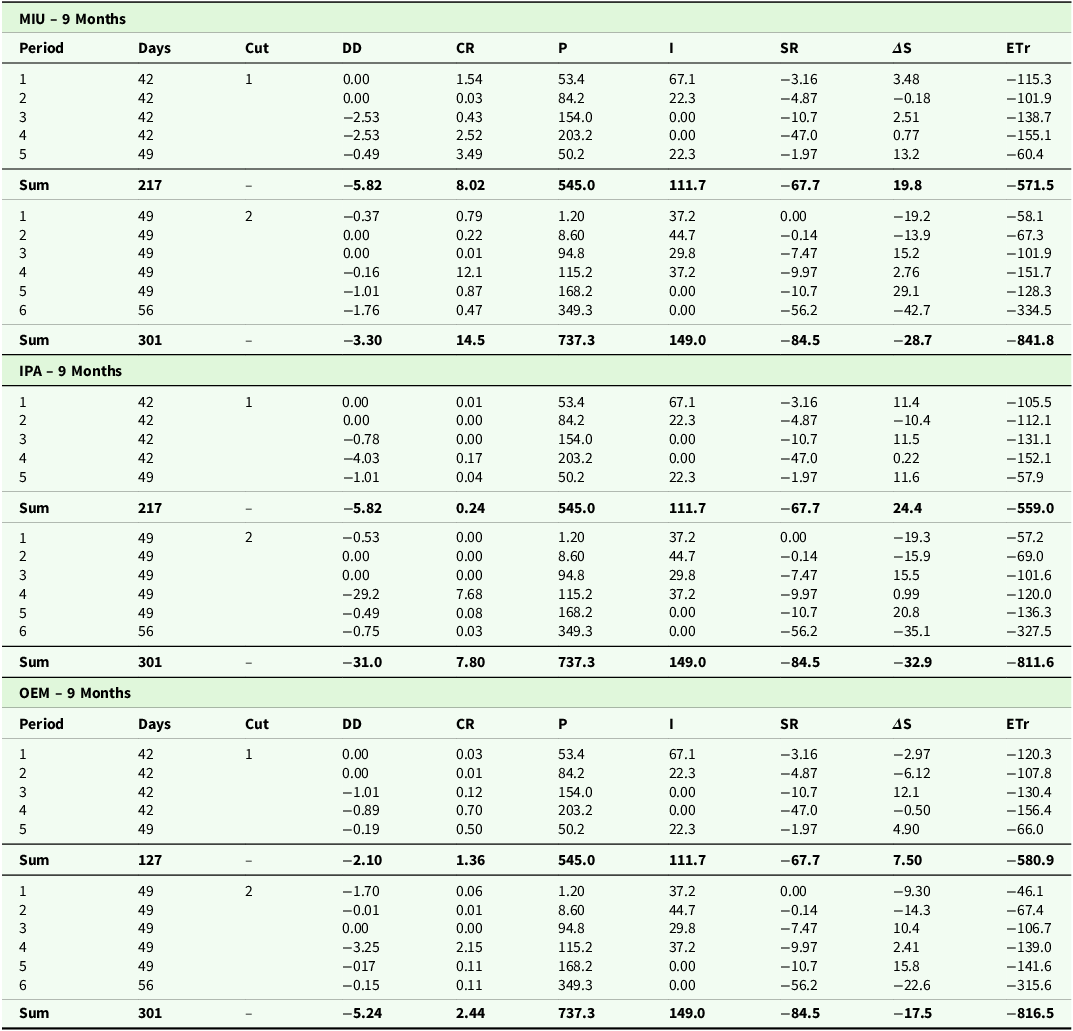
The greatest input of water into the soil system was through rainfall and irrigation (Table 6), in the second cut (May 10, 2022), with a total of 886.3 mm (737.3 mm of R and 149.0 mm of ID). In this cut, the sixth period (March 15, 2022, to May 9, 2022) had the highest R (349.3 mm), corresponding to 47% of the total R. As a result of the rainfall, there was also a greater loss of water through surface runoff (SR) in this same cut (-84.5 mm for the three clones), with the greatest loss occurring in the sixth period (-56.2 mm), representing approximately 67% of the total R. The variation in soil water storage (ΔS) was positive in the first cut, with 24.4 mm, 19.8 mm and 7.50 mm for the IPA, MIU and OEM clones, respectively. While the second cut showed negative values of −32.9 mm, −28.7 mm and −17.5 mm, in the same order.
Mean of components of soil water balance (SWB) in three forage cactus clones, clone ‘Orelha de Elefante Mexicana’, ‘Miúda’ and ‘IPA Sertânia’, in 9-month cutting management in a semiarid environment

R = Rainfall (mm); I = Irrigation (mm); DD = Deep drainage (mm); CR = Capillary rise (mm); SR = Surface runoff (mm); ΔS = Variation in water storage in the soil (mm) and ETa = Actual evapotranspiration (mm). First cut – July 13, 2021; second cut – May 10, 2022.
Water loss through DD was greater in the IPA clone (-31.0 mm) in the second cut made. The MIU clone had the highest capillary rise (14.5 mm), followed by the IPA and OEM clones (7.8 mm and 2.4 mm, respectively). The highest average ETa values were in the second cut, with no significant difference between the clones, with an average value of 841.8 (∼1.6 mm/day), 816.5 (∼1.6 mm/day) and 811.6 mm (∼1.6 mm/day) for the MIU, OEM and IPA clones, respectively. Regarding the first cut, there was a 47%, 45% and 41% increase in ETa in the MIU, IPA and OEM clones, respectively.
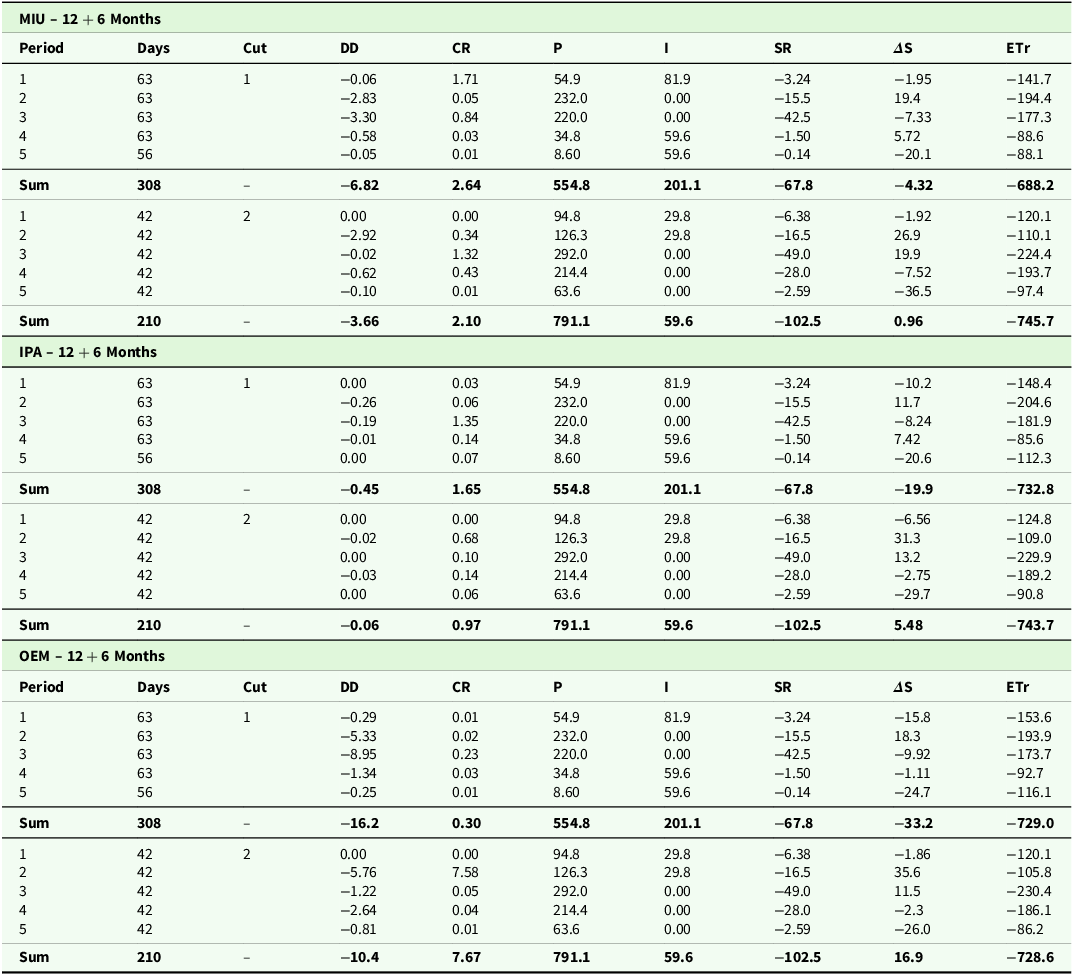
Table 7 shows the components of the water balance when the cactus was managed at 12+6 months. In the first cut, R and ID were 554.8 mm and 201.1 mm and in the second cut 791.1 mm and 59.6 mm. The highest SR values coincided with the rainy periods, being −42.5 mm and −49.0 mm in the first and second cycle, respectively (third period). The total SR was −67.8 mm and −102.5 mm. The average values of CR and DD varied during the periods studied. The highest CR occurred in the OEM clone in the second cut (7.64 mm), followed by the MIU and IPA clones, with 2.64 mm and 1.65 mm (in the first cut). DD showed the greatest loss in the OEM clone, followed by MIU and IPA, at −16.2 mm, −6.82 mm and −0.45 mm, respectively (occurring in the first cut).
Mean of components of soil water balance (SWB) in three forage cactus clones, clone ‘Orelha de Elefante Mexicana’, ‘Miúda’ and ‘IPA Sertânia’, in 12-month cutting management in a semi-arid environment

R = Rainfall (mm); I = Irrigation (mm); DD = Deep drainage (mm); CR = Capillary rise (mm); SR = Surface runoff (mm); ΔS = Variation in water storage in the soil (mm) and, ETr = Actual evapotranspiration (mm). First cut –October 12, 2021; and second cut – May 10, 2022.
When using the OEM clone in the 12+6 month cut in the second cut (210 days), there was greater ΔS) with 16.4 mm. The IPA and MIU clones were 5.48 mm and 0.96 mm, respectively. The first cut (308 days) showed negative average ΔS values. ETa varied between the cuts, but the second cut had higher values, although it varied little among the clones, with an average value of −739.0 mm (3.51 mm/day).
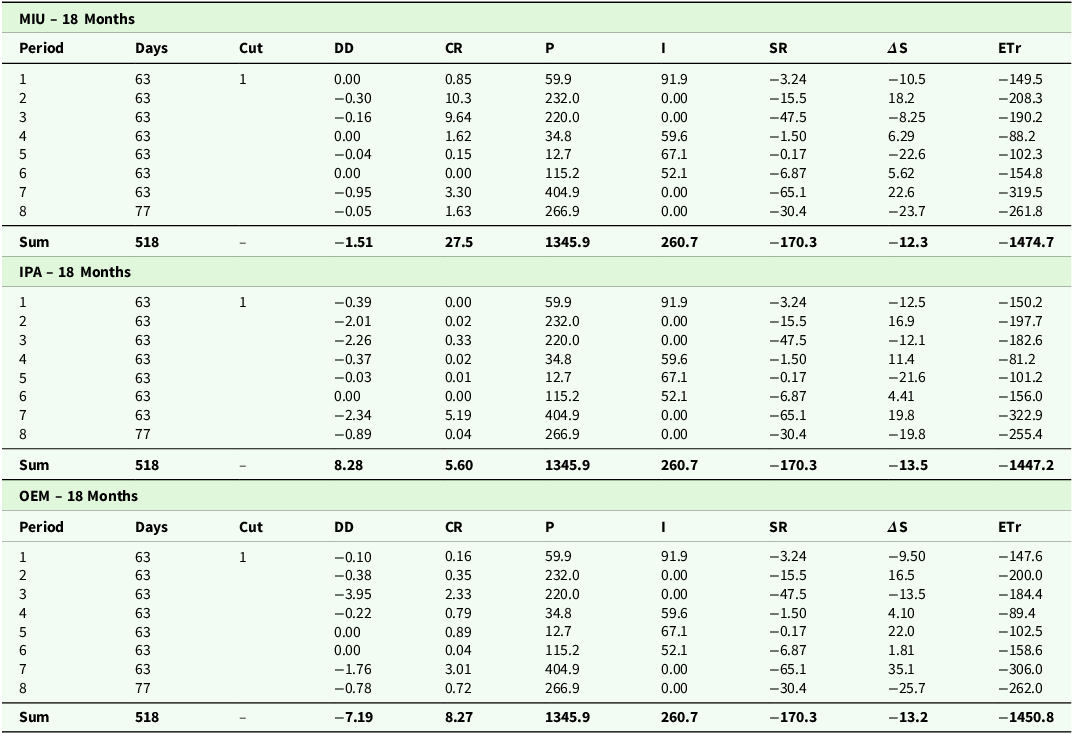
When Table 8 is analysed, the cut carried out only once at 18 months had the highest water input in the system, with 1,345.9 mm via rainfall and 260.7 mm via irrigation, with a loss of water through surface runoff (-170.3 mm). For this management, there was no variation in soil water storage, which was negative for all the clones and the average ETa was 1104.7 mm (2.8 mm/day).
Mean of components of soil water balance (SWB) in three forage cactus clones, clone ‘Orelha de Elefante Mexicana’, ‘Miúda’ and ‘IPA Sertânia’, in 18-month cutting management in a semiarid environment

R = Rainfall (mm); I = Irrigation (mm); DD = Deep drainage (mm); CR = Capillary rise (mm); SR = Surface runoff (mm); ΔS = Variation in water storage in the soil (mm) and, ETa = Actual evapotranspiration (mm). Cut – May 10, 2022.
Water use indicators and economic analysis
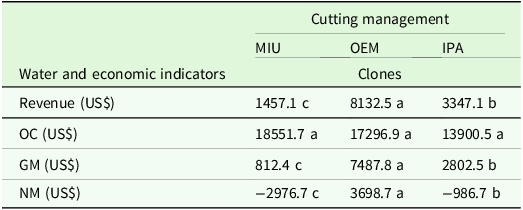
The values of the water and economic indicators showed no interaction between the factors, but there was a significant difference for the clones (p < 0.05). The OEM clone presented the highest revenue, US$ 8,132.5, with an increase of 458% and 163% compared to the MIU and IPA clones (Table 9). Net revenue also showed a significant difference (p < 0.05), with the OEM clone showing a positive result (US$ 3,698.7) and the MIU and IPA clones showing negative responses for net margin.
Mean of economic benefits indicators in three forage cactus clones (‘Orelha de Elefante Mexicana’, ‘Miúda’ and ‘IPA Sertânia’) subjected to different cutting interval

OC = opportunity costs (US$); GM = gross margin (US$); NM = net margin (US$); WUEc and *WUEc = water use efficiency (m3/m3 and kg/m3, respectively); WPc and *WPc = crop water productivity (kg/m3); WPi = water productivity via irrigation (kg/m3); GEWPi = gross economic productivity of water via irrigation (US$/m3); NEWPi = net economic productivity of water via irrigation (US$/m3); EWPc = economic productivity of crop water (US$/m3); EWPi = economic productivity of water via irrigation (US$/m3).
Water use efficiency (WUEc), which considers actual evapotranspiration and water input through rainfall and irrigation, showed an interaction between the studied factors (P < 0.05), with each clone showing a different response between cutting intervals. The OEM clone had the highest UE at the 6-month cutting interval, the IPA clone at the 12+6-month interval and the MIU at the 18-month interval (Figure 6).
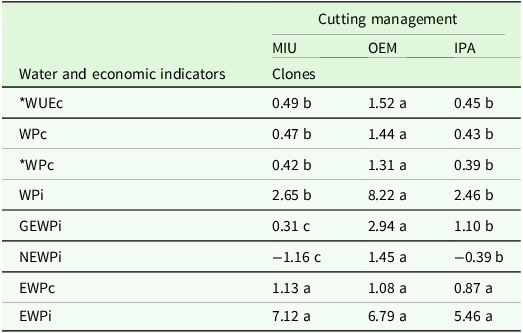
The indicators *WUE, WPc, *WPc and WPi showed significant differences only for the different clones (P < 0.05). The OEM clone outperformed the other clones studied, with averages of 1.52, 1.44, 1.31 and 8.22 kg/m3, respectively. Regarding the economic indicators, only GEWPi, NEWPi and WPI were higher for the OEM clone (P < 0.05) than for the IPA and MIU clones. The economic productivity of irrigation water (EWPi) did not differ statistically (P > 0.05) (Table 10).
Discussion
Morphophysiological indices, phenophases and cutting times
The morphophysiological indices were influenced by the different forage cactus clones, as well as by the cutting interval. The AGR shows the variation in crop growth over time and space (Rees et al., Reference Rees, Osborne, Woodward, Hulme, Turnbull and Taylor2010). The low AGR at the beginning of the crop’s development cycle is related to the low number of cells, which results in a smaller cladode area, not allowing for greater photosynthesis, consequently less conversion of photoassimilates into dry matter (Nunes et al., Reference Nunes, Salvador, Jardim, Araújo Júnior, Carvalho, Souza, Montenegro and Silva2020).
In this study, the highest AGR occurred in the OEM clone at all cutting interval, especially at 18 months. This result is mainly linked to the unique genetic characteristics of each clone, since clones of the species O. stricta have a larger cladode area, allowing greater photosynthetic efficiency, thus favouring a greater accumulation of dry matter throughout the cycle, compared to clones of the genus N. cochenillifera (IPA and MIU) (Araújo Júnior et al., Reference Araújo Júnior, Silva, Souza, Araújo, Moura, Alves, Salvador, Souza, Montenegro and Silva2021a). Rocha et al. (Reference Rocha, Voltolini and Gava2017) and Jardim et al. (Reference Jardim, Souza, Alves, Araújo, Souza, Pinheiro, Araújo, Campos, Tabosa and Silva2021c) also point out that clones of this species present better adaptation and plasticity of photosynthetic metabolism in semiarid regions when irrigated, allowing better growth and development.
This increase in the AGR of OEM compared to the other clones was also observed by Araújo Júnior et al., Reference Araújo Júnior, Silva, Souza, Araújo, Moura, Alves, Salvador, Souza, Montenegro and Silva2021a studying these three clones and different irrigation rates, and by Jardim et al. (Reference Jardim, Souza, Alves, Araújo, Souza, Pinheiro, Araújo, Campos, Tabosa and Silva2021c) evaluating the intercropping of the same clones with three sorghum cultivars, where they also observed that regardless of the configuration adopted, the OEM clone presented an AGR compared to the IPA and MIU clones.
The variation in the RGR is widely used to understand and explain the variation in AGR (Müller et al., Reference Müller, Albach and Zotz2018). This index indicates the increase in the yield of DM, in relation to the amount of pre-existing DM in a given period (Araújo Júnior et al., Reference Araújo Júnior, Silva, Souza, Araújo, Moura, Alves, Salvador, Souza, Montenegro and Silva2021a). The highest values of this index were found at the beginning of the crop’s development cycle, regardless of the clones and cutting interval, as the formation of new tissues is slower to develop (Queiroz et al., Reference Queiroz, Silva, Zolnier, Silva, Lima and Alves2015).
Over the course of the cycle, this index is reduced because of crop growth, where photoassimilates are allocated to other plant structures (i.e., leaves, stems, flowers and fruit) (Gomes et al., Reference Gomes, Cunha, Lopes Filho, Soares, Teixeira and Morais2018; Vasseur et al., Reference Vasseur, Bresson, Wang, Schwab and Weigel2018). Müller et al. (Reference Müller, Albach and Zotz2018), points out that as the crop develops, there is greater self-shading and consequently a reduction in RGR. The NAR is a correlation between leaf area and dry matter production over time (Queiroz et al., Reference Queiroz, Silva, Zolnier, Silva, Lima and Alves2015), or even represents the carbon gain of a species through net photosynthesis (Huber et al., Reference Huber, Dettman, Williams and Hultine2018). The reduction in this index over the course of the crop’s development is linked to the emission of new cladodes, which have a lower photosynthetic capacity than more mature cladodes (Queiroz et al., Reference Queiroz, Silva, Zolnier, Silva, Lima and Alves2015). NAR can also be compromised, depending on the position in which the cladodes are inserted in the plant, as well as the opacity of the cladode surface, causing solar radiation to be blocked, negatively affecting the flow of photoassimilates in the forage cactus crop (Jardim et al., Reference Jardim, Silva, Souza, Araújo Júnior, Alves, Souza, Araújo and Moura2021b; Santos et al., Reference Santos, Oliveira, Morais, Jardim, Alves, Araújo Júnior, Souza, Silva, Souza, Souza, Campos, Simões, Queiroz, Montenegro and Silva2024; Silva et al., Reference Silva, Jesus, Reis, Klink, Araújo Júnior, Jardim, Alves, Morais, Souza, Santos, Silva, Araújo, Souza, Salvador, Silva, Santos, Santos, Camps, Silva, Nascimento, Nascimento and Souza2024).
The SCA presents a relationship between DM production and the CAI, showing the distribution of DM throughout the cycle (Queiroz et al., Reference Queiroz, Silva, Zolnier, Silva, Lima and Alves2015; Salvador et al., Reference Salvador, Jardim, Alves, Araújo Júnior, Silva, Souza, Queiroz, Campos, Gois, França, Nunes Filho, Steidle Neto, Souza and Silva2024). It can be seen that the cutting interval of 6 months leads to an increase in this index, as there is less development and lower CAI, with no greater photosynthesis and, consequently, a reduction in DM production. Looking at the cutting interval of 9, 12+6 and 18 months, there is a reduction in this index towards the end of the cycle, due to the increase in conductive tissues and the increase in DM production (Nunes et al., Reference Nunes, Salvador, Jardim, Araújo Júnior, Carvalho, Souza, Montenegro and Silva2020).
With regard to the phenophase results, it can be seen that the MIU clone had higher order cladodes (5th order) and a greater number of phenophases (4 phases) than the OEM and IPA clones. This fact is directly linked to the intrinsic characteristics of the crop, as the plant spends its energy on producing smaller cladodes, thus allowing for a greater number of cladodes and a greater number of orders (Silva et al., Reference Silva, Araújo Primo, Morais, Diniz, Souza and Silva2015b; Araújo Júnior et al., Reference Araújo Júnior, Silva, Souza, Araújo, Moura, Alves, Salvador, Souza, Montenegro and Silva2021a). The MIU clone had the shortest duration of phenophase 2 among the clones studied, but the OEM clone required a greater number of accumulated degree-days in this same phenophase.
The second phenophase is characterised by the emission of second-order cladodes, so a longer duration of this phase indicates a greater emission of second-order cladodes. Studies such as Amorim et al. (Reference Amorim, Silva, Pereira, Souza and Minuzzi2017) and Jardim et al. (Reference Jardim, Silva, Souza, Araújo Júnior, Alves, Souza, Araújo and Moura2021b) have shown that the highest productivity for this clone is related to second-order cladodes. It is worth noting that the duration of the phenophases is also related to the management carried out and interspecific competition for natural resources (Jardim et al., Reference Jardim, Souza, Alves, Araújo, Souza, Pinheiro, Araújo, Campos, Tabosa and Silva2021c).
The IPA and OEM clones had only one phenophase on average (phase 2), with the exception of the 18-month cutting interval, which had two phenophases (phases 2 and 3). However, this emission of third-order cladodes, only at the end of the cycle, becomes undesirable, as they are small cladodes that have a low photosynthetic area, which does not significantly influence biomass production, serving only as a drain on photoassimilates (Amorim et al., Reference Amorim, Silva, Pereira, Souza and Minuzzi2017). In the present study, the clones studied were cut earlier, but the MIU clone was more delayed at 18 months than the IPA and OEM clones, due to the fact that this clone emits more cladodes. Cutting earlier allows for better decision making, as well as favouring the availability of forage in advance, reducing the costs of cultivation and irrigation (Perondi et al., Reference Perondi, Fraisse, Staub, Cerbaro, Bareeto, Pequeno, Mulvaney, Troy and Pavan2019).
Biometric variables
Structural/morphological characteristics can vary according to clone, age, fertilisation levels and environmental factors (Sales et al., Reference Sales, Andrade, Leite, Silva, Viana and Santos2013; Silva et al., Reference Silva, Araújo Primo, Morais, Diniz, Souza and Silva2015b). A study by Silva et al. (Reference Silva, Araújo Primo, Morais, Diniz, Souza and Silva2015b) evaluating the morphological characteristics of the three clones studied, under rainfed conditions, obtained similar responses to the present study. The IPA clone has a more upright canopy compared to the MIU clone. The higher cladode production of the MIU clone is due to its own genetics, although the IPA clone, which belongs to the same genus, has fewer cladodes, as this clone invests in the production of cladodes with a larger cladode area (Araújo Júnior et al., Reference Araújo Júnior, Silva, Souza, Araújo, Moura, Alves, Salvador, Souza, Montenegro and Silva2021a).
The greatest growth and development of forage cactus occurred in the 18-month cutting interval, as this allows for greater and better use of natural resources (e.g., water, light and nutrients). Reis Filho et al. (Reference Reis Filho, Carneiro, Pereira, Furtado, Morais Neto, Magalhães, Alves and Lopes2022) observed this same behaviour for the O. stricta clone of forage cactus, at the same cutting intervals, and with regard to the TNC, the higher frequency led to the emergence of new shoots obtained from the plant.
Forage yield
This higher production (FM and DM) of the OEM clone with a cutting interval of 18 months is related to the genetic characteristics of the O. stricta clone, which presents superior morphological characteristics (i.e., larger cladode area, and consequently cladode area index), high water uses efficiency, high FM and DM production per plant and per area (Pereira et al., Reference Pereira, Silva, Zolnier, Morais and Santos2015; Nunes et al., Reference Nunes, Salvador, Jardim, Araújo Júnior, Carvalho, Souza, Montenegro and Silva2020; Alves et al., Reference Alves, Jardim, Araújo Júnior, Souza, Araújo, Souza, Salvador, Leite, Pinheiro and Silva2022). Silva et al. (Reference Silva, Araújo Primo, Morais, Diniz, Souza and Silva2015b) also states that the higher production is related to the CAI which is higher for this clone compared to the IPA and MIU clones.
This response may be related to the greater accumulation of biomass promoted by higher cutting interval, allowing better morphophysiological development of cladodes and greater water and nutrient storage capacity by plants. Rocha et al. (Reference Rocha, Voltolini and Gava2017) also observed an increase in productivity with the increase in cutting interval to 16 months in OEM, MIU and IPA clones, which reinforces the hypothesis that longer periods without cutting favour the expression of the productive potential of forage cactus, especially in semiarid environments.
It is worth noting that although in this study the plants had the same planting density (50,000 plants/ha), at the end of the cycle there was high mortality in the IPA and MIU clones (74% and 73%, respectively), which also influenced the low yield of these clones. Clones belonging to the species N. cochenillifera (MIU and IPA) present greater difficulty in establishing the state compared to the species O. stricta, especially in semiarid climate conditions (Silva et al., 2015). Furthermore, the study also showed that there was negative soil water storage throughout the 18 months of evaluation, which may have contributed to the lower survival rate of these clones during the establishment period.
Furthermore, the study also showed that there was negative soil water storage throughout the 18 months of evaluation, which may have contributed to the lower survival rate of these clones during the establishment period in relation to the sum of yields over the forage cactus crop cycle, the highest yield was for the OEM clone, but at all cutting intervals (6, 9, 12+6 and 18 months). As a result, cutting every 6 months is viable for the OEM clone, as it allows for a greater supply of forage over time (i.e., every 6 months), it represents an increase of 27.6%, 25% and 1.8% in relation to the cutting interval of 18, 12+6 and 9 months, respectively. In this way, the producer will be able to reduce the costs of applying inputs and managing irrigation (Moraes et al., Reference Moraes, Guim, Tabosa, Chagas, Almeida and Ferreira2019).
Components soil water balance
Soil water balance components indicated that the highest precipitation volumes occurred during the last growing season in all studied intervals. This increase in precipitation directly contributes to the increase in actual evapotranspiration (ETa), resulting from both greater water availability in the soil and increased atmospheric demand (Silva et al., Reference Silva, Jesus, Reis, Klink, Araújo Júnior, Jardim, Alves, Morais, Souza, Santos, Silva, Araújo, Souza, Salvador, Silva, Santos, Santos, Camps, Silva, Nascimento, Nascimento and Souza2024). However, greater losses due to surface runoff were also observed. This response can be explained by the physical characteristics of the soil: its predominantly sandy texture, low water retention capacity and rapid saturation during heavy rainfall events (Salvador et al., Reference Salvador, Jardim, Alves, Araújo Júnior, Silva, Souza, Queiroz, Campos, Gois, França, Nunes Filho, Steidle Neto, Souza and Silva2024; Santos et al., Reference Santos, Oliveira, Morais, Jardim, Alves, Araújo Júnior, Souza, Silva, Souza, Souza, Campos, Simões, Queiroz, Montenegro and Silva2024; Shi et al., Reference Shi, Li, Li, Zong, Zhang, Gao, Hao, Wang and Lam2024). In addition, no mulch was used in the cultivation area, which may have contributed to direct soil exposure and intensified runoff. About the variation in soil water storage, low storage was observed in the first cuts of the 6- and 9-month intervals, while in the 12+6-month interval the highest storage occurred in the second cut. Storage was negative for 18 months. The understanding of water storage in the soil must be studied, since greater water availability in the soil favours greater availability of nutrients in solution for better photosynthetic activity, and consequently greater production (Machado et al., Reference Machado, Lima, Antonino, Alves, Souza, Ribeiro and Firmino2015).
Water use indicators and economic analysis
Based on the results obtained for forage productivity throughout the cycle (18 months), the greatest economic benefits were observed for the OEM clone. This superior performance is directly related to the greater forage productivity obtained (sum of the three cuts performed), resulting in a greater economic return per cultivated area. The OEM clone presented greater revenue due to the greater number of cladodes, in addition to a lower mortality rate (10%). In addition to providing greater profit, both with the sale of cladodes or for forage. Greater production also favoured more efficient water and economic indicators.
Crop water use efficiency (WUEc), calculated from the ratio of actual evapotranspiration (ETa) to total water (rainfall + irrigation depth), was higher in the OEM clone in the 6-month interval between harvests, in the IPA clone in the 12+6-month interval and in the MIU clone in the 18-month interval. This indicates that 91%, 92% and 92% of the available water was used by the cropping system. This means that an average of 8.4% represents system losses due to runoff, drainage and evaporation. According to Silva, an acceptable range for the WUEc index for the ratio of ETa to R+ID in a semiarid region is between 0.6 and 1.1, and the average for this study was 0.916.
The water indicators *WUEc, WPc, *WPc showed significantly higher values for the OEM clone, regardless of the cutting interval. This result demonstrates the high agronomic efficiency of this clone in converting available water resources into biomass (Silva et al., Reference Silva, Jesus, Reis, Klink, Araújo Júnior, Jardim, Alves, Morais, Souza, Santos, Silva, Araújo, Souza, Salvador, Silva, Santos, Santos, Camps, Silva, Nascimento, Nascimento and Souza2024). The WPi, GEWPi and EWPi indicators showed the highest values throughout the experiment. This result is related to the lower amount of water applied via irrigation (Santos et al., Reference Santos, Oliveira, Morais, Jardim, Alves, Araújo Júnior, Souza, Silva, Souza, Souza, Campos, Simões, Queiroz, Montenegro and Silva2024), since the rainfall volume was high in the experimental period (1457.9 mm).
Conclusion
This study demonstrated that the use of cutting intervals in different clones of forage cactus significantly influenced the morphophysiological, agronomic, soil water balance, water and economic indices of the crop under irrigated conditions in a semiarid environment. Among the clones evaluated, the forage cactus Mexican Elephant Ear (OEM) – Opuntia stricta, stood out, presenting higher productivity, higher AGR and RGR, better efficiency of water indicators (*WUEc, WPc, *WPc and WPi) and superior economic indicators (GEWPi and NEWPi), in addition to early cutting. While the clone Miuda (MIU) – N. cochenellifera, presented greater phenophases (phases II, III and IV). In addition, the average crop use efficiency (WUEc) of 0.916 m3/m3 reinforces the adequacy of the management adopted, considering the ideal limits for semiarid regions. The 18-month cutting frequency showed the highest average current evapotranspiration, being 1457.8 mm.
The results obtained highlight the importance of choosing the forage palm clone and the management adopted to maximise productivity and sustainability in the cultivation of forage palm. In addition to planning the rational use of water. However, it is still necessary to carry out more studies with different experimental arrangements analysing temporal and seasonal variation, with or without the use of irrigation.
Water efficiency indicators in three forage cactus clones (‘Orelha de Elefante Mexicana’, ‘Miúda’ and ‘IPA Sertânia’) subjected to different cutting intervals. The same lowercase letters in the clone and the same uppercase letters in the cutting intervals do not present a statistical difference according to the Scott-Knott test at 5% significance.

Mean of hydro-economics indicators in three forage cactus clones (‘Orelha de Elefante Mexicana’, ‘Miúda’ and ‘IPA Sertânia’) subjected to different cutting interval

*WUEc = water use efficiency (m3/m3 and kg/m3, respectively); WPc and *WPc = crop water productivity (kg/m3); WPi = water productivity via irrigation (kg/m3); GEWPi = gross economic productivity of water via irrigation (US$/m3); NEWPi = net economic productivity of water via irrigation (US$/m3); EWPc = economic productivity of crop water (US$/m3); EWPi = economic productivity of water via irrigation (US$/m3).
Acknowledgements
The authors would like to thank the Fundação de Amparo à Ciência e Tecnologia de Pernambuco – FACEPE (APQ-1159-1.07/14, APQ-0300-5.03/17, APQ-0639-5.01/21), the Conselho Nacional de Desenvolvimento Científico e Tecnológico – CNPq (421003/2018-9, 309421/2018-7, 402622/2021-9, 309558/2021-2), the Empresa Brasileira de Pesquisa Agropecuária – Embrapa Semiárido (10.18.03.039.00.02.00) and the Amparo Foundation to Pesquisa do Estado de São Paulo – FAPESP (2023/05323-4) for financial assistance, to FACEPE itself for granting the scholarship (BCT-0221-5.03/21) and to the Agrometeorology Group in the Semiarid (GAS), for all research development.
Author contributions
Conceptualisation, A. M. da R. F. Jardim, A. R. M. dos Santos, C. A. A. de Souza, G. I. N da Silva, M. J. da Silva, T. G. F. da Silva; methodology, G. do N. Araújo Júnior, G. I. N. da Silva, J. E. F. de Morais, J. R. I. Silva; resources, funding acquisition, project administration and supervision, A. A. de A. Montenegro, T. G. F. da Silva; investigation and data curation, G. I. N. da Silva, T. G. F. da Silva; writing–original draft preparation, G. I. N. da Silva, J. Steidle Neto, L. S. B. de Souza, A. V. M. Silveira, T. G. F. da Silva; writing – review and editing, A. M. da R. F. Jardim, G. I. N. da Silva, J. Steidle Neto, L. S. B. de Souza, A. V. M. Silveira, T. G. F. da Silva
Funding statement
Fundação de Amparo à Ciência e Tecnologia de Pernambuco – FACEPE (APQ-1159-1.07/14, APQ-0300-5.03/17, APQ-0639-5.01/21, BCT-0221-5.03/21), the Conselho Nacional de Desenvolvimento Científico e Tecnológico - CNPq (421003/2018-9, 309421/2018-7, 402622/2021-9, 309558/2021-2), the Empresa Brasileira de Pesquisa Agropecuária – Embrapa Semiárido (10.18.03.039.00.02.00).
Competing interests
Not applicable.
Ethical standards
Not applicable.