Implications
Feed intake has a significant impact on the profitability and environmental footprint of livestock production. Feed intake is expensive and labour intensive to measure on individual animals, resulting in a limited number of phenotypic records. Genomic selection is suggested to be a promising selection tool to improve traits with only small numbers of available observations. In this study, an inexpensive way to increase the accuracy of genomic selection and remove the bias of (genomic) breeding values for feed intake using easily recordable predictor traits was demonstrated. This approach is successful when predictor traits are recorded on both evaluated and reference animals.
Introduction
Single-nucleotide polymorphisms (SNP) markers are used nowadays in genomic selection (Hayes et al., Reference Hayes, Bowman, Chamberlain and Goddard2009). Genomic selection increases genetic gain compared with traditional selection tools by decreasing the generation interval without (heavily) jeopardizing the accuracy of selection (Meuwissen et al., Reference Meuwissen, Hayes and Goddard2001, Muir, Reference Muir2007, Calus, Reference Calus2010). The accuracy of genomic selection depends on the accuracy of estimated direct genomic breeding values (DGV). The DGV accuracy is affected by the effective population size by the density at which the SNP chip covers the genome and by the size of the reference population (Daetwyler et al., Reference Daetwyler, Villanueva and Woolliams2008, Goddard, Reference Goddard2009, Pszczola et al., Reference Pszczola, Strabel, Mulder and Calus2012a). Generally, a large reference population is needed to achieve high accuracy of DGV (Hayes et al., Reference Hayes, Bowman, Chamberlain and Goddard2009). Large reference populations already exist for routinely recorded traits, for example, milk yield. However, for traits that are not routinely measured because they are difficult or expensive to measure, obtaining large numbers of phenotypic observations is problematic. Despite the availability of relatively low numbers of records, the application of genomic selection is suggested as a promising tool to start selection for difficult-to-measure traits (Calus et al., Reference Calus, de Haas, Pszczola and Veerkamp2013).
An example of a labour-intensive and expensive-to-measure trait is feed intake, for which usually only a limited number of phenotypic records are available. The heritability of feed intake ranges from 0.16 to 0.36, showing potential to change feed intake using genetic improvement (for review see Veerkamp, Reference Veerkamp1998). As traditional selection is likely too costly to apply for feed intake, and because genotyping costs are reducing continuously, genomic selection is the expected method of choice to start genetic selection for feed intake. The limited number of phenotypic records for feed intake will, however, result in a relatively low accuracy of genomic selection for feed intake. One solution to partly overcome this effect of the limited size of the reference population is to optimize its design (Jiménez-Montero et al., Reference Jiménez-Montero, González-Recio and Alenda2012, Pszczola et al., Reference Pszczola, Strabel, Mulder and Calus2012a). Another solution, commonly used in traditional breeding programmes, is to use predictor traits. For example, somatic cell counts are used to predict udder health traits (Philipsson et al., Reference Philipsson, Ral and Berglund1995), and birth weight can be used to predict calving ease or perinatal mortality (Johanson and Berger, Reference Johanson and Berger2003). A predictor trait has to meet several requirements. It has to be easily recordable, inexpensive to measure, heritable and, most importantly, genetically correlated with the trait of interest. Using such a predictor trait may result in an improvement of the trait of interest at a low cost. Also in genomic selection, an additional gain in accuracy can be achieved using predictor traits, as it was shown using both deterministic (Calus et al., Reference Calus, de Haas, Pszczola and Veerkamp2013) and empirical simulations (Calus and Veerkamp, Reference Calus and Veerkamp2011; Jia and Jannink, Reference Jia and Jannink2012). Both empirical studies had predictor traits measured on both the reference animals and evaluated animals. An important and unanswered question when using predictor traits in genomic selection is on which animals (reference or evaluated) the predictor traits should be recorded. Therefore, the objective of this study was to investigate the impact of using additionally recorded phenotypic observations for the predictor traits on (1) the reference, or (2) on the reference and evaluated animals, on the accuracy of breeding values for a scarcely recorded trait, using multi-trait genomic prediction models.
Material and methods
The data used in this study originated from Teagasc, Moorepark, Ireland, the Langhill herd from the Scottish Agricultural College, United Kingdom, and from the ‘t Gen herd from Wageningen UR Livestock Research, the Netherlands. Details on the experimental treatments for different countries are described elsewhere, for Scotland (Veerkamp et al., Reference Veerkamp, Emmans, Cromie and Simm1995, Pryce et al., Reference Pryce, Nielsen, Veerkamp and Simm1999, Coffey et al., Reference Coffey, Simm, Oldham, Hill and Brotherstone2004, Bell et al., Reference Bell, Wall, Russell, Simm and Stott2011), Ireland (Horan et al., Reference Horan, Dillon, Berry, O'Connor and Rath2005) and the Netherlands (Veerkamp et al., Reference Veerkamp, Oldenbroek, Van Der Gaast and Werf2000), and a more detailed description of the merging of the data sources and estimated variance components across the different herds can be found in a study by Banos et al. (Reference Banos, Coffey, Veerkamp, Berry and Wall2012).
Phenotypic data
The pre-corrected phenotypes used here were obtained from Veerkamp et al. (Reference Veerkamp, Coffey, Berry, de Haas, Strandberg, Bovenhuis, Calus and Wall2012) who described in detail the steps taken to adjust the original phenotypes. In short, phenotypic measurements were corrected for the mean lactation curve, herd, nutritional treatment, milking frequency, year and month of milk test by management group, and experimental treatments using random regression. Records available for the average fat–protein-corrected milk (FPCM), live weight (LW) and dry matter intake (DMI) of the predicted values for weeks 3 to 15 were used. The available data set comprised 1520 animals’ phenotypic observations for FPCM; of these animals, 1309 had phenotypes for LW and 869 had phenotypes for DMI. Feed intake was not recorded on animals from Teagasc, Moorepark, Ireland. In total, 824 animals had pre-corrected phenotypic observations for all three traits. For descriptive statistics of the traits, see Table 1.
Descriptive statistics of the analysed traits

FPCM = fat–protein-corrected milk; LW = live weight; DMI = dry matter intake.
aReference population size averaged over all cross-validation sets.
Genomic data
In this study, the genotypes of 2162 animals genotyped with the Illumina BovineSNP50 BeadChip (Illumina Inc., San Diego, CA, USA) containing 54 001 SNPs were available. This included all phenotyped animals and some additional ones with no phenotypes. The additional animals were used to perform checks for Mendelian inconsistencies between pedigree and SNP data, which were performed for all genotyped parent–offspring pairs and among sibs (Calus et al., Reference Calus, Mulder and Bastiaansen2011). Animals with conflicting information were removed. The SNP quality control criteria were as described by Veerkamp et al. (Reference Veerkamp, Coffey, Berry, de Haas, Strandberg, Bovenhuis, Calus and Wall2012), that is, GenCall (GC) score >0.20 and GenTrain (GT) score >0.55 for individual genotypes; call rate >95%; minor allele frequency >0.01 in each country; and no extreme deviation from Hardy–Weinberg Equilibrium (i.e. χ 2 < 600). After applying the quality control of the genotypes, 36 346 SNP remained in the data set.
Models
Animal models with one, two or three traits included were fitted using ASReml 3.0 (Gilmour et al., Reference Gilmour, Gogel, Cullis and Thompson2009) depending on how many traits were available in each scenario. The general (multi-trait) model was
 $${{y}_{ij}}\,{\rm{ = }}\,{{\mu }_j}\,{\rm{ + }}\,anima{{l}_{ij}}\, + \,{{e}_{ij}}{\rm{,}}$$
where yij is the pre-corrected phenotypic record of animal i, μj is the overall mean for trait j, animalij is the random polygenic effect of animal i for trait j and eij is a random residual for animal i and trait j. Variance components were estimated for each analysis. In pedigree analyses (P-REML), polygenic values were assumed to be normally distributed N(0, A⊗GA), where A is the numerator relationship matrix, GA is the m × m polygenic covariance matrix and m is the number of traits in the model. In genomic-based analyses (G-REML), genomic values were assumed to be normally distributed N(0, G⊗GG), where G is the genomic relationship matrix and GG is the m × m genomic covariance matrix. The G matrix was created with the first formula described by VanRaden (Reference VanRaden2008) using current allele frequencies. The inbreeding level in G was scaled to the inbreeding level in A and then the adjusted G was corrected to account for the sampling error in genomic relationships as in the study by Veerkamp et al. (Reference Veerkamp, Mulder, Thompson and Calus2011).
Accuracy
The accuracy of the breeding values was calculated in two ways: using cross-validation (CV) and using prediction error variance (PEV) and, additionally, selection index theory calculations were carried out to assess the minimum and maximum expected accuracy for an animal that is unrelated to the reference population.
CV accuracy was calculated as the correlation between the estimated breeding values and the phenotypic values divided by the square root of the heritability. Accuracy was calculated for each evaluation set and then averaged over all evaluation sets. Heritabilities of the considered traits and genetic correlations between traits were estimated using pedigree and genomic relationships using a multi-trait analysis in ASReml (Gilmour et al., Reference Gilmour, Gogel, Cullis and Thompson2009) using all available data.
The PEV-based accuracies for each animal (i) were calculated using standard errors of prediction (SEP) obtained from the output of the models as
 $${{r}_i}\, = \,\sqrt {{\rm{1}}\,{\rm{ - }}\,\frac{{PE{{V}_i}}}{{\sigma _{{\rm{A}}}^{{\rm{2}}} }}}, \;{\rm{where}}\,PE{{V}_i}\, = \,SEP_{i}^{{\rm{2}}} .$$
Accuracies for the evaluated animals were calculated within the corresponding CV set and then averaged across CV sets within scenarios.
To assess the minimum and maximum expected accuracy for an animal that is unrelated to the reference population, selection index calculations were carried out for two scenarios. In the first scenario (OWN), the expected accuracy was calculated for an animal that had no relatives in the reference population and only had its own phenotypic observations available. In the second scenario (PRO), the expected accuracy was calculated for a progeny-tested bull that was assumed to be a selection candidate. This bull had very accurate breeding values for the predictor traits, instead of its own phenotypic observations. These accurate breeding values were based on 1000 offspring each with a single phenotype. In the two scenarios, three situations were distinguished, in which observations (being phenotypic records or daughter-based breeding values) were available for: (a) FPCM, (b) LW or (c) FPCM and LW. Phenotypic observations for DMI were not available.
Reference populations
Four reference populations were defined that differed by the number of traits for which phenotypic observations were available. The sizes of the different reference populations varied along with the number of phenotypic records available for the different traits (see Table 1). Records of DMI were assumed to be available for at least part of the animals in all the reference populations. Observations for the reference animals were available on: (1) DMI only; (2) DMI and FPCM; (3) DMI and LW; or (4) FPCM, LW and DMI.
Evaluated animals
Evaluated animals were created by defining several CV sets. Only animals from the United Kingdom and the Netherlands were included in CV sets, because only those animals had records for all traits. Animals from Ireland contributed only to the reference populations with records available for LW and FPCM. The CV sets were as in the study by De Haas et al. (Reference de Haas, Calus, Veerkamp, Wall, Coffey, Daetwyler, Hayes and Pryce2012) who split the animals across genetic lines and management groups. Four CV sets were formed from the UK animals. First, animals were split based on two genetic lines: a control and a selection line. Animals in the control line have been bred to bulls with about average genetic merit for fat and protein yield, whereas the animals in the selection line were bred since 1973 to bulls with the highest genetic merit for fat and protein yield available in the United Kingdom (Veerkamp et al., Reference Veerkamp, Simm and Oldham1994). Second, animals were divided on the basis of two feeding strategies: one group was fed with a high-concentrate diet and the second group with a low-concentrate diet. Animals from the Netherlands composed of three groups. At the ‘t Gen farm, two groups of animals were present: a high genetic line for milk yield, that participated in the CR-Delta (Arnhem, The Netherlands) breeding programme, and a control line. Owing to its size, the high genetic line was randomly split into two sets. Each of the CV sets was assumed to be a set of evaluated animals and was analysed four times, assuming a presence of phenotypic information for: (1) none of the considered indicator traits, (2) FPCM, (3) LW or (4) FPCM and LW.
Scenarios
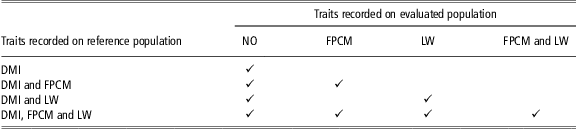
Of all the 16 possibilities (all combinations of four reference and four evaluated sets), nine of the most practical ones were chosen, as outlined in Table 2. All reference populations were used to predict all evaluation animals without using any of their records on the predictor traits to obtain baseline accuracy. The reference population for which information on all traits was available was used to evaluate all possible evaluated sets of animals (i.e. no observations, FPCM, LW and FPCM and LW). In addition, the reference population with DMI and FPCM records was used to evaluate the CV set with FPCM recorded, and the reference population with DMI and LW records was used to evaluate the CV set with LW records. All analyses were performed twice: first using pedigree relationships (P-REML) and then using genomic relationships (G-REML).
Included phenotypes (✓) in the different analyses, both for the evaluated and the reference population
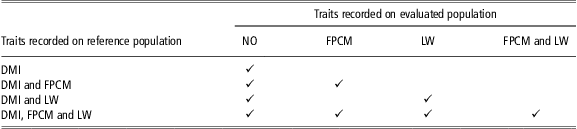
FPCM = fat–protein-corrected milk; LW = live weight; DMI = dry matter intake; NO = no traits recorded.
The remaining seven scenarios (i.e. out of all 16 possible combinations), where the predictor traits could be recorded only for the evaluated and not for the reference population, were only initially investigated here because of two reasons: first, having phenotypes only for the evaluated animals is rather unlikely in practice, and second, estimating variance components with only few animals in the evaluated sets proved to be difficult in the initial analyses and the obtained estimates were inaccurate.
Results
Heritability and correlation estimates
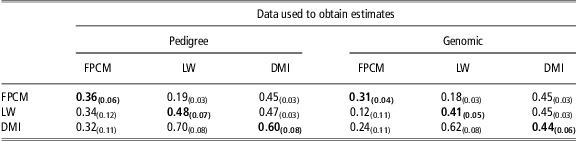
The estimated heritabilities for each trait and phenotypic and genetic correlations between the traits are shown in Table 3. Heritability estimates were moderate to high, ranging from 0.31 to 0.60, with the highest value observed for DMI. The strongest phenotypic and genetic correlations were between DMI and LW, whereas correlations between DMI and FPCM were somewhat weaker. In general, heritabilities and genetic correlations were somewhat lower when genomic information was used instead of pedigree information.
Heritability estimates (diagonal) phenotypic (above diagonal) and genetic correlations (below diagonal) for the analysed traits estimated using pedigree and genomic data, and their approximated standard errors in parentheses
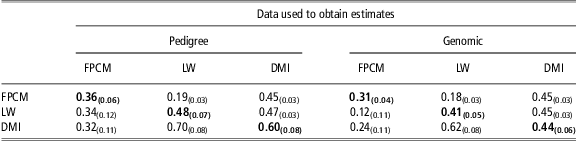
FPCM = fat–protein-corrected milk; LW = live weight; DMI = dry matter intake.
Accuracy
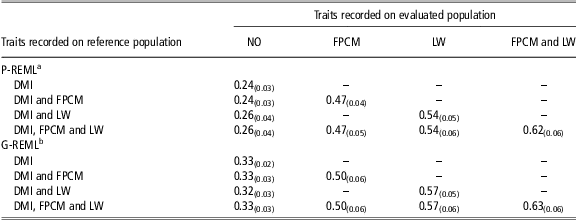
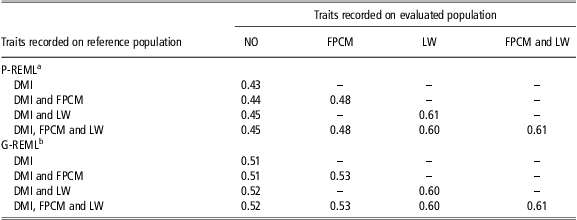
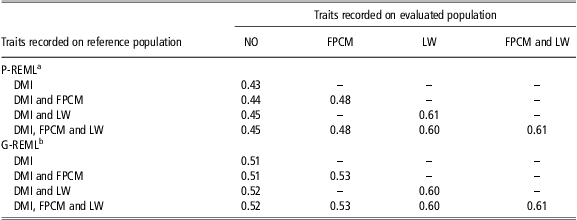
Genomic and pedigree-based accuracies, calculated using CV and PEV, are presented in Tables 4 and 5, respectively. When no additional traits were recorded for evaluated animals, accuracies for DMI, both CV- and PEV-based, were substantially higher for genomic analyses than for pedigree analyses (CV: maximum 0.26 for pedigree and 0.33 for the genomic analyses; PEV: maximum 0.45 and 0.52, respectively). When one or two traits were added, the differences between pedigree- and genomic-based accuracies diminished (Tables 4 and 5). With additional recording for FPCM, pedigree-based accuracies increased from 0.26 to 0.47 for CV and from 0.45 to 0.48 for PEV. Genomic-based accuracies increased from 0.33 to 0.50 for CV and from 0.52 to 0.53 for PEV. With additional recording for LW instead of FPCM, pedigree-based accuracies increased to 0.54 for CV and to 0.61 for PEV. Genomic-based accuracies increased to 0.57 for CV and to 0.60 for PEV. When both FPCM and LW were available for evaluated animals then the highest accuracy was obtained (0.62 for CV and 0.61 for PEV in pedigree analyses, and 0.63 for CV and 0.61 for PEV in genomic analyses). Recording predictor traits only for the reference population alone did not increase DMI breeding value accuracy. Recording predictor traits for both the reference population and evaluated animals significantly increased DMI breeding value accuracy and removed the bias observed when only reference animals had records.
Cross-validation-based accuracies (and their standard errors) for DMI of evaluated animals for which phenotypic observations were available on different number of traits across reference populations with phenotypes available for different traits
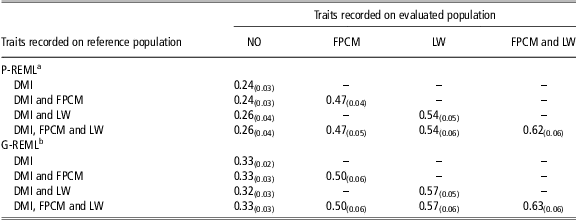
DMI = dry matter intake; FPCM = fat–protein-corrected milk; LW = live weight; NO = no traits recorded.
aPedigree-based analyses.
bGenomic-based analyses.
Prediction error variance-based accuracies for DMI of evaluated animals for which phenotypic observations were available on different (number of) traits across reference populations with phenotypes available for different traits
DMI = dry matter intake; FPCM = fat–protein-corrected milk; LW = live weight; NO = no traits recorded.
aPedigree-based analyses.
bGenomic-based analyses.
The selection index calculations showed that the predicted accuracy for the OWN scenario, when phenotypes were available for FPCM, was 0.19. When LW instead of FPCM records was available, the predicted accuracy increased to 0.49. When both predictor traits records were used, the predicted accuracy reached the highest value of 0.50. For the PRO scenario, when phenotypes were available for FPCM, the predicted accuracy was 0.32. When LW only and LW and FPCM phenotypes were available the predicted accuracy was 0.70.
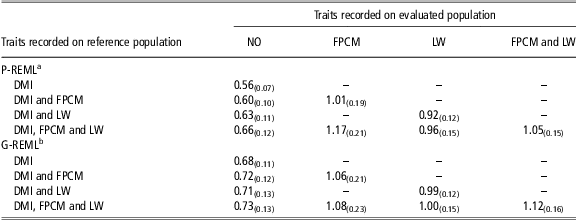
Bias
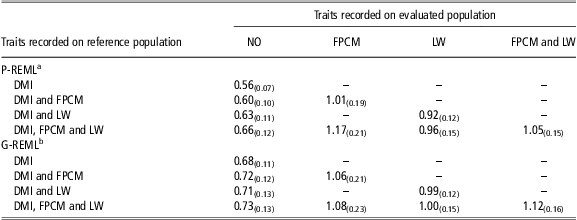
Slopes of regression of phenotypes on estimated breeding values are a measure of the bias in terms of the variance of estimated breeding values. Slopes greater (smaller) than one indicate underestimation (overestimation) of the variance of the estimated breeding values. The slopes ranged from 0.56 to 1.17 for pedigree and from 0.68 to 1.12 for genomic-based analyses, as shown in Table 6. When no observations on the evaluated animals were available and the reference animals had only DMI records, the variance of the estimates was most biased, the slope was 0.56 for pedigree analyses and 0.68 for genomic analyses. The bias was somewhat reduced when information for all traits (FPCM, LW and DMI) was added to the reference population, that is, the slopes increased to 0.66 for pedigree and 0.73 for genomic analyses. The variance of the estimated breeding values was rather unbiased when information on additional trait(s) was added both for the reference population and for the evaluated animals. This was observed, irrespective of whether FPCM, LW or both were added to the analyses; the slopes ranged from 0.99 to 1.12 for genomic and from 0.92 to 1.17 for pedigree analyses.
Slopes of regression of phenotype on estimated breeding values (and the standard error between cross-validation sets) for DMI of evaluated animals for which phenotypic observations were available on different traits across different reference populations
DMI = dry matter intake; FPCM = fat–protein-corrected milk; LW = live weight; NO = no traits recorded.
aPedigree-based analyses.
bGenomic-based analyses.
Re-ranking
Spearman rank correlations between the estimated breeding values were calculated to investigate whether changes in the ranking of animals occurred on the basis of their estimated breeding values across different scenarios. The correlations are shown in Supplementary Tables S1 and S2 for pedigree and genomic analyses, respectively. Little re-ranking of the animals on the basis of their breeding values was present across scenarios in which no phenotypic information was available for the evaluated animals (rank correlations ranged from 0.89 to 0.96 for pedigree and genomic analyses). Considerable re-ranking of animals was present comparing scenarios with and without information on the additional traits for evaluated animals, with rank correlations ranging from 0.58 to 0.99. The rank correlations showed that the re-ranking of the animals coincides with the accuracy of their breeding values, that is, when the accuracy of the breeding values estimated with one method differs from the accuracy of the other method, more changes in the ranking of the animals on the basis of their breeding values are expected to occur.
Discussion
In this study, we investigated the impact of recording additional phenotypic observations for the predictor traits for reference and evaluated animals on the accuracy of breeding values for a scarcely recorded trait. Our results show that the breeding value accuracy for a scarcely recorded trait was not increased when the predictor traits were recorded only for the reference population. When the predictor traits were recorded for both the evaluated animals and the reference population, however, the breeding value accuracy increased. The above results were obtained using DMI as the scarcely recorded trait, and FPCM and LW as predictor traits for DMI.
Accuracy
Differences were shown when the predicted (selection index-based) and empirical (REML-based) accuracies for DMI were compared. When only FPCM was the predictor trait, the empirical genomic-based accuracy was lower than the corresponding predicted accuracy of the OWN and PRO scenarios. When only LW was the predictor trait, or when two predictor traits (FPCM and LW) were used, the empirical genomic-based accuracies were higher than these in OWN but lower than in PRO scenarios. The presented results show that the empirical accuracies may differ from the expectations on the basis of selection index theory. The difference between predicted and empirical accuracies may arise, for example, owing to the pedigree structure of the data used. In the theoretical calculations (OWN and PRO), a reference population of unrelated individuals was assumed, whereas the animals in the data set might actually be strongly related to each other. As shown earlier, the more the animals in the reference population are related to each other, the lower the predicted accuracy is (Pszczola et al., Reference Pszczola, Strabel, Mulder and Calus2012a, Pszczola et al., Reference Pszczola, Strabel, van Arendonk and Calus2012b). When the own phenotypes for the predictor traits are available (OWN), or when the correlation between the traits is weak (i.e. PRO with only FPCM recorded), utilizing information collected from relatives may increase the accuracy. The predicted accuracy of scenarios OWN and PRO LW, where no information on relatives was utilized, was indeed inferior to the empirical accuracy. Conversely, when phenotypic information is very accurate (i.e. based on numerous progeny) and the correlation between the traits is sufficient, information from the relatives has a limited impact on the accuracy. Again, this was confirmed here, as the predicted accuracy obtained from almost all the PRO scenarios was superior over the empirical accuracy. Therefore, the results of OWN and PRO scenarios, obtained with selection index theory are in agreement with the results of the REML models.
The gain in breeding value accuracy for a scarcely recorded trait is expected to be higher when the correlation with the predictor trait is stronger. In our study, LW was more strongly correlated to DMI than FPCM was. Therefore, the gain in breeding value accuracy of the scarcely recorded DMI was expected to be considerably higher when using LW as a predictor trait than when using FPCM. Contrarily, differences in accuracies between these two scenarios, as shown in Tables 4 and 5, were small. We investigated whether this unexpected difference between scenarios with either FPCM or LW can be attributed to the 211 more phenotypes available for FPCM than for LW. Analyses with equal sizes of the reference populations for the predictor traits (after removing the 211 FPCM records of the animals with no LW records), however, showed similar results (not shown) to the analyses using all FPCM observations (Table 4), leaving this issue unresolved. Analysing all traits jointly yielded the highest breeding value accuracy, as expected. The superiority of multi-trait genomic analyses over single trait ones was also shown earlier in stochastic (Calus and Veerkamp, Reference Calus and Veerkamp2011, Jia and Jannink, Reference Jia and Jannink2012) and deterministic simulations (Calus et al., Reference Calus, de Haas, Pszczola and Veerkamp2013), as well as in real data analysis (Aguilar et al., Reference Aguilar, Misztal, Tsuruta, Wiggans and Lawlor2011, Tsuruta et al., Reference Tsuruta, Misztal, Aguilar and Lawlor2011).
The expected gain in accuracy because of the use of multi-trait selection, as compared with single-trait selection, strongly depends on the value of the variance components of the traits involved (Thompson and Meyer, Reference Thompson and Meyer1986). When the heritability of the different traits is similar and pairwise genetic and residual correlations are similar, the benefit of multi-trait applications is expected to be very limited. Large gains in accuracy are expected when pairwise genetic and residual correlations differ from each other substantially and when the predicted trait has a low heritability. Differences between the heritabilities of the analysed traits were small and diminished even more when the genomic data were used (see Table 3). Genetic correlations between DMI and LW were higher than between DMI and FPCM, but in both cases they were moderate. Therefore, for other traits than those analysed here, the benefit of using the predictor traits may be different. For example, differences in accuracy for various type traits, while using single- or multi-trait genomic analyses shown by Tsuruta et al. (Reference Tsuruta, Misztal, Aguilar and Lawlor2011), were up to 9%.
In our study, using two predictor traits resulted in similar accuracies for the pedigree-based and genomic-based breeding values (see Table 4). It should be, however, noted that this may be due to relatively low genomic-based accuracies, which was because of small number of the animals in the reference population. If the reference population would be bigger, it is likely that even with two predictor traits recorded on all the animals the genomic-based breeding value accuracy will be superior compared with the pedigree-based one.
Genomic analyses are expected to yield more accurate estimates than the pedigree ones, as shown in theoretical (Goddard, Reference Goddard2009, Meuwissen, Reference Meuwissen2009) and simulation studies (Meuwissen et al., Reference Meuwissen, Hayes and Goddard2001), as well as in most real data analyses (Lund et al., Reference Lund, de Roos, de Vries, Druet, Ducroq, Fritz, Guillaume, Guldbrandtsen, Liu, Reents, Schrooten, Seefried and Su2011; for reviews see: Hayes et al., Reference Hayes, Bowman, Chamberlain and Goddard2009, Calus, Reference Calus2010). The superiority of genomic analyses was also confirmed here for the single-trait model. The genomic-based accuracies for the single-trait model were likely superior because genomic relationships capture information on Mendelian sampling in evaluated animals and also because of increased connectedness between the reference and evaluated animals when G was used (Pszczola et al., Reference Pszczola, Strabel, van Arendonk and Calus2012b). Differences in accuracy were, however, moderate and nearly disappeared in multi-trait analyses. One possible explanation for the small differences between pedigree and genomic analyses might be the fact that the analysed populations had strong family links. For example, in A, 8351 relationships were >0.25 (excluding self-relationships), whereas in G this number was 18 573. Because A already contains numerous high relationships, apparently the added benefit of additional high relationships in G was limited, resulting in marginal differences between accuracies obtained from pedigree and genomic analyses. Nevertheless, in most practical cases, the family links between animals are expected to be weaker than in the data used here, and thus the differences between genomic and pedigree relationships are expected to be higher. In such cases, single- and multi-trait genomic analyses, which use more accurate relationships, are still expected to be superior over pedigree analyses. For example, Aguilar et al. (Reference Aguilar, Misztal, Tsuruta, Wiggans and Lawlor2011) showed an increase in accuracy of conception rate when enriching A with G and an additional substantial increase when multi-trait approach was used instead of the single-trait one. Tsuruta et al. (Reference Tsuruta, Misztal, Aguilar and Lawlor2011), who analysed linear type traits of US Holsteins, showed that, in terms of accuracy, the benefit of genomic analyses instead of pedigree was persistent across all analysed traits. Another explanation of small differences in accuracy between multi-trait pedigree and genomic scenarios is that recording own phenotypes for predictor traits on the evaluated animals gives information about the Mendelian sampling in the evaluated animals. Explaining Mendelian sampling, albeit through the genomic information, is also the most important reason why genomic selection is superior to selection using pedigree-based breeding values. This explains why, in our study there is a limited benefit to using genomic information, when predictor traits are already included in the model. Whether or not the use of genomic information, on top of using predictor traits, leads to an increase in the accuracy of breeding values depends predominantly on the genetic correlation between the predictor traits and the trait of interest (Calus and Veerkamp, Reference Calus and Veerkamp2011).
Bias
Scenarios in which no phenotypic observations were available for the evaluated animals showed bias (Table 6). This observed bias appears to be the result of an incorrect scale of the variance of the estimated breeding values. Inclusion of additional trait(s) recorded on the evaluated animals caused a substantial increase in variance of the estimated breeding values and an even higher increase in co-variance between estimated breeding values and phenotypes (results not shown). Together, the changed variance of the estimated breeding values and co-variance with the phenotypes appeared to remarkably reduce the bias. This bias reduction is most likely owing to the fact that the availability of the observation(s) for the additional trait(s) helped to account for the potential heterogeneity of the data, which may have resulted in multivariate distribution of the data. The analysed data set was heterogeneous in the sense that animals originated from different countries and management systems. These factors were accounted for during pre-correction of the phenotypes with a random regression model. Using random curves for each animal should, to some extent, adjust for differences in residual variances across groups. However, it is still possible that some of the data heterogeneity was not completely removed, for example, owing to different selection strategies in particular countries or herds. Thus, differences between groups may still have been present in the data set. To additionally account for differences within the groups, the phenotypes could be adjusted such that the mean (μ) is 0 and the standard deviation (σ) is 1 within each group. This possibility was investigated by De Haas et al. (Reference de Haas, Calus, Veerkamp, Wall, Coffey, Daetwyler, Hayes and Pryce2012). In their paper, despite the adjustment, accuracies between groups differed substantially, suggesting that such adjustment in fact may be too rigorous, and thus we did not use this additional adjustment here.
Data heterogeneity would not only affect bias in terms of the variance of the estimated breeding values but also the CV-based accuracy of the predicted breeding values. The CV accuracy is expected to be affected by the heterogeneity of the data because it relates estimated breeding values back to the phenotypes. In the case of heterogeneous data, the validation set may differ from the remaining animals and this may affect the bias and accuracy. To investigate whether, indeed in a case of no additional traits recorded for the evaluated animals, the data structure was not properly accounted, all the accuracies were calculated also using PEV. This method does not relate estimated breeding values back to the phenotype, but rather relies on the estimated residual variance, and thus the calculated PEV accuracies are expected to not be strongly affected by the heterogeneity of the phenotypes. Accuracies based on CV deviated from PEV accuracies when no additional observations are recorded for the evaluated animals. This suggests that, despite the pre-correction, the data (possibly) still contain heterogeneity in phenotypes. Using a multi-trait approach in general resulted in less biased estimates than in the case of the single-trait analyses, especially when additional information was available for the evaluated animals. The use of additional traits could help to reduce bias in two ways. First, by having the own phenotypes of the evaluated animals, information on their Mendelian sampling is available, as discussed previously. This helps to reduce the bias, because it enables the model to more accurately predict the ‘level’ of the breeding value of an evaluated animal, relative to the reference animals. Second, unaccounted differences between evaluated animals and the reference population can be accounted in the analysis by introducing information on the animals’ own phenotype(s) for the predictor trait(s) recorded on the evaluated animals. Thus, breeding values for the target trait are less regressed to the mean of the reference population. This regression, instead, is restricted to a certain range specified by the observed value of their own phenotype(s) for the predictor trait(s) and its correlation with the target trait. When the additional traits are recorded only for the reference population, no additional information on Mendelian sampling for the evaluated animals is provided and the regression of their breeding values for the target trait is not restricted by the own phenotype on the predictor trait(s). The additional information on Mendelian sampling for the evaluated animals and the restriction of the regression of their breeding values for the target trait resulted also in an increase of the breeding value accuracy when all the animals were phenotyped for the predictor traits. Therefore, using a multi-trait approach with additional information for all the animals allows the bias of the evaluation to be reduced by utilizing all available information.
An additional bias, which may be present in our multi-trait scenarios, can be caused by the fact that the own phenotypes for the predictor traits of evaluated animals are used in the evaluation. This bias may arise when residuals of the measured trait(s) are correlated with the evaluated animals’ estimates for the target trait. If such a kind of bias was present here, CV and PEV accuracies would differ for the multi-trait scenarios, as the CV method relates back to the phenotypes, whereas PEV does not. In our study, for the scenarios in which additional traits were recorded for the evaluated animals, the differences between CV and PEV accuracies were, however, small. Thus, it appears that this type of bias, if present, is limited in the analysed data set.
Genetic parameters
The estimated heritabilities and the genetic correlations were similar to the results of Veerkamp et al. (Reference Veerkamp, Mulder, Thompson and Calus2011) who used the Dutch part of the data for the analyses. The correlations between DMI, FPCM and LW obtained here, were similar to some and contradictory to other studies shown in a review of Veerkamp (Reference Veerkamp1998) who attributed the differences between the results to the small sample sizes and differences in traits definitions. The same argument applies to the current study in which the estimated genetic correlations were in general higher than in the literature. Another reason of differences between the values of the genetic correlations can be differences in milk production between the groups. Some of the animals included in the analyses were bred to average, whereas other to elite bulls. Although the differences between the groups were, to some extent, accounted while pre-correcting the data, still some differences may be unaccounted. These differences may have influenced the values of genetic parameters leading to differences observed between our results and reported in other studies.
A comparison between values of the genetic parameters estimated using pedigree and genomic analyses showed that the genomic-based values are lower (see Table 3). This agrees with the indications of Veerkamp et al. (Reference Veerkamp, Mulder, Thompson and Calus2011) who partly analysed the same data as in here. Veerkamp et al. (Reference Veerkamp, Mulder, Thompson and Calus2011) indicated that differences between genomic-based and pedigree-based estimated heritabilities not only may be the result of differences in properties of the Av. G matrix, but also because G-REML may be better able to disentangle genetic and environmental effects because of using more precise relationships between animals (Lee et al., Reference Lee, Goddard, Visscher and van der Werf2010). Another important question is whether pedigree-based or genomic-based genetic parameters are more precise. Veerkamp et al. (Reference Veerkamp, Mulder, Thompson and Calus2011) used two methodologies to estimate errors of the estimated genetic parameters. One method was approximating the error of the estimates using predicted error variances (as done also here) and the second method used a bootstrapping procedure. Whereas the first method, as in Table 3, showed that standard errors of pedigree-based and genomic-based are similar, the bootstrapping revealed lower standard errors for genomic-based estimates. Lower values of the genomic-based estimates of the genetic parameters, given the lower standard errors, should be closer to the true values. Such conclusion is especially valid when the data set used for estimating the genetic parameters is small and then genomic-based parameters should be used instead of the pedigree-based ones.
Optimal selection strategy for scarcely recorded traits
This study showed how DMI breeding value accuracy can be increased using predictor traits. To further increase the accuracy, several strategies can be considered. One solution could be to use more predictor traits. As shown here, three-trait analyses were more accurate than the two-trait ones, and therefore adding even more traits, which have the characteristics of a predictor trait, could further increase the accuracy. An additional strategy, when phenotyping is very difficult, is to extend the reference population by an international collaboration (de Haas et al., Reference de Haas, Calus, Veerkamp, Wall, Coffey, Daetwyler, Hayes and Pryce2012). A similar approach is to add a larger bull reference population with more accurate phenotypes or breeding values for the predictor traits, which appears to be a successful strategy (Calus et al., Reference Calus, de Haas, Pszczola and Veerkamp2013). Yet another approach could be to increase the reference populations for the predictor traits, while leaving the reference population for DMI unchanged. This approach, although not investigated here, is expected to be successful when the size of the reference population for the predictor traits is much larger than for the predicted trait(s) and when the genetic correlations between the predictor traits and the trait of interest are well known. In our study, the most easily accessible predictor trait was FPCM; however, it may be insufficient to use only this trait because of its relatively weak genetic correlation with DMI. Moreover, strong selection on milk production is present for many years in dairy cattle, and thus DMI is already being changed indirectly together with milk production. Therefore, the additional benefit of using FPCM as a predictor trait may be limited. Increasing the reference population for LW, however, should be more beneficial as its genetic correlation with DMI is higher. In situations with higher correlations, as shown by Calus and Veerkamp (Reference Calus and Veerkamp2011), the increase in the accuracy would be considerably higher than with weakly correlated predictor traits such as FPCM.
Combining the aforementioned approaches (i.e. using more predictor traits measured on an additional reference population of bulls with accurate phenotypic records on daughters, international collaboration to increase the reference population for the trait of interest and using multi-trait analyses) seems to be the most promising solution and could potentially yield a substantial increase in the breeding value accuracy compared with the levels obtained in this study.
Conclusion
This study showed that multi-trait genomic selection is more accurate than single-trait applications when phenotypic observations for the predictor trait(s) are recorded for both the reference population and the evaluated animals. Recording predictor traits for the reference population only did not result in an increase in accuracy for the predicted trait. LW was indicated to be a better predictor trait for DMI than FPCM. The initial benefit of using genomic instead of pedigree relationships obtained in single-trait analyses was reduced when increasingly more information from predictor traits was used in multi-trait analyses. This is because both the analyses using predictor traits and the analyses using genomic information attempted to increase the accuracy by explaining Mendelian sampling terms. The highest accuracy was achieved for multi-trait analyses with information on both predictor traits. When including the predictor trait(s) recorded for the reference and evaluated animals, the estimates were unbiased, most likely because this information helped to account for heterogeneity of the data. Therefore, using predictor traits in multi-trait genomic approach may be an inexpensive way to significantly increase the accuracy and to obtain unbiased breeding values for evaluation of scarcely recorded traits, which are expensive or difficult to measure, such as feed intake.
Acknowledgements
Marcin Pszczola acknowledges the financial support of the Foundation for Polish Science (FNP START 2013), of the Koepon Stichting (Leusden, The Netherlands) and of GreenHouseMilk. The GreenHouseMilk project is financially supported by the European Commission under the Seventh Research Framework Programme, Grant Agreement KBBE-238562. The RobustMilk project is gratefully acknowledged for providing the data, in particular, Donagh Berry (Teagasc Moorepark, Fermoy, Co. Cork, Ireland) and Mike Coffey (Scottish Rural College (SRUC), Edinburgh, UK, data collection funded by the Scottish Government). John Bastiaansen (Wageningen University, Wageningen, The Netherlands) is thanked for the initial editing of the genotype data. The RobustMilk project is financially supported by the European Commission under the Seventh Research Framework Programme, Grant Agreement KBBE-211708. This publication represents the views of the authors, not the European Commission, and the Commission is not liable for any use that may be made of the information.