State legislative elections in the United States have long exhibited relatively low contestation rates. Between 2002 and 2016, for example, the percentage of state legislative seats fully contested by the two major parties in even-year elections never reached more than 63.6% and was as low as 54.6%.Footnote 1 Indeed, some states always see fewer than one third of their legislative seats contested. It is not surprising that local media around the country routinely lament the low level of competition in statehouse races.Footnote 2
In contrast to this lackluster record, the percentage of contested seats in the 2018 elections increased to 65.7%, making 2018 the year with the highest state legislative contestation levels of any midterm or presidential election year in the twenty-first century.
…the percentage of contested seats in the 2018 elections increased to 65.7%, making 2018 the year with the highest state legislative contestation levels of any midterm or presidential election year in the twenty-first century.
This uptick was not evenly distributed across the states, however. In some states (usually in the South), two-party competition in state legislative contests broke all-time records, whereas in others it did not increase at all (and sometimes even fell). Furthermore, increased state legislative contestation in 2018 was caused overwhelmingly by a surge in the number of Democratic—and not Republican—state legislative candidates.
This article examines contestation patterns in state legislative elections over time, focusing on changes that took place in the 2018 midterm elections. It shows that the 2018 midterms represented a departure from recent trends. The results of a time-series analysis of contestation rates between 1968 and 2018 demonstrate that in many states, Democratic contestation of legislative races in 2018 was considerably larger than would be expected based on political and institutional predictors. The demographic and political factors influencing which districts were most likely to be newly contested by Democrats in 2018 also are presented.
TRENDS IN CONTESTATION OF STATE LEGISLATIVE ELECTIONS, 2002–2018
Figure 1 plots the average percentage of contested lower-chamber legislative seats across Southern and non-Southern states in even-year elections since 2000.Footnote 3 As shown, in 2000, the average contestation rate in non-Southern states was more than 20 percentage points higher than the corresponding rate in Southern states, a gap that reflected the long-standing absence of two-party politics in the South (Klarner Reference Klarner2015; Myers Reference Myers2016). During the 2000s, average contestation rates in the non-South increased slightly while corresponding rates in the South decreased slightly. Then, between 2010 and 2016, contestation rates in the non-South decreased slightly while contestation rates in the South seesawed upward. In 2018, contestation rates for both regions increased; however, the increase in the South was dramatically larger. In the non-South, the average lower-chamber contestation rate in 2018 was 64%, a 3.9% increase from 2016 and a 2.2% increase from 2014. In the South, on the other hand, the average lower-chamber contestation rate in 2018 was 61.6%, an 18.9% increase from 2016 and an 11.5% increase from 2014. The large increase in the South suggests that after decades (indeed, centuries) in which these states have lagged their non-Southern counterparts in the degree of two-party competition in their legislative races, the Southern states may be on the verge of catching up.
Average Percentage of Contested Lower-Chamber State Legislative Seats, 2000–2018

Figure 2 plots averages of the percentage of races featuring Democratic and Republican candidates in Southern and non-Southern states during the same period. In non-Southern states, the respective statistics for both Democrats and Republicans generally remained around 80% throughout much of the 2000s and 2010s. However, in 2018, the combination of an increase in Democratic candidates and a decrease in Republican candidates created an unprecedented 12% gap between the parties. In the Southern states, 2018 witnessed an even more dramatic shift: after four election cycles in which the average percentage of Democratic candidates lagged significantly behind the average percentage of GOP candidates, the Democratic percentage increased by 16%, resulting in near parity between the parties in terms of fielding candidates.
Average Percentage of Lower-Chamber State Legislative Seats Featuring Democratic Candidates and Republican Candidates, 2000–2018

Figure 3 plots the state-level percentages of lower-chamber seats featuring Democratic candidates in 2016 and 2018 (left graphic) and the corresponding percentages of seats featuring Republican candidates (right graphic). The datapoints in the Republican graphic are clustered around the dashed line, meaning that the percentages of Republican candidates in 2016 and 2018 were similar in most states. In the Democratic graphic, conversely, many data points are above the line, meaning that these states experienced a significant increase in Democratic candidates. Many were Southern states, including Arkansas, Georgia, Kentucky, South Carolina, Tennessee, Texas, and especially North Carolina.
Percentages of Democratic and Republican Candidates in Lower-Chamber Elections Across States, 2016 and 2018

PLACING THE 2018 MIDTERMS IN CONTEXT: A TIME-SERIES ANALYSIS OF CONTESTATION RATES
The significant increase in Democratic state legislative contestation in the 2018 elections (particularly in the Southern states) raises the question of whether 2018 can be explained by well-known political and institutional variables or whether it is a true anomaly. Although contributors to the contestation increase come to mind—including the fact that 2018 was a midterm year with a Republican president in office—it is unclear whether such variables are sufficient to account for the magnitude of the increase. To gain a better sense of the extent to which the contestation increases of 2018 can be explained systematically, I conducted a time-series analysis of state legislative contestation rates from 1968 to 2018. The unit of analysis was the chamber-year (i.e., a legislative chamber for a given election year) and separate regressions were estimated predicting the percentage of a chamber’s seats up for election that were contested by Democrats and the corresponding percentage for Republicans.Footnote 4
Institutional and political variables related to factors cited by extant literature as potentially affecting contestation rates were included in the model. Squire (Reference Squire2000) argues that variation in state legislative contestation is primarily driven by perceptions of the value of a state legislative seat: that is, where a legislative seat is perceived to be more valuable, it will attract more candidates. Thus, variables measuring state population per legislator (logged) and state legislative annual salary plus the salaried per-diem for the number of days in session (2010 dollars) were included.Footnote 5
Extant literature also suggests that state legislative contestation rates are heavily influenced by national political forces, with the overarching factor being which party is in control of the US presidency (Klarner Reference Klarner2010; Rogers Reference Rogers2015; Reference Rogers2016). When a political party is the national out-party (i.e., the other party controls the White House), it tends to field more state legislative candidates, whereas in-party state legislative contestation often plunges during midterm elections. Accordingly, I included separate dummy variables for presidential election years with a GOP incumbent, midterm election years with a GOP incumbent, and midterm election years with a Democratic incumbent, making presidential election years with a Democratic incumbent the reference category. State legislative contestation rates also likely are influenced by presidential voting patterns of state electorates: that is, higher percentages of support for Democratic presidential candidates likely will lead to increased Democratic contestation and decreased Republican contestation. Therefore, I added a variable indicating the state-level Democratic percentage of the two-party vote for president in the previous presidential election.
State legislative contestation rates also may be affected by various aspects of state politics. First, the degree of competition for control of a state legislative body may be relevant: that is, when control of a chamber is “up for grabs,” parties will contest more legislative seats (Rogers Reference Rogers2015; Squire Reference Squire2000; Van Dunk and Weber Reference Van Dunk and Weber1997). I operationalized chamber-level competition through the share of seats in a legislative chamber held by the minority party at the beginning of an election year.Footnote 6
Next, legislative contestation may be affected by the redistricting cycle. This could occur in two ways: (1) parties might contest more seats in the election prior to redistricting as part of a larger effort to gain control of legislative chambers before district lines are redrawn (Makse Reference Makse2014; Moncrief Reference Moncrief, Thompson and Moncrief1998); and (2) contestation rates may increase in the elections immediately following the redrawing of district lines, given that incumbents often will be less advantaged in newly created districts (Wrighton and Squire Reference Wrighton and Squire1997). I operationalized the pre-redistricting dynamic by measuring the percentage of a chamber’s seats up for election whose winners would be in office when district boundaries are expected to be redrawn (i.e., usually the year following the US Census). I operationalized the post-redistricting dynamic by measuring the percentage of a chamber’s seats up for election taking place in newly drawn districts.
Last, state legislative contestation may be lower in states that use multimember districting, particularly the “free-for-all” variation in which multiple members of the same political party might run against one another for a legislative seat (Van Dunk and Weber Reference Van Dunk and Weber1997). I accounted for the potential effects of multimember districting by including independent variables measuring the percentage of multimember free-for-all seats and the percentage of seats from multimember districts with posts.
These analyses also included state dummy variables, state-specific time trends, and dummy variables for each state in the 2018 elections to assess whether the change in a particular state in 2018 was a statistically significant departure from past trends and substantive predictors.
Table 1 presents estimates for the key political and institutional variables in the analysis (see the online appendix for estimates on the effects of the battery of time-trend and state variables described previously). The results of table 1 indicate that Democratic contestation rates appear to be especially affected by national political factors. Compared to a presidential election year with a Democratic incumbent, Democratic contestation increases by an average of more than 2% in presidential election years with a Republican incumbent; increases by an average of slightly less than 1% in midterm elections with a Republican incumbent; and decreases by an average of slightly more than 1% in midterm elections with a Democratic incumbent. Democratic contestation also is highly affected by the state-level presidential vote: for every 1% increase in the Democratic vote for president, Democratic contestation increases by 0.14%. Both Democratic and Republican contestation rates are highly influenced by constituency size; in chambers with larger constituencies, they increase considerably.
Time-Series Analysis of Chamber-Level State Legislative Contestation Rates in National Election Years, 1968–2018

Notes: *p<0.05; **p<0.01; ***p<0.001. Estimates of state dummy variables, state time trends, and state dummy variables for 2018 are in the online appendix.
Compared to Democratic contestation rates, Republican contestation rates appear to be influenced by a more diverse range of national- and state-level factors. Both variables that pertain to the redistricting cycle yielded statistically significant coefficients in the regression predicting Republican contestation rates. More important, the minority party’s seat share within a legislative chamber yielded a large and statistically significant effect on Republican contestation rates: a 1% increase in minority-party seat share leads to a 0.24% increase in GOP contestation. This suggests that Republican state and local parties have been more active than their Democratic counterparts in recruiting candidates for state legislative races in “up-for-grabs” chambers. Conversely, the effect of the state-level presidential-vote variable on Republican contestation rates is only half as large as its corresponding effect on Democratic contestation rates, suggesting that the characteristics of state electorates vis-à-vis national politics matter less for Republican contestation than Democratic contestation. Last, compared to a presidential election year with a Democratic incumbent, Republican contestation decreases by an average of slightly less than 2% during both presidential and midterm election years with a Republican incumbent. However, the difference in Republican contestation rates between presidential and midterm election years with a Democratic incumbent in office is statistically insignificant.
Although results for most of the time-trend and state predictors included in the regressions are not the focus of this study, estimates for the 2018 election dummy variables are noteworthy because they indicate which states featured contestation rates in 2018 that were significantly different from what would be expected.Footnote 7 A total of 19 states had statistically significant higher-than-expected increases in Democratic contestation in 2018, compared with only two states in regard to Republican contestation. No states had significantly higher-than-expected decreases in either Democratic or Republican contestation. The 19 states with significantly higher-than-expected Democratic contestation increases were Alaska, Arizona, Colorado, Connecticut, Delaware, Florida, Georgia, Indiana, Iowa, Kentucky, Missouri, North Carolina, Oklahoma, Pennsylvania, South Carolina, Tennessee, Texas, Washington, and Wisconsin. It is important that nine of these 19 states are Southern or border states. The two states with significantly higher-than-expected increases in Republican contestation were Arkansas and North Carolina—both Southern states.
DISTRICT-LEVEL DETERMINANTS OF THE 2018 CONTESTATION INCREASE
A second question raised by the substantial increase in the percentage of state legislative races featuring Democratic candidates in 2018 is: What explains why some seats previously uncontested by Democrats featured Democratic candidates in 2018 whereas others did not? The extant literature suggests various possibilities, some more obvious than others. Much of the literature suggests that Democratic state legislative candidates will be more likely to emerge in races for open seats (i.e., seats in which the Republican incumbent is not running for reelection) (Jewell and Breaux Reference Jewell and Breaux1988). Extant scholarship also suggests that Democratic candidates will be more likely to emerge in districts whose underlying partisan characteristics would make a Democratic victory more plausible (Hogan Reference Hogan2004; Myers Reference Myers2018). In the highly nationalized political environment of 2018, candidates and parties were likely to turn to the district-level 2016 presidential vote as the most appropriate measure of district partisanship. Additionally, anecdotal accounts of the 2018 campaign suggest that Democrats focused much of their attention on contests in upscale suburban areas with large numbers of well-educated professionals in their effort to regain legislative chambers at both the federal and state levels (Montgomery Reference Montgomery2018; Schneider Reference Schneider2018; Millman Reference Millman2017). Democrats may have recognized that these areas—rather than the rural, working-class white areas that had swung toward the Republicans in 2016—harbored much of the anti-Trump fervor that could be used effectively to sweep Democrats into office in lower-level races.
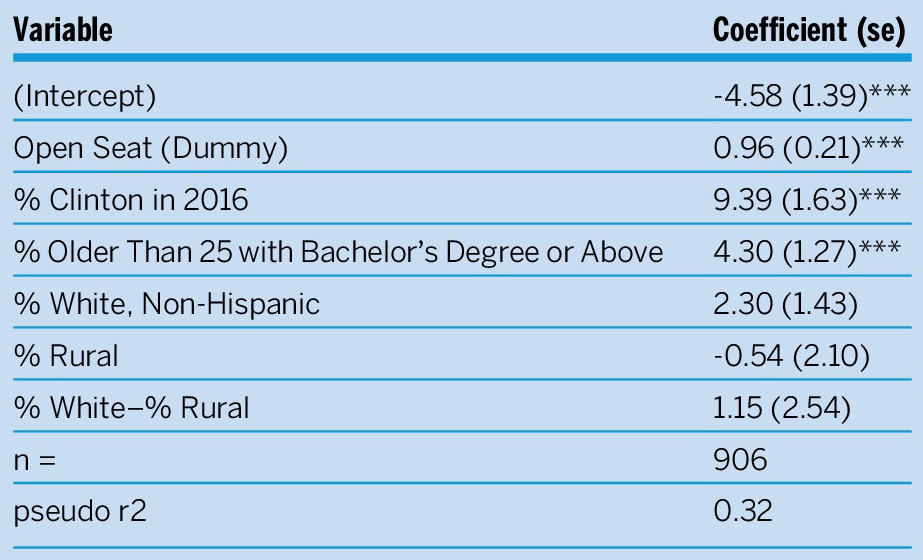
To examine the effects of these factors on district-level Democratic contestation in 2018, I estimated a multilevel logistic regression with state fixed effects predicting the likelihood that a Democrat contested a seat previously not featuring a Democratic candidate. All single-member legislative districts (i.e., both lower chamber and upper chamber) with seats up for election in 2018 that did not feature a Democratic candidate in the previous cycle were included in the analyses (i.e., 906 observations). Independent variables included a dummy variable coded “1” for open seats and “0” for seats with Republican incumbents running for reelection, as well as the district-level Democratic percentage of the two-party vote for president within the district in 2016. Additionally, four district-level demographic variables were included: the percentage of residents older than 25 with a bachelor’s degree or above; the percentage of non-Hispanic whites; the percentage of rural residents; and a term interacting the percentage of non-Hispanic whites with the percentage of rural residents.Footnote 8
Regression results are presented in table 2. Not surprisingly, open seats and seats with higher percentages of Hillary Clinton voters in 2016 were more likely to be newly contested by Democrats in 2018. More noteworthy is the effect of the college-education variable, which yielded a large and highly significant positive effect on the likelihood that a district was newly contested by Democrats. It appears that in their effort to win control of (or reduce GOP dominance in) state legislative chambers, Democrats focused much of their energy on well-educated districts—above and beyond what would be expected based on district partisanship as measured by the district-level 2016 presidential vote. The racial and rural residence variables (and their interaction term) did not yield statistically significant effects.
It appears that in their effort to win control of (or reduce GOP dominance in) state legislative chambers, Democrats focused much of their energy on well-educated districts—above and beyond what would be expected based on district partisanship as measured by the district-level 2016 presidential vote.
Multilevel Logistic Regression Predicting Seats That Were Newly Contested by Democrats in 2018

Notes: *p<0.05; **p<0.01; ***p<0.001. Regression estimated with state fixed effects.
CONCLUSION
The results of this article point to both continuity and change in contestation patterns in US state legislative elections. The unusually large numbers of Democratic state legislative candidates observed in states across the country in 2018 can be partially explained by well-known political and institutional variables operating at both the national and state levels. At the same time, many states experienced increases in Democratic candidates that were bigger than those variables would have predicted. These larger-than-expected increases were likely related to factors unique to 2018, potentially including the effort of grassroots political organizations (particularly women’s groups) created in the aftermath of the 2016 presidential election; the increased focus of Democratic party organizations on state legislative elections; and other factors. The districts most likely to be newly contested by Democrats in 2018 were those featuring open seats, those with higher percentages of voters previously supporting the Democratic presidential candidate, and those with higher percentages of well-educated residents. Whereas the significance of the first two factors is consistent with established patterns, the significance of the third factor represents an important change.
Whether the relatively high rates of state legislative contestation in 2018 will persist into the 2020s is unclear, but there is at least one way in which the 2018 midterms are likely to mark a turning point in terms of state legislative contestation. The dramatic increase in contested state legislative elections in the American South in 2018 strongly suggests that one of the final vestiges of Southern exceptionalism in American politics—that is, the region’s unusually low levels of state legislative competition—is on the verge of disappearing. As scholars have long pointed out, the gradual institutionalization of two-party politics in the South has made the region more like the rest of the United States (Shafer and Johnston Reference Shafer and Johnston2006). The arrival of widespread two-party competition in the South’s state legislative races appears to be the latest (and perhaps last) manifestation of this trend.
The dramatic increase in contested state legislative elections in the American South in 2018 strongly suggests that one of the final vestiges of Southern exceptionalism in American politics—that is, the region’s unusually low levels of state legislative competition—is on the verge of disappearing.
Supplementary Materials
To view supplementary material for this article, please visit http://dx.doi.org/10.1017/S1049096520000232.