


During the 1958–59 traverse into the Victoria Land plateau from the Ross Ice Shelf, the party passed through the Skelton Inlet and Glacier, where several geophysical stations were established en routesReference Crary 1 , Reference Wilson and Crary 2 Along the central part of the floating ice of the inlet, an extensive “blue” ice area with high surface densities was encountered. The approximate extent of this area is shown in Figure 1 which shows also the main sources of ice flowing into the inlet and some of the flow patterns as observed on aerial photographs. Though the traverse schedule did not permit detailed examination of this “blue” ice area, sufficient data are available to permit a postulation on its mode of formation.
Sketch of lower Skelton Glacier area showing ice features, including approximate location of the “blue” ice

“Blue” ice has been encountered in nearly all areas of mountain glacierization, both in Antarctica and in the northern hemisphere, though generally little attempt has been made to explain its presence other than through meteorological parameters. SwithinbankReference Swithinbank 3 has described briefly a “blue” ice area in the mountains of western Dron“ning Maud Land which is attributed to meteorological factors, and SchyttReference Schytt 4 has expanded on this. Wade,Reference Wade 5 in the Edsel Ford Mountains, describes a small “blue” ice area as perhaps originating from percolated melt water. There are undoubtedly several factors which may cause abnormal densification of ice, particularly ice found near exposed rock outcrops where little or no accumulation occurs, and where the ice movement is small. However, it is believed that the “blue” ice encountered in the central part of the Skelton area is caused by the combination of horizontal compressive forces and the absence of accumulation due to strong katabatic winds.
At the main traverse stations, density values were generally obtained to 1 0 m. from the snow pits and ice cores taken from the hand-drilled holes used for temperatkire measurement and seismic shots. At Sites 63 and 64, in the hard ice area, these values are very limited because of the difficult drilling. Some holes were drilled to a meter or more between Sites 64 and 65 to obtain information on the transition zone to the “blue” ice. All available density variations with depth in this area are shown in Figures 2a and 2b. Figure 2a is also drawn as a section, and lines of equal density have been roughly sketched in from the available information. These show a progressive increase at all depths approaching the hard ice area from Site 66 with the maximum density observed at Site 63;.85 to 0.89 g./cm3. Sites 61 and 62 were on the west side of the glacier and are not included in this section.
Composite section of Skelton Glacier, showing densi y changes in surface layers, and seismic results of ice thickness and water depths

Density values obtained approaching the “blue” ice zone

At a point about a kilometer south of Site 66, a strain line 1,550 m. long and parallel to the glacier movement showed a shortening of 32 cm. in an elapsed time of about two months.Reference Wilson and Crary 2 This is equivalent to a decrease in the absolute velocity to the south which for continuity would require ice thickening in this direction. In Figure 2a there is shown also a section of this part of the glacier as obtained from the seismic results. There is considerable ice thickening noted from Sites 66 to 65, then thinning to 64. It can be inferred from this section and from the map of Figure 1 that the ice moving south from Site 66 encounters great pressure from the ice flowing in from the main névé fields across the glacier. This pressure slows down the ice from Site 66, causing the compressive strain and consequent thickening. It is this compression that is believed also to cause the densification of the surface snows, and with the winds that reduce accumulation to a minimum, the “blue” ice results. Such densification of the surface snows should be directly related to the negative velocity gradient, providing the other factors such as splaying of flow lines, unsteady state conditions, etc., are negligible. To be more specific, the principal horizontal strain-rates and their variation over the glacier would be required.
There appears to be an anomalous condition between Sites 65 and 64 where the ice thins rapidly. In Figure 2a this thinning has been shown as taking place near Site 65, although densification appears to continue nearly to Site 64. Without additional information on strain-rates and ice thickness values, it is impossible to reconcile these factors. Near Site 64 and extending south several kilometers the ice is pushed into surface ridge and trough systems running north and south which have wave lengths of about 250 m. and amplitudes from ridge to trough up to 15 m. Considerable crevassing also occurs in a direction normal to the ridge systems. It is assumed that, while the vertical strain-rate has become negative somewhere between Sites 65 and 64, the principal horizontal strain-rate in the east and west direction is also negative, and is responsible for the continued densification of the surface ice. From the seismic soundings at Sites 64 and 65, it appears that the ice is grounded, but in both cases the ice thickness and elevation figures correspond closely to the ratios required for floating equilibrium. Perhaps, in view of the lack of major surface expressions at Site 64, the material under 64 and also 65 is glacial debris which forms no barrier to the forward movement, and the controlling factor in the thinning in this area is the large positive principal horizontal strain-rate in the north and south directions. There may also be convergence of flow lines in this area which would further complicate the ice behavior.
Following the release of the borizonal pressures, there would be some relaxation of the high density ice, but this would be very small.Reference Langway 6 As the “blue” ice area moves out of the compressive region and enters an accumulation zone, it would become buried, and there should be a definite unconformity with the overlying snows. Such an unconformity was located at the station east of Site 62 where a two-meter hole was drilled for a seismic shot. As seen in Figure 2a, the ice in the first meter had a density of 0.4 to 0.5 g./cm.3, while the four values for the second meter were all above 0.8 g./cm.3. This high density ice was not encountered in the four-meter holes drilled across the mouth of the glacier near Site 61, and presumably it was below this level.
Although the traverse party was not in the Skelton area in midsummer, there was no evidence of melting in late January on the return trip, except perhaps in the very near vicinity of some exposed rocks. On the”blue” ice the only evidence of the effect of summer temperatures and radiation is the cup-shaped rippled appearance of the ice surface. Though there would be compaction of the snow if no accumulation were to take place, it is difficult to see how this could reach values of 0.89 g./cm. density without melting or pressures as described above. Also, as seen in Figure 1, the ice area lies on the eastern side of the glacier because of the greater volume of ice coming from the western ice falls. If the “blue” ice were the result of meteorological factors, the anomalous area would be symmetrical with the inlet which runs nearly due north and south.
The effects of horizontal pressure on the snow densification in zones of accumulation have been noted in areas of the Ross Ice Shelf. During the Little America Traverse in 1957–58,Reference Crary 1 Sites 27 and 40 were in crevassed areas. In Figure 3 are shown density values obtained at these sites compared in each case with the density from the adjacent site. Values of density to 3 meters were taken from pit studies by Boyd,Reference Boyd 7 while values from 3 to 10 meters are unpublished data taken from the cores of hand-drilled holes. It is seen that the density at depth is higher in the crevassed areas while near the surface the density values are much the same. This should be expected in an accumulation area, since the deeper layers have been subjected to the compressive forces for a steadily increasing length of time. Site 40 was at Camp Michigan where Zumberge and othersReference Zumberge, Zumberge, Giovinetto, Kehle and Reid 8 have made detailed studies of the ice deformation. They also find increases in density related locally to forces that are responsible for the anticlinal ice structures. In areas of crevassing caused by shearing or compressive forces some abnormal densification should be expected.
Other evidence was obtained on the Victoria Land Traverse of 1958–59 south of Mt. Discovery, where there was no evidence of crevassing. At Site 57 (lat. 79° 03′ S., long. 169° 11′ E.) and at Site 59 (lat. 79° 05′ S., long. 165° 38′ E.), north-south and east-west strain lines of about 1.5 km. length were chained in October 1958, January 1959 and in October 1959, the latter by the Victoria Land Traverse party of 1959–60. Results were as follows:

Density variations with depth in selected Ross Ice Shelf areas
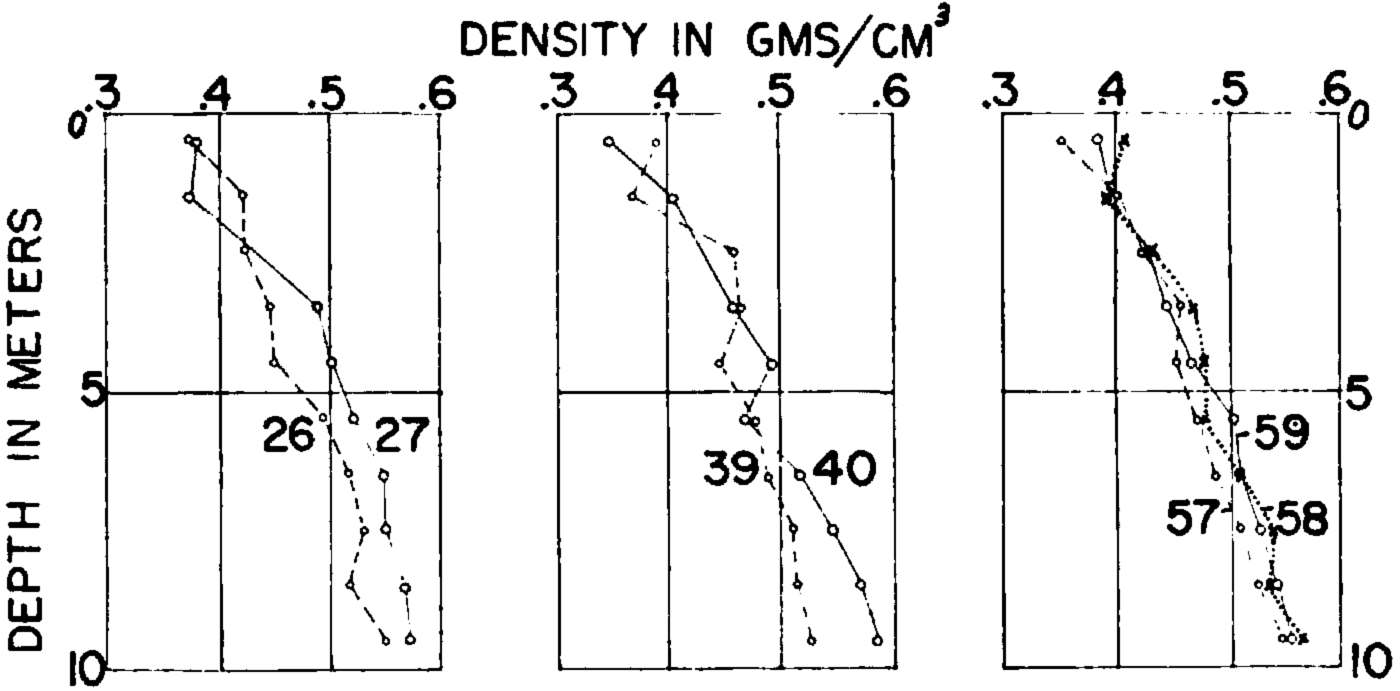
The additional thickness at Site 59 is assumed to be the result of this positive vertical strain, although there is insufficient data to determine the velocity gradient vectors. Sites 58 and 59 are south of the Mt. Discovery-Minna Bluff peninsula while Site 57 is east of this obstruction to normal northerly flow. The density values for these three stations are shown in Figure 3. Though the increase at Site 59 where negative horizontal strain was observed is less pronounced than at Sites 27 and 40, it is nonetheless present.
Studies of the vertical densification of snow are complicated by many factors such as the accumulation, temperature, temperature gradients, snow character and cataclysmal slumping of incompetent layers, and it is unfortunate to find that horizontal strains must also be considered. However, the horizontal strain-rates contain the clues to glacier behavior Reference Nye 9 and with the use of the distance-measuring tellurometer for determining distances rapidly and accurately, it should soon be possible to outline completely the velocity fields for glaciers, ice caps or ice shelves.
The authors wish to acknowledge the helpful assistance and discussions of Dr. Trevor Hatherton, Stephen den Hartog and Al. Stuart.



