


1. Introduction
It is well known that introducing a trace amount of high-molecular-weight polymers to Newtonian turbulent flows (NT) results in dramatic drag reduction (DR) (Toms Reference Toms1949; Procaccia, L'vov & Benzi Reference Procaccia, L'vov and Benzi2008; White & Mungal Reference White and Mungal2008). Irrespective of the polymer type and polymer–solvent combination, the efficacy of DR increases as the ratio of elastic to inertial forces is increased and eventually saturates at the maximum drag reduction (MDR) asymptote. Moreover, as DR is enhanced, the mean velocity profile changes from the von Kármán log law for NT to the well-known Virk law for MDR (Virk Reference Virk1975; White, Dubief & Klewicki Reference White, Dubief and Klewicki2012; Elbing et al. Reference Elbing, Perlin, Dowling and Ceccio2013). The physical origin of polymer-induced DR has been ascribed to the interaction between polymer chains and turbulent vortices caused by the enhancement of the elongational viscosity observed in dilute polymer solutions as a result of the polymer extension, first postulated by Lumley (Reference Lumley1969) and Seyer & Metzner (Reference Seyer and Metzner1969) and then first confirmed through direct numerical simulation calculations of viscoelastic channel flow by Sureshkumar, Beris & Handler (Reference Sureshkumar, Beris and Handler1997). Specifically, the mean shear flow stretches polymers that in turn suppresses small-scale quasi-streamwise vortices (Sureshkumar et al. Reference Sureshkumar, Beris and Handler1997; De Angelis, Casciola & Piva Reference De Angelis, Casciola and Piva2002; Dubief et al. Reference Dubief, Terrapon, White, Shaqfeh, Moin and Lele2005; Li, Sureshkumar & Khomami Reference Li, Sureshkumar and Khomami2006, Reference Li, Sureshkumar and Khomami2015).
Until a decade ago, mechanistic understanding of MDR was one of the most debated topics in turbulent viscoelastic unidirectional parallel shear flows. However, recent definitive experiments and simulations (Choueiri, Lopez & Hof Reference Choueiri, Lopez and Hof2018; Lopez, Choueiri & Hof Reference Lopez, Choueiri and Hof2019; Shekar et al. Reference Shekar, McMullen, Wang, McKeon and Graham2019) have shown that at relatively low Reynolds number, for example  $Re\sim 3150$ in pipe flow, as elastic forces are enhanced a reverse transition from NT or elastically modified NT to a laminar flow occurs. In turn, this laminar flow undergoes a secondary instability as elastic forces are further enhanced leading to a new chaotic flow state dubbed ‘elasto-inertial turbulence’ (EIT) that exhibits DR that is equivalent to MDR. Thus the MDR state is dynamically disconnected from NT. The dominant flow structure in the EIT flow state is that of spanwise-oriented two-dimensional structures that are sustained by both elastic and inertial effects (Samanta et al. Reference Samanta, Dubief, Holzner, Schäfer, Morozov, Wagner and Hof2013; Sid, Terrapon & Dubief Reference Sid, Terrapon and Dubief2018). At higher
 $Re$ the laminar flow regime is bypassed and flow directly transitions from an elastically modified NT to the EIT flow state further underscoring the fact that MDR is an EIT flow state irrespective of
 $Re$ (Choueiri et al. Reference Choueiri, Lopez and Hof2018).
In sharp contrast to the reverse transition that occurs in DR parallel shear flows, polymer-induced flow relaminarization accompanied by significant drag enhancement (DE) has recently been observed (Zhu et al. Reference Zhu, Song, Liu, Lu and Khomami2020) in an anticyclonic spanwise-rotating (positive rotation number  $Ro$ as defined below) viscoelastic plane Couette flow (RPCF; the zero-curvature limit of Taylor–Couette flow) at relatively low
 $Ro$. Despite the opposite drag modification (DM), this relaminarization phenomenon substantiates the universal interplay between turbulent vortices and polymer chains in viscoelastic flow, namely polymer chains stretch in the near-wall region and, in turn, weaken turbulent vortices via extraction of kinetic energy from turbulent motions. At high
 $Ro$ elastic effects are amplified even at relatively low elasticity number (ratio of elastic to inertial forces) and thus lead to a Coriolis- and elastic-force-driven flow transition from a DR inertial to a DE elasto-inertial turbulent flow (Zhu et al. Reference Zhu, Song, Lin, Liu, Lu and Khomami2022). The dominant coherent structure in the EIT flow state is that of small-scale streamwise-elongated vortices attached to the walls. These vortices cause strong incoherent transport and significant homogenization of polymer stress. Hence, DE in viscoelastic RPCF (Zhu et al. Reference Zhu, Song, Lin, Liu, Lu and Khomami2022) is mainly realized by the interaction of these vortices with polymer chains. To that end, it is rational to expect that a significant increase in elastic forces could lead to a maximum DE (MDE) asymptote in this class of EIT flows.
In this paper, we demonstrate for the first time the existence of a MDE asymptote in the EIT flow state of viscoelastic RPCF. Specifically, it is clearly shown that in a viscoelastic RPCF at high  $Ro$, raising the fluid elasticity, quantified via the Weissenberg number,
 $Wi$, results in continuous DE that eventually plateaus as the MDE asymptote is realized. The mean velocity profiles in this novel asymptotic flow state appear to closely follow a log-law profile that has a nearly identical slope but different intercepts as
 $Ro$ is changed. At MDE the dominant coherent flow structure is that of small-scale streamwise-elongated wall vortices that are almost identical to the EIT flow state in viscoelastic RPCF. Hence much like MDR, this flow state is also mainly sustained by elastic forces.
2. Problem formulation and computational details
The existence of the MDE asymptote in viscoelastic RPCF is explored by direct numerical simulations using a highly efficient three-dimensional spectral parallel algorithm (Liu & Khomami Reference Liu and Khomami2013; Teng et al. Reference Teng, Liu, Lu and Khomami2018; Song et al. Reference Song, Teng, Liu, Ding, Lu and Khomami2019; Zhu et al. Reference Zhu, Song, Liu, Lu and Khomami2020, Reference Zhu, Song, Lin, Liu, Lu and Khomami2022). We have chosen  $h, h/U_w, U_w$ and
 $\rho {U_w}^2$ as scales for length, time, velocity
 $\boldsymbol {u}$ and pressure
 $P$, respectively. Here,
 $P$ is the effective pressure, i.e. it includes the contribution of centrifugal force (Salewski & Eckhardt Reference Salewski and Eckhardt2015; Brauckmann, Salewski & Eckhardt Reference Brauckmann, Salewski and Eckhardt2016; Gai et al. Reference Gai, Xia, Cai and Chen2016). The half-gap width is denoted by
 $h$,
 $U_w$ is the wall linear velocity,
 $\varOmega _z$ is the spanwise rotation rate and
 $\rho$ represents the polymeric solution density (see figure 1). The evolution of the polymer conformation tensor
 $\boldsymbol {C}$ is given by the FENE-P (finitely extensible nonlinear elastic-Peterlin) constitutive equation. This model can quantitatively describe the nonlinear steady shear rheology of nearly constant viscosity dilute polymeric solutions as well as qualitatively capturing their extensional viscosity, in the absence of chain scission. The non-dimensionalized governing equations for an incompressible flow of FENE-P fluids are obtained in a rotating frame of reference with the spanwise rotation rate
 $\varOmega _z$, given as follows:
 \begin{gather} \frac{\partial \boldsymbol{u}}{\partial t}+\boldsymbol{u}\boldsymbol{\cdot}\boldsymbol{\nabla}\boldsymbol{u} ={-}\boldsymbol{\nabla} P+\frac{\beta}{Re}\nabla^2\boldsymbol{u}+\frac{1-\beta}{Re}\boldsymbol{\nabla}\boldsymbol{\cdot}\boldsymbol{\tau}^p-{Ro}{\boldsymbol{e_z}}\times\boldsymbol{u}, \end{gather}
 \begin{gather} \frac{\partial \boldsymbol{C}}{\partial t} ={-}\boldsymbol{u}\boldsymbol{\cdot}\boldsymbol{\nabla}\boldsymbol{C}+\boldsymbol{C}\boldsymbol{\cdot}\boldsymbol{\nabla}\boldsymbol{u} +(\boldsymbol{\nabla}\boldsymbol{u})^{\rm T}\boldsymbol{\cdot}\boldsymbol{C}-\boldsymbol{\tau}^p. \end{gather}
The polymer stress tensor  $\boldsymbol {\tau }^p$ is obtained via the Peterlin function
 $f(\boldsymbol {C})$ as follows:
 \begin{equation} \boldsymbol{\tau}^p=\frac{1}{Wi}(f(\boldsymbol{C})\boldsymbol{C}-\boldsymbol{I}),\quad f(\boldsymbol{C})=\frac{L^2-3}{L^2\text{-trace}(\boldsymbol{C})}, \end{equation}
where  $\beta =\eta _s / \eta _t$, with
 $\eta _s$ and
 $\eta _p$ being respectively the solvent and polymeric contributions to the total viscosity
 $\eta _t$, and
 $L$ denotes the maximum polymer chain extension. The Weissenberg, Reynolds and rotation numbers are defined as
 $Wi=\lambda U_w/h$,
 $Re=\rho U_w h/\eta _t$ and
 $Ro=2{\varOmega _z}h/U_w$, respectively, where
 $\lambda$ is the polymer relaxation time. It should be noted that the FENE-P model is the constitutive equation of choice for describing the ensemble-averaged chain dynamics of dilute polymeric solutions composed of linear macromolecules. In the bulk flow, a small diffusive term
 $\kappa \nabla ^2\boldsymbol {C}$ corresponding to a Schmidt number
 $Sc=1/(\kappa Re)=0.15$ is added to (2.2) to stabilize numerical integration of the constitutive equation following Sureshkumar et al. (Reference Sureshkumar, Beris and Handler1997). As demonstrated in our prior studies (Zhu et al. Reference Zhu, Song, Liu, Lu and Khomami2020, Reference Zhu, Song, Lin, Liu, Lu and Khomami2022), this
 $\kappa$ value does not modify the essential features of viscoelastic RPCF. The above equations are supplemented by no-slip boundary conditions at the walls, as well as periodic boundary conditions in the homogeneous streamwise and spanwise directions (Teng et al. Reference Teng, Liu, Lu and Khomami2018). It should also be noted that the diffusive term is not added to the evolution equation for the conformation tensor at solid boundaries; thus no boundary conditions are imposed at the walls for
 $\boldsymbol {C}$.
Sketch of spanwise-rotating plane Couette flow.

A comprehensive examination of polymer-induced asymptotic states in viscoelastic RPCF at  $Re=1300$ is carried out over a broad range of
 $0\leq Wi\leq 100$ and at large spanwise rotation, namely
 $0.3\leq Ro\leq 0.7$ (Bech & Andersson Reference Bech and Andersson1996; Gai et al. Reference Gai, Xia, Cai and Chen2016; Zhu et al. Reference Zhu, Song, Lin, Liu, Lu and Khomami2022), where the wall region is populated by Coriolis-force-generated small-scale vortices. Large values of
 $\beta = 0.9$ and
 $L = 120$ are used to ensure that the dilute polymeric solution has a nearly shear-independent viscosity and a large elongational viscosity known to play a significant role in elastically induced flow transitions in curvilinear flows. To experimentally realize the reported simulation results, two classes of polymeric solutions, namely water-soluble polymers and ‘Boger’ fluids, should be considered. For example, water-soluble polymers such as polyethylene oxide (PEO) and polyacrylamide (PAAM) offer the desired variability in molecular weight, namely
 $50\,000$–
 $6\,000\,000$ Da for PEO and
 $10\,000$–
 $70\,000\,000$ Da for PAAM, and the variation in persistence length, i.e. 3.7 Å and lower, to fine-tune
 $L$,
 $\lambda$ and
 $\beta$ as desired. Evidently, a careful mapping of molecular parameters and the specific polymer concentration is required to match the simulation and experimental parameters (Serafini et al. Reference Serafini, Battista, Gualtieri and Casciola2022). However, it is well known that the extensional rheology of polymeric solutions commonly used in this class of flows cannot be characterized via a single,
 $L$ parameter. For that matter, capturing the linear viscoelastic response of the fluid requires a multi-mode description. Considering that direct numerical simulation with multi-modes and different
 $L$ associated with each mode is beyond the current capabilities of the most powerful supercomputers, the computational rheology community has made the pragmatic choice of using a set of variables that closely approximate the fluid rheology of solutions used in turbulent flows of polymeric solutions. A computational domain of
 $L_x\times L_y\times L_z=10{\rm \pi} \times 2\times 4{\rm \pi}$ and a corresponding grid size of
 $N_x\times N_y\times N_z=256\times 129\times 256$ with grid resolutions in wall units
 $\Delta x^+\times (\Delta y^+_{min}, \Delta y^+_{max})\times \Delta z^+ \lesssim 17.8\times (0.04, 3.6)\times 7.1$ are used for the streamwise (
 $x$), wall-normal (
 $y$) and spanwise (
 $z$) directions, respectively (Bech & Andersson Reference Bech and Andersson1996; Gai et al. Reference Gai, Xia, Cai and Chen2016; Zhu et al. Reference Zhu, Song, Liu, Lu and Khomami2020). The superscript ‘+’ denotes hereafter a quantity non-dimensionalized by the viscous length scale. Informed by our prior studies (Zhu et al. Reference Zhu, Song, Liu, Lu and Khomami2020, Reference Zhu, Song, Lin, Liu, Lu and Khomami2022), calculations of
 $\sim 1000h/U_w$ with a small time step, i.e.
 $\Delta t=0.01$ (corresponding to
 $\Delta t^+\lesssim 0.088$), and a Courant–Friedrichs–Lewy number
 $\approx 0.11$ are performed to ensure that statistically stationary flows have been realized.
3. Results and discussion
The existence of the polymer-induced MDE asymptote is clearly depicted by the  $Wi$ dependence of the frictional Reynolds number (
 $Re_\tau$; see figure 2a) and the corresponding mean velocity profiles (see figure 2b). For all
 $Ro$ considered, namely
 $Ro=0.3$, 0.4 and 0.7, an increase in
 $Wi$ from 0 to 20 results in an expected increase of
 $Re_{\tau }$ and a commensurate increase of DE. However, the DE of viscoelastic RPCF eventually plateaus at
 $40\leq Wi\leq 100$ (see figure 2a). Despite the opposite DM, the asymptotic behaviour of drag is quite similar to MDR in channel (Samanta et al. Reference Samanta, Dubief, Holzner, Schäfer, Morozov, Wagner and Hof2013; Sid et al. Reference Sid, Terrapon and Dubief2018; Shekar et al. Reference Shekar, McMullen, Wang, McKeon and Graham2019) and pipe (Choueiri et al. Reference Choueiri, Lopez and Hof2018; Lopez et al. Reference Lopez, Choueiri and Hof2019) flows. It should also be noted that the influence of the added global artificial diffusion on this asymptotic behaviour has been extensively examined (see the Appendix for details). Our extensive analysis shows that as
 $Sc$ is increased, simulations converge to the same MDE asymptote. Hence, the MDE asymptote is an inherent dynamical property of viscoelastic RPCF in the EIT flow regime.
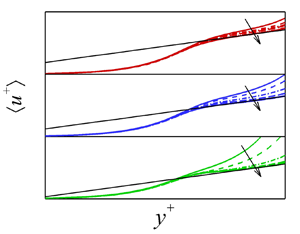
(a) Frictional Reynolds number  $Re_\tau =\rho u_\tau h/\eta _t$ versus
 $Wi$ at various
 $Ro$ with
 $u_\tau =\sqrt {\tau _w/\rho }$ being the frictional velocity and
 $\tau _w$ the total wall stress (the sum of viscous stress and polymer stress). Here, DE is evaluated as
 $(Re_\tau ^2-Re_{{\tau }0}^2)/Re_{{\tau }0}^2$, where
 $Re_{\tau 0}$ is the frictional Reynolds number of the Newtonian flow. (b) Log plot of mean velocity profile
 $\langle u^+ \rangle$ in the lower half of the channel for each
 $Ro$ versus wall-normal distance
 $y^+$ at
 $Wi=0, 5, 10, 20, 40, 60, 80, 100$, where
 $\langle \ \rangle$ denotes the ensemble average. Here,
 $\langle u^+ \rangle \equiv \langle (u+U_w)^+ \rangle$, and hereafter
 $\langle u^+ \rangle =\kappa _K^{-1}\ln {y^+}+B$ with
 $\kappa _K=0.85$ is plotted as a visual guide. The square of the correlation coefficients
 $R^2$ between the simulation results and the linear fitting curves for
 $Ro=0.3, 0.4, 0.7$ at
 $Wi=100$ are obtained, respectively, as
 $R^2\approx 0.993, 0.995, 0.991$.

The velocity profile of this novel asymptotic flow state saturates to a remarkable logarithmic-like law when plotted using traditional inner variable scaling (see figure 2b), much like the well-known von Kármán law for NT ( $\langle u^+ \rangle \approx 0.41^{-1}\ln y^{+}+5.1$) and the Virk law at MDR (
 $\langle u^+ \rangle \approx 11.7\ln y^{+}-17$) (Shaqfeh & Khomami Reference Shaqfeh and Khomami2021). For all
 $Ro$ examined, the mean velocity
 $\langle u^+ \rangle$ gradually decreases in the core region as
 $Wi$ is increased from 0 to 20. The
 $\langle u^+ \rangle$ profile at
 $40\leq Wi\leq 100$ appears to collapse onto a nearly identical logarithmic-like law dubbed the MDE asymptote. As a visual guide, we have plotted
 $\langle u^+ \rangle =\kappa _K^{-1}\ln y^{+}+ B$ in the region
 $y\gtrsim 20$. Using this fitting procedure, the MDE asymptotes at different
 $Ro$ have almost the same logarithmic slope (
 $\kappa _K=0.85$) but different intercepts, i.e.
 $B=5.1, 4.1, 2.8$ for
 $Ro=0.3, 0.4, 0.7$, respectively (see figure 2b). Moreover, the existence of the MDE asymptote along with its nearly identical logarithmic slope are also observed at higher
 $Re$, for example at
 $Re=2600, 3900$ at
 $Ro=0.7$ (see the Appendix for details). Hence, there is clear evidence of existence of MDE at high
 $Re$. To that end, to prove the universality of this finding along with the existence of a log law similar to the von Kármán law, simulations at higher
 $Re$ are of paramount importance.
It should also be noted that when one examines the indicator function  $\zeta =y^+ \,{\rm d}\langle u^+ \rangle /{{\rm d} y}^+$ (see figure 3), the
 $\langle u^+ \rangle$ profiles at the MDE asymptote are not a well-defined logarithmic function over a large range of
 $y^+$. In fact, the slope deviates from
 $\kappa _K=0.85$ especially for
 $Ro=0.7$. Such deviations of the
 $\langle u^+ \rangle$ profiles from the logarithmic functional relationship have been reported widely for low-
 $Re$ turbulent flows with polymer addition at the MDR asymptote (White et al. Reference White, Dubief and Klewicki2012; Elbing et al. Reference Elbing, Perlin, Dowling and Ceccio2013) and Newtonian Taylor–Couette flows (Ostilla, Verzicco & Lohse Reference Ostilla, Verzicco and Lohse2015, Reference Ostilla, Verzicco and Lohse2016). Nevertheless, the logarithmic-like profiles of a nearly identical slope clearly underscore the fact that the asymptotic states, namely MDR and MDE, are inherent properties of turbulent flow of dilute polymeric solutions. To that end, irrespective of the observed DM, the asymptotic states originate from the intricate balance between inertial and elastic forces, in the elastically dominated EIT flow state. This further underscores the universality of polymer interactions with vortical structures (Teng et al. Reference Teng, Liu, Lu and Khomami2018; Zhu et al. Reference Zhu, Song, Liu, Lu and Khomami2020, Reference Zhu, Song, Lin, Liu, Lu and Khomami2022).
Indicator function  $\zeta =y^{+}\langle u^+ \rangle /{{\rm d} y}^{+}$ typically used to indicate logarithmic dependence of the mean velocity profile: (a)
 $Ro=0.3$; (b)
 $Ro=0.4$; (c)
 $Ro=0.7$.

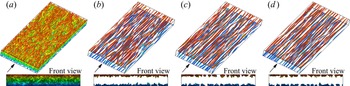
A prototypical visualization of the flow via instantaneous snapshots of turbulent vortices at the MDE asymptote is shown in figure 4. Evidently, introducing polymer additives to NT results in an obvious suppression of turbulent vortices as also seen in DR pipe (Choueiri et al. Reference Choueiri, Lopez and Hof2018; Lopez et al. Reference Lopez, Choueiri and Hof2019) and channel (Samanta et al. Reference Samanta, Dubief, Holzner, Schäfer, Morozov, Wagner and Hof2013; Sid et al. Reference Sid, Terrapon and Dubief2018; Shekar et al. Reference Shekar, McMullen, Wang, McKeon and Graham2019) flows. However, as the asymptotic MDE state is approached, i.e.  $40\leq Wi\leq 100$, the dominant flow feature is that of small-scale streamwise-elongated vortices that are attached to the walls. These flow features are nearly identical to the EIT observed in viscoelastic RPCF (Zhu et al. Reference Zhu, Song, Lin, Liu, Lu and Khomami2022) where it has been unequivocally demonstrated that streamwise-elongated vortices are generated by Coriolis forces that arise due to system rotation. These findings underscore the mechanistic difference between the present rotation-driven EIT flow state and other unidirectional planar and axisymmetric shear-driven EIT. However, the combined effects of rotation and curvature in viscoelastic Taylor–Couette flow give rise to small-scale elastic Görtler vortices which are also streamwise-elongated, i.e. oriented along the azimuthal direction (Song et al. Reference Song, Teng, Liu, Ding, Lu and Khomami2019, Reference Song, Lin, Liu, Lu and Khomami2021a,Reference Song, Wan, Liu, Lu and Khomamib). Overall, in RPCF these rotation-rendered, namely Coriolis-force-generated, turbulent vortices give rise to significant incoherent transport and homogenization of polymer stretch/stress. To that end, it is not surprising that the EIT flow state observed in RPCF has opposite DM and flow features different from those of EIT in channel (Samanta et al. Reference Samanta, Dubief, Holzner, Schäfer, Morozov, Wagner and Hof2013; Sid et al. Reference Sid, Terrapon and Dubief2018; Shekar et al. Reference Shekar, McMullen, Wang, McKeon and Graham2019) and pipe (Choueiri et al. Reference Choueiri, Lopez and Hof2018; Lopez et al. Reference Lopez, Choueiri and Hof2019) flows, namely three-dimensional streamwise-oriented structures as opposed to two-dmensional spanwise-oriented structures. Note that in figure 4, the occurrence of MDE is indicated to be accompanied by an intriguing saturation of these streamwise-elongated vortices.
Instantaneous vortical structures of  $Re=1300, Ro=0.7$ identified by the
 $Q$ criterion with
 $Q=0.2$ and coloured as a function of distance from the lower wall. The upper and lower plots are the full and front (
 $x$-direction) views, respectively. (a) Newtonian; (b)
 $Wi=40$; (c)
 $Wi=60$; (d)
 $Wi=100$.

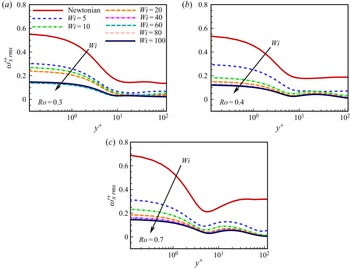
The saturation of small-scale vortices, i.e. in terms of number density and overall shape, is quantified by the streamwise vorticity fluctuation  $\omega '^+_{x,rms}$ depicted in figure 5. It is clearly seen that as the MDE asymptote is approached via increasing
 $Wi$ for various
 $Ro$,
 $\omega '^+_{x,rms}$ reaches an asymptotic limit across the gap. The change in
 $\omega '^+_{x,rms}$ is mainly attributed to the near-wall turbulent vortical structures (Kim et al. Reference Kim, Li, Sureshkumar, Balachandar and Adrian2007). Hence, the ‘saturation’ of streamwise-elongated vortices at the MDE asymptote corresponds to a limiting state of small-scale vortical flows. In the EIT of viscoelastic RPCF, turbulent vortices are known to facilitate transverse momentum exchange and turbulent mixing of polymer stress via their circulations, i.e. they account for the generation of Reynolds (
 $J^u_R$) and polymer (
 $J^u_p$) stresses and thus the total drag force (Zhu et al. Reference Zhu, Song, Liu, Lu and Khomami2020, Reference Zhu, Song, Lin, Liu, Lu and Khomami2022). As evidenced in figure 6,
 $J^u_R$ and
 $J^u_p$ reach a plateau when the MDE is realized. Therefore, the asymptotic MDE state originates from saturation of turbulent vortices at
 $Wi\geq 40$.
The root-mean-square value of streamwise vorticity fluctuation for  $Wi=0, 5, 10, 20, 40, 60, 80, 100$ at (a)
 $Ro=0.3$, (b)
 $Ro=0.4$ and (c)
 $Ro=0.7$.

The volume-averaged Reynolds stress (red lines) and polymer stress (blue lines) for  $Ro=0.3, 0.4, 0.7$ calculated as
 $J^u_R=({1}/{2h}){{\int }_{-h}^h}{\langle -u'v'\rangle }\,{{\rm d} y}$ and
 $J^u_p=({1}/{2h}){{\int }_{-h}^h}{\langle (({1-\beta })/{Re})\tau _{xy}^p\rangle }\,{{\rm d} y}$, respectively (Zhu et al. Reference Zhu, Song, Liu, Lu and Khomami2020, Reference Zhu, Song, Lin, Liu, Lu and Khomami2022), where
 $\boldsymbol {u}'=\boldsymbol {u}-\langle \boldsymbol {u}\rangle$.

The magnitudes of Reynolds and polymer stresses and their variations as a function of  $Wi$ closely capture the intrinsic competition between inertial and elastic forces that drive flow transitions from NT to EIT flows and commensurate DM (see figure 6). Evidently for the range of
 $Ro$ considered, as
 $Wi$ is continuously increased the magnitude of polymer stress monotonically grows and eventually becomes significantly larger than that of Reynolds stress as the MDE asymptote is approached. This underscores the fact that elastic forces play a central role in sustaining turbulence dynamics at MDE. Furthermore, an example of energy exchange between turbulent motions and polymer chains, i.e.
 $-P^t_{p}$ at
 $Ro=0.7$, is shown in figure 7. In the buffer layer (
 $y^+\approx 10$),
 $-P^t_{p}>0$ indicates that stretched polymer chains release their stored elastic energy to enhance turbulent kinetic energy (TKE). For all
 $Ro$ considered, the contribution of
 $-P^t_{p}$ to production of TKE is enhanced as
 $Wi$ increases and eventually plateaus at the MDE state. It is noteworthy that turbulent motions in NT only extract TKE from the mean shear flow. Therefore,
 $-P^t_{p}$ works as a source term to produce TKE via releasing stored polymeric elastic energy. Hence, there are distinct differences between the mechanism by which NT and EIT flows are sustained. This in turn provides additional evidence that the asymptotic DM behaviour in viscoelastic turbulent flow of dilute polymeric solutions, namely MDR and MDE, arises due to the unique elastic nature of EIT flow state.
Energy exchange between turbulent motions and polymer chains denoted by  $-P^t_{p}=-\langle {\tau ^{p}_{ik}}'(\partial {u'_i} / \partial {x_k})\rangle$ for
 $Ro=0.7$ (Zhu et al. Reference Zhu, Song, Liu, Lu and Khomami2020, Reference Zhu, Song, Lin, Liu, Lu and Khomami2022).

Taken together, the above observations clearly indicate that for all  $Ro$ considered, introducing polymer additives results in suppression of vortical structures and continuous decrease of Reynolds stress as
 $Wi$ is enhanced. Hence, the asymptotic flow state is realized when elastic forces become sufficiently large and the Reynolds stress becomes vanishingly small. Clearly their ratio reaches a constant value when the MDE asymptote is reached (see figure 6). The main coherent structure at MDE is that of nearly uniform flow vortical structures (see figure 4). The aforementioned vortical structure changes as a function of
 $Wi$ and the commensurate decrease in Reynolds stress are very similar to what is seen in DR planar shear flows. Specifically, for RPCF of
 $Re=1300, Ro=0.4$, the Reynolds stress is reduced up to 78.1 % as
 $Wi$ increases from 0 to 100; it is comparable to 85.7 % DR realized in channel flow at
 $Re=6000, Wi=100$ (Samanta et al. Reference Samanta, Dubief, Holzner, Schäfer, Morozov, Wagner and Hof2013). This points to the universality of the interplay between polymer and vortical structures at both asymptotic states, i.e. MDR and MDE. The differences in DM between turbulent viscoelastic RPCF and channel and pipe flows can be rationalized by the fact that in RPCF the Coriolis-force-generated small-scale vortices transport highly stretched polymer chains at the walls to the bulk flow. This in turn leads to incoherent transport and homogenization of polymer stress and results in notable DE (Zhu et al. Reference Zhu, Song, Lin, Liu, Lu and Khomami2022).
4. Concluding remarks
In summary, the existence of the MDE asymptote has been demonstrated for the first time via high-fidelity direct numerical simulation. Specifically, it is shown that at sufficiently large  $Ro$, introduction of polymer additives results in DE in RPCF. The extent of DE gradually increases as the elastic forces are enhanced, i.e.
 $Wi$ is increased, and eventually plateaus at the MDE asymptote. For the range of
 $Ro$ considered, the mean velocity profiles at MDE appear to attain a remarkable logarithmic-like law characterized by a nearly identical slope, i.e. a von Kármán-like constant
 $\kappa _K=0.85$. Furthermore, it has clearly been shown that the MDE asymptote is realized in the EIT flow state that is mainly sustained by elastic forces. Similar to pipe and channel flows, polymer additives store elastic energy in the near-wall region and in turn release this energy in the buffer layer to enhance TKE. This points to the universality of the interaction between polymer chains and vortical structures in the MDR and MDE flow states. These observations taken together demonstrate that the asymptotic behaviour seen in polymer-induced DM, i.e. MDR and MDE, is an inherent property of EIT flow state. To that end, a universal picture of elastically induced DM asymptotes is emerging, namely that these asymptotic states are an inherent property of elastically sustained EIT flow state. Hence, the discovery of the MDE asymptote has paved the way for coordinated experimental/simulation/theoretical studies in a variety of turbulent flows to establish the universality of asymptotic flow states in the EIT flow regime.
Acknowledgements
The presented calculations were performed at the Supercomputing Center of University of Science and Technology of China.
Funding
We would like to acknowledge funding from NSFC grant nos 12172353, 11621202, 92252202, 92052301, 91752110, 12172351 and NSF grant CBET0755269.
Declaration of interests
The authors report no conflict of interest.
Appendix
The influence of global artificial diffusion has been extensively examined via test simulations at  $Re=1300$ and
 $Ro=0.7$ with a highly refined grid size of
 $N_x\times N_y\times N_z=512\times 256\times 512$ and a much smaller time step
 $\Delta t=0.0025$ (Sureshkumar & Beris Reference Sureshkumar and Beris1995; Sureshkumar et al. Reference Sureshkumar, Beris and Handler1997). The frictional Reynolds number
 $Re_\tau$, the Reynolds stress and polymer stress obtained from the simulations at three different
 $Sc$ show slight variation at
 $0\leq Wi\leq 20$, while at
 $40\leq Wi\leq 100$ they are in excellent agreement (see figure 8). Moreover, as
 $Wi$ is increased from 0 to 100, the mean velocity profiles at
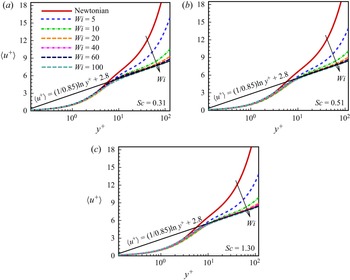
 $Sc=0.31, 0.51, 1.30$ gradually collapse into a log-law regime similar to the simulations at
 $Sc=0.15$. This indicates that in the mesh/
 $Sc$ range used in this study, global artificial diffusion does not alter the reported logarithmic slope (see figure 9). These excellent agreements at
 $40\leq Wi\leq 100$ at which the MDE asymptote is observed clearly underscore the accuracy of our reported results and the fact that MDE is an inherent dynamical property of viscoelastic RPCF.
(a) Frictional Reynolds number  $Re_\tau$ versus
 $Wi$ at
 $Re=1300, Ro=0.7, Sc=0.15, 0.31, 0.51, 1.30$. (b) Volume-averaged Reynolds stress (red lines and symbols) and polymer stress (blue lines and symbols) for
 $Ro=0.7$ at various
 $Sc$.

Log plot of mean velocity profile  $\langle u^+ \rangle$ for
 $Re=1300$,
 $Ro=0.7$ and
 $Wi=0, 5, 10, 20, 40, 60, 100$ versus wall-normal distance
 $y^+$ at (a)
 $Sc=0.31$, (b)
 $Sc=0.51$ and (c)
 $Sc=1.30$. The square of the correlation coefficient
 $R^2$ of the log law of
 $\langle u^+ \rangle$ fitted for
 $Wi=100$ is obtained as
 $R^2=0.999$, 0.998 and 0.997 for (a–c), respectively.

Moreover, the influence of  $Re$ on the MDE asymptote has been examined by simulations at
 $Re=2600$ and 3900 at
 $Ro=0.7$,
 $Wi=0$–
 $60$. The highest
 $Re$ is calculated with a much finer grid size of
 $N_x\times N_y\times N_z=512\times 256\times 512$ and a smaller time step
 $\Delta t=0.005$. The introduction of polymer additives results in an obvious increase of
 $Re_\tau$, and a commensurately large DE. Similar to the simulation results at
 $Re=1300$, the DE basically reaches a plateau at
 $40\leq Wi\leq 60$ (see figure 10a). Moreover, the mean velocity
 $\langle u^+ \rangle$ at the MDE asymptote closely follows the visual guide
 $\langle u^+ \rangle =(1/0.85)\ln y^{+}+ 4.4$ for
 $Re=2600$ and
 $\langle u^+ \rangle =(1/0.85)\ln y^{+}+ 4.5$ for
 $Re=3900$. The fact that at the
 $Re$ considered the logarithmic-like profiles have an identical slope demonstrates that the reported MDE asymptote is not a sensitive function of
 $Re$.
(a) Frictional Reynolds number  $Re_\tau$ versus
 $Wi$ at
 $Re=1300, 2600, 3900$ and
 $Ro=0.7$ and (b) the corresponding logarithmic-like mean velocity profile
 $\langle u^+ \rangle$ versus wall-normal distance
 $y^+$ at various
 $Wi$. For the log law of
 $\langle u^+ \rangle$ fitted at
 $Wi=60$,
 $R^2$ is obtained as 0.991 and 0.998 for
 $Re=2600$ and 3900, respectively.

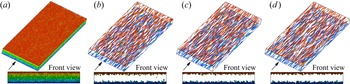
As noted above, the MDE asymptotic state is an EIT flow state as evidenced by the presence of small-scale streamwise-elongated vortices attached to the walls (see figure 11). This suggests that the turbulent flow state and the elastic nature of MDE could be universal for this class of flows. However, the  $Re$ values considered in the present study are still relatively low in comparison to
 $Re$ at which the log law is studied in NT. Hence, simulations at higher
 $Re$ are of paramount importance in establishing the universality of MDE and the existence of a von Kármán-like log law seen in high-
 $Re$ turbulent Newtonian flows.
Prototypical instantaneous snapshots of vortical structures at  $Re=3900, Ro=0.7$ identified by the
 $Q$ criterion with
 $Q=0.2$ and coloured as a function distance from the lower wall. The upper and lower plots are the full and front (
 $x$-direction) views, respectively. (a) Newtonian; (b)
 $Wi=20$; (c)
 $Wi=40$; (d)
 $Wi=60$.