1. Introduction
Since the 1990s, Thailand has experienced rapid industrialization, improved educational attainment, and economic growth; these developments have led to a decrease in income inequality [Ikemoto and Uehara (Reference Ikemoto and Uehara2000)]. The Gini index showed that income inequality in Thailand during 1980–2013 decreased from 45.2% to 37.8% [World Bank (2018)]. The improvement in educational attainment is widely accepted as the main determinant of decreasing income inequality in Thailand: for example, the increase in years of schooling for the heads of Thai households [Paweenawat and McNown (Reference Paweenawat and McNown2014)] and the decline in education disparity [Motonishi (Reference Motonishi2006)].
These prior works generally focused on overall education levels; none particularly focused on the composition of the educational levels of couples in households, which is called “educational assortative mating.” Despite this, educational assortative mating has received attention lately, as several studies have empirically proved its contribution to changes in household income inequality in various countries [e.g., Ermisch et al. (Reference Ermisch, Francesconi and Siedler2006), Breen and Salazar (Reference Breen and Salazar2010), Schwartz (Reference Schwartz2010), and Torche (Reference Torche2010), Greenwood et al. (Reference Greenwood, Guner, Kocharkov and Santos2014), Olivo-Villabrille (Reference Olivo-Villabrille2017)].
As there is lack of study in Thailand examining the link between educational assortative mating in households and income inequality, this study will attempt to explain the changes in household income inequality in Thailand, in particular by focusing on the changes in educational assortative mating in Thai households over the last three decades. There are two main objectives. First, this study will measure educational assortative mating in Thailand overall, and present its trend from 1985 to 2016. Second, this study will investigate the relationship between educational assortative mating and household income inequality.
The rest of the paper presents as follows. Section 2 provides the background of the study and Section 3 discusses related literature. Section 4 describes data and methodology and Section 5 shows the results. The paper concludes in Section 6.
2. Background
Utilizing the data from the national labor force survey (LFS) of Thailand from 1985 to 2016, we present the overall picture of income inequality and educational assortative mating in Thailand. The Gini coefficient is the most commonly applied measure of inequality. The Gini coefficient is based on the Lorenz curve, defined as the share of the concentration area compared to the maximum concentration area [Ravallion (Reference Ravallion1988)]. We computed the Gini coefficient by following Šošić (Reference Šošić2004, p. 125):

where y i is the income of the first i population units.
Online Appendix Table 1A presents the Gini coefficient in terms of household income and household income per capita in Thailand. The four categories exhibited similar trends in the changes in their Gini coefficients. In 1985, for example, the Gini coefficient for one-couple household income was 0.425, which decreased to 0.389 in 2015 (the trend is illustrated in Online Appendix Figure 1A). Our computed Gini coefficients were consistent with the decreasing trend mentioned by the World Bank (2018).
Online Appendix Figure 2A presents the educational assortative mating trend in Thailand. During the 1980s, the trend was consistent with Smits and Park (Reference Smits and Park2009), indicating that Southeast Asian countries like the Philippines, Indonesia, Malaysia, and Thailand had a relatively high level of educational homogamy compared to other countries in the world. However, after the 1990s, Thailand showed a decreasing trend of educational homogamy, where the proportion of spouses with the same educational attainment has been decreasing over time.
However, when we stratified by education level, we discovered that educational homogamy has only decreased in the group with only a primary education, while educational homogamy among couples who obtained higher education levels (secondary and university) has increased over time (Online Appendix Figure 3A). This pattern of increasing homogamy is consistent with evidence from the US. Eika et al. (Reference Eika, Mogstad and Zafar2019) documented that there was a significant increase in the share of couples who both obtained college degrees between 1962 and 2013, as well as an increase in the Gini coefficient in households during this period.
Even though it seems there exists a relationship between educational assortative mating and income inequality, difficulties were found in the estimation of the educational assortative mating-income inequality nexus. In particular, the documented changes in educational attainment and the increase in the economic return to education have created difficulties in measuring the impact of educational assortative mating on household income inequality.
Eika et al. (Reference Eika, Mogstad and Zafar2019) suggested that it was hard to identify changes in educational homogamy because of changes in educational attainment or educational assortative mating. With higher education, the probability will increase for a university degree holder to marry someone with the same education level, even if assortative mating does not change [Liu and Lu (Reference Liu and Lu2006)]. Moreover, as the return to education has increased over time, it made educational assortative mating more significant to the distribution of household income, with or without changes in mating behavior. To overcome this problem, Eika et al. (Reference Eika, Mogstad and Zafar2019) suggested a two-step procedure to analyze educational assortative mating and its influence on household income inequality, which we will discuss later in the methodology section.
As a result, we could not neglect these two main factors in this case study of Thailand. Online Appendix Figure 4A presents the similar trends for husbands' and wives' educational attainment, which found that the proportion of husbands and wives who attained only primary education decreased, but the proportion with secondary and university degrees increased. This increasing trend is the result of a successful policy of the Thai government to improve education levels, a compulsory education policy.
The changes in women's educational attainment led to changes in their financial contribution to the household income [Oppenheimer (Reference Oppenheimer1994)]. Although the labor force participation rate for married females in Thailand remained relatively stable over time (Online Appendix Figure 5A), the promotion of female education and the rise in their wages led to an increase in their share of household income from 43% to 47% (Online Appendix Figure 6A). An increase in the correlation of men's and women's income within households, accompanied with the increases in assortative mating, the propensity of women to work, and return to education [Reed and Cancian (Reference Reed and Cancian2009)].
Furthermore, based on a simple Mincerian wage regression, Online Appendix Table 2A reports the Ordinary Least Squares (OLS) estimates for a married individual's real log hourly wage based on years of schooling and potential work experience. The main finding is that the returns to education have decreased over the years 1985–2016. On average, one-year increase in education led to an increase in log hourly wage of approximately 0.163, while people with Bachelor's degrees earned a wage premium of around 40%.
3. Literature review
Educational assortative mating has been defined many different ways; however, the most common definition in the literature is men and women with similar education levels marrying more or less frequently than random matching [e.g. Schwartz and Mare (Reference Schwartz and Mare2005), Breen and Andersen (Reference Breen and Andersen2012), Olivo-Villabrille (Reference Olivo-Villabrille2017)]. Becker (Reference Becker1973, Reference Becker1974) proposed that people tend to search for a partner to marry in the marriage market like a matching game, while in Greenwood et al. (Reference Greenwood, Guner, Kocharkov and Santos2016), individuals met their potential partners by drawing from the distribution of singles, responding to educational choices, and by choosing whether or not to marry.
Several previous studies have found that educational assortative mating explained household income inequality [Burtless (Reference Burtless1999), Breen and Salazar (Reference Breen and Salazar2010), Schwartz (Reference Schwartz2010)]. Previous studies in the U.S. have found that assortative mating is related to changes in income inequality. Schwartz (Reference Schwartz2010) suggested that men's and women's preferences for mates became more and more symmetric as female labor force participation grew, generating greater inequality across couples. Breen and Salazar (Reference Breen and Salazar2010) and Esping-Andersen (Reference Esping-Andersen2007) found that the increase in women's education and labor force participation, combined with educational homogamy, caused greater household inequality in the US and European countries.
Katz and Autor (Reference Katz, Autor, Ashenfelter and Card1999) suggested that the rise in income inequality across families was mainly caused by the increasing correlation between the earnings of spouses. In Germany, Pestel (Reference Pestel2016) examined the effect of marital sorting on income inequality while considering labor supply choice and found that, where women are more attached to the labor market, this effect is disequalized, irrespective of adjusting for labor supply choices. Eika et al. (Reference Eika, Mogstad and Zafar2019) demonstrated that an increase in educational homogamy contributed an increase in income inequality in the US, Denmark, Germany, and the UK. This evidence is consistent with many empirical studies: e.g., Western et al. (Reference Western, Bloome and Percheski2008) and Atkinson and Morelli (Reference Atkinson and Morelli2014) for the US; and Breen and Salazar (Reference Breen and Salazar2010) for the UK.
Even though several studies have found that assortative mating related to changes in income inequality, some studies showed only small effects on income inequality. Olivo-Villabrille (Reference Olivo-Villabrille2017) suggested assortative mating alone had little effect on household income inequality, while Eika et al. (Reference Eika, Mogstad and Zafar2019) found that assortative mating accounted for a modest but non-negligible part of the inequality. Kremer (Reference Kremer1997), Cancian and Reed (Reference Cancian and Reed1999), and Hryshko et al. (Reference Hryshko, Juhn and McCue2017) found that assortative mating played a minor role in income inequality or had negative effects on inequality, while Schwartz (Reference Schwartz2010) and Greenwood et al. (Reference Greenwood, Guner, Kocharkov and Santos2014) found a positive relationship between the two.
A few related studies were found about developing countries. Torche (Reference Torche2010) explored the isomorphic association between marital sorting and inequality in Brazil, Chile, and Mexico, and found substantial variation in marital sorting between the countries. Meanwhile, Dahan and Gaviria (Reference Dahan and Gaviria2001) presented evidence on 16 Latin American countries. Hu and Qian (Reference Hu and Qian2015) found that increasing educational homogamy for married couples, among those with senior high and tertiary educations in urban China, was associated with an increase in inter-household income inequality and a decrease in intra-household income inequality.
We found one study mentioning educational assortative mating in Thailand, which is the study of Smits and Park (Reference Smits and Park2009), who studied educational assortative mating in 10 Asian countries, including Thailand. They found that the decreasing trend in educational homogamy corresponded to educational expansion. The paper also suggested that countries with higher female employment and more modern societies tended to have lower educational homogamy. Liao and Paweenawat (Reference Liao and Paweenawat2021) examined the educational expansion and high labor force participation rate of married Thai women over time, and found an inverse relationship between married women's labor supply and wages.
On the other hand, several studies on Thailand have focused on the determinants of inequality in the country. Meesook (Reference Meesook1979) found a decrease in inequality as a result of economic growth, but over time, several studies have found the opposite result [Krongkaew (Reference Krongkaew1985), Krongkaew et al. (Reference Krongkaew, Tinakorn and Suphachalasai1992), Israngkura (Reference Israngkura2003)]. Fofack and Zeufack (Reference Fofack and Zeufack1999) using Socio-Economic Survey (SES) data from 1986 to 1996, suggested that income inequality in Thailand was negatively correlated with average education. Paweenawat and McNown (Reference Paweenawat and McNown2014), using SES data from 1992 to 2011, found a positive relationship between years of schooling and income inequality. However, none of the studies took into account educational assortative mating as a main factor associated with income inequality in Thailand.
4. Data and methodology
4.1 Data
We used the annual LFS of Thailand from 1985 to 2016, which was collected by the National Statistical Office (NSO) of Thailand. Following Sussangkarn and Chalamwong (Reference Sussangkarn, Chalamwong, O'Connor and Farsakh1996), we only used the third quarter of the year, to hedge against the immigration of Thai agricultural workers during the dry and rainy seasons [Lekfuangfu (Reference Lekfuangfu2017), Paweenawat and McNown (Reference Paweenawat and McNown2018)].
Although LFS did not provide spousal information directly, the data contained a unique household number and relation codes that allowed us to match information to spouses. With the information on spouse's education, we summarized the probabilities of those who married spouses with the same education, and showed the patterns over time (Online Appendix Figure 1A).
LFS data allowed us to track the relationship between educational assortative mating and household income inequality, and investigate its impact over 30 years. The variables used in the estimation included gender, education level, years of schooling (0–23 year: no education-PhD), marital status (focused on married couples), and income (to measure inequality).
To avoid issues with school enrollment and retirement, we restricted our married sample to individuals between 25 and 60 years old. We assigned individuals to three mutually exclusive educational groups according to their level of education: primary level (with none, some, or completed primary level education), secondary level (with some or completed secondary level education), and university level (with some or completed university-level education).
We obtained household income by pooling the income from each spouse in the household, and excluded individuals with missing income information. Online Appendix Table 3A reports the basic statistics of the sample used in our estimation.
Online Appendix Table 3A summarizes the key characteristics of the sample of married couples aged 25 to 60 in Thailand over time. The sample age for both men and women has increased gradually over the three time periods. There has been a convergence in the education levels of men and women over the three periods, accompanied with an increase in annual income. As expected, the labor force participation rate was relatively stable in Thailand.
4.2 Methodology
Following Eika et al. (Reference Eika, Mogstad and Zafar2019), this study adapted a two-step procedure to analyze educational assortative mating and its influence on household income inequality. First, we calculated the assortative mating parameter to examine its magnitude and how it changed over time. Then, we employed the semiparametric decomposition method of DiNardo et al. (Reference DiNardo, Fortin and Lemieux1996) to test whether the increase in educational attainment, the increase in the return to education, and the changes in assortative mating could be the variables for the changes in household income inequality in Thailand over three decades.
We first needed to compute assortative mating by following the method proposed by Eika et al. (Reference Eika, Mogstad and Zafar2019). The marital sorting parameters were the observed probability of couples that had the same education level, relative to the probability when spouses were matched randomly in terms of education attainment:

where e w, e h were the observed education levels for wives and husbands, and E w, E h denoted the education levels for wives and husbands. If the parameter is larger than 1, men and women tend to marry individuals with the same level of education more frequently than random chance, indicating positive educational assortative mating.
In addition, we also applied an alternative method proposed by Greenwood et al. (Reference Greenwood, Guner, Kocharkov and Santos2016) and Eika et al. (Reference Eika, Mogstad and Zafar2019) to compute educational assortative mating. We applied a regression model for wives' and husbands' years of schooling to estimate educational assortative mating [equation (2)]. We ran the regression on wives'(husbands') years of schooling on an intercept and husbands' (wives') years of schooling:

where $Edu_y^w$ , $Edu_y^h$
 denote the years of schooling for wives (w) and husbands (h) in year y.
The variable Year ty is a time dummy, where Year ty = 1 if t = y, and Year ty = 0 if t ≠ y; t ∈ T ≡ {1985, 1986, 1987, 1988, …, 2016}.
The coefficient (β) measures the changes in assortative mating over time.
Besides, we also used the SES panel in 2005 to 2012, conducted by NSO of Thailand to analyze the assortative mating in recent years. We applied probit model estimating the effect of husband's education level on wife's education level.

where y it is an indicator that equals 1 if wife has the education (either primary, secondary or university) in the contingency table. z it is a dummy variable, indicating the husband obtained either primary, secondary or university education if equals 1, 0 otherwise; x it is the control variables including age, age squares. θ represents the probability of choosing a husband with certain education level for wife with the certain education levels in the contingency table.
To measure the contribution of educational assortative mating, educational attainment, and return to education to changes in household inequality, we applied the DFL decomposition method [DiNardo et al. (Reference DiNardo, Fortin and Lemieux1996)], which provides income distributions under several counterfactual scenarios. Similar to the counterfactual income distribution applied by Eika et al. (Reference Eika, Mogstad and Zafar2019), we fixed the distribution of one of the three factors at a base year while others varied over time, and compared it with the actual specification. Through a comparison of the counterfactual scenario to actual income distribution in the base year, we could observe how household income inequality has been affected over time.
The distribution of income at time t is:

where i is household income and x is educational attainment. F I|X(i|x, t) is the conditional distribution of income for married couples with characteristic x (educational assortative mating, educational attainment, or return to education) in year t, and F X(x|t) is the joint distribution of spouses' education at time t.
We let t i be the year when the factors are measured, t x be the year when education is measured, and t p be the year when the educational marital sorting parameter is measured. The income distribution under the counterfactual scenario is:


where $d\tilde{F}_X( x\vert t_x, \;t_p)$ is the joint distribution of education measured at time t x, and marital sorting parameter measured at time t p.
5. Results
5.1 Educational assortative mating in Thailand
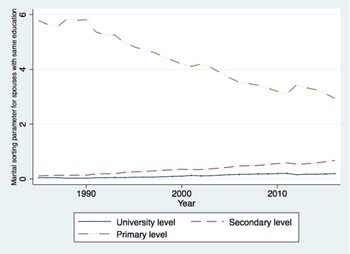
We measured the degree of assortative mating using the formula in equation (1). Figure 1 presents the educational marital sorting parameter s(e w, e h) over time. We can see it has declined for the primary-educated level, but increased for the secondary and university levels. In Thailand, married couples with a primary education were much more likely to marry each other before the 1990s; however, due to an increase in educational attainment over the past three decades, this parameter has declined continuously since the 1990s, and dropped sharply, by around 50%, in recent years.
Marital sorting parameter for spouses with the same educational attainment.
Source: Authors' calculation.

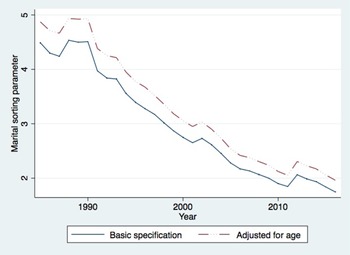
Figure 2 measures the aggregate educational parameter for similarly educated married couples. The figure shows an obvious downward pattern over the three periods, indicating that people are less likely to be married to spouses with the same education level than before. In 1985, Thai people with the same education were 4.5 times more likely to marry one another compared to random matching, while by 2016, it had decreased to 1.8 times.
Aggregate educational assortative mating for same educated couples.
Source: Authors' calculation.

Online Appendix Table 4A shows the results of using SES panel data for robustness check our method on computing assortative mating. The diagonal of the contingency table shows the results of marginal effect of probit model matching the husband and wife with the same education levels. In 2005, if the husband has university degree, the probability of wife with university degree will increase by 0.087. Similarly, for secondary and primary, the probability increases by 0.121 and 0.252. Comparing with the results in 2012, under the three-education level of assortative mating, the probability has increased (0.142, 0.181, 0.268).
In addition to focusing on educational homogamy, as the study of Eika et al. (Reference Eika, Mogstad and Zafar2019) did, we further developed our framework to explore educational hypergamy and hypogamy. The term educational hypergamy means that wives are less educated than their husbands, while hypogamy means wives are more educated than their husbands. Recent studies in the US have found a decrease in educational hypergamy and an increase in educational hypogamy [Schwartz and Han (Reference Schwartz and Han2014), Qian (Reference Qian2018)], which occurred shortly after wives' education exceeded husbands' education in the early 1990s in the U.S. [Schwartz and Mare (Reference Schwartz and Mare2005)].
However, Esteve et al. (Reference Esteve, García-Román and Permanyer2012) suggested that educational hypergamy is internationally prevalent, and has been decreasing over the last few decades in many countries like the US, Brazil, and France. They found that wives have more education than their husbands in most of the countries where the reversal of the gender gap in education occurs. Societies that have greater female educational advantages tend to have lower levels of educational hypergamy.
In Thailand, husbands still obtain higher education levels than their wives, which will give us a different picture of the pattern over time. In the current social setting, females prefer to practice hypergamy, which is prevalent in South Asia, in order to obtain a sense of security over their future [Saleem et al. (Reference Saleem, Chaudhry, Nasir and Riaz2015)].
Using the three educational attainment levels, educational hypergamy classifies into three categories:
(1) women with a primary level of education married to men with a secondary level of education;
(2) women with a primary level of education married to men with a university level of education; and
(3) women with a secondary level of education married to men with a university level of education.
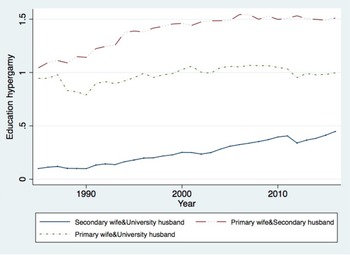
Considering the fact that the proportion of the population that obtained a primary education has decreased, and that marital sorting at that education level has decreased a lot over time (which is different from developed countries). In Figure 3, we check the marital sorting parameters of couples with different education levels. Our main finding was the indication of continued educational hypergamy in Thailand. We found that, during our period of study, women with lower education levels tended to marry spouses who were more educated. This was especially true for women with primary educations married to men with secondary educations, where the parameter exceeded random matching.
Trends in educational hypergamy mating for different educated couples.
Source: Authors' calculation.
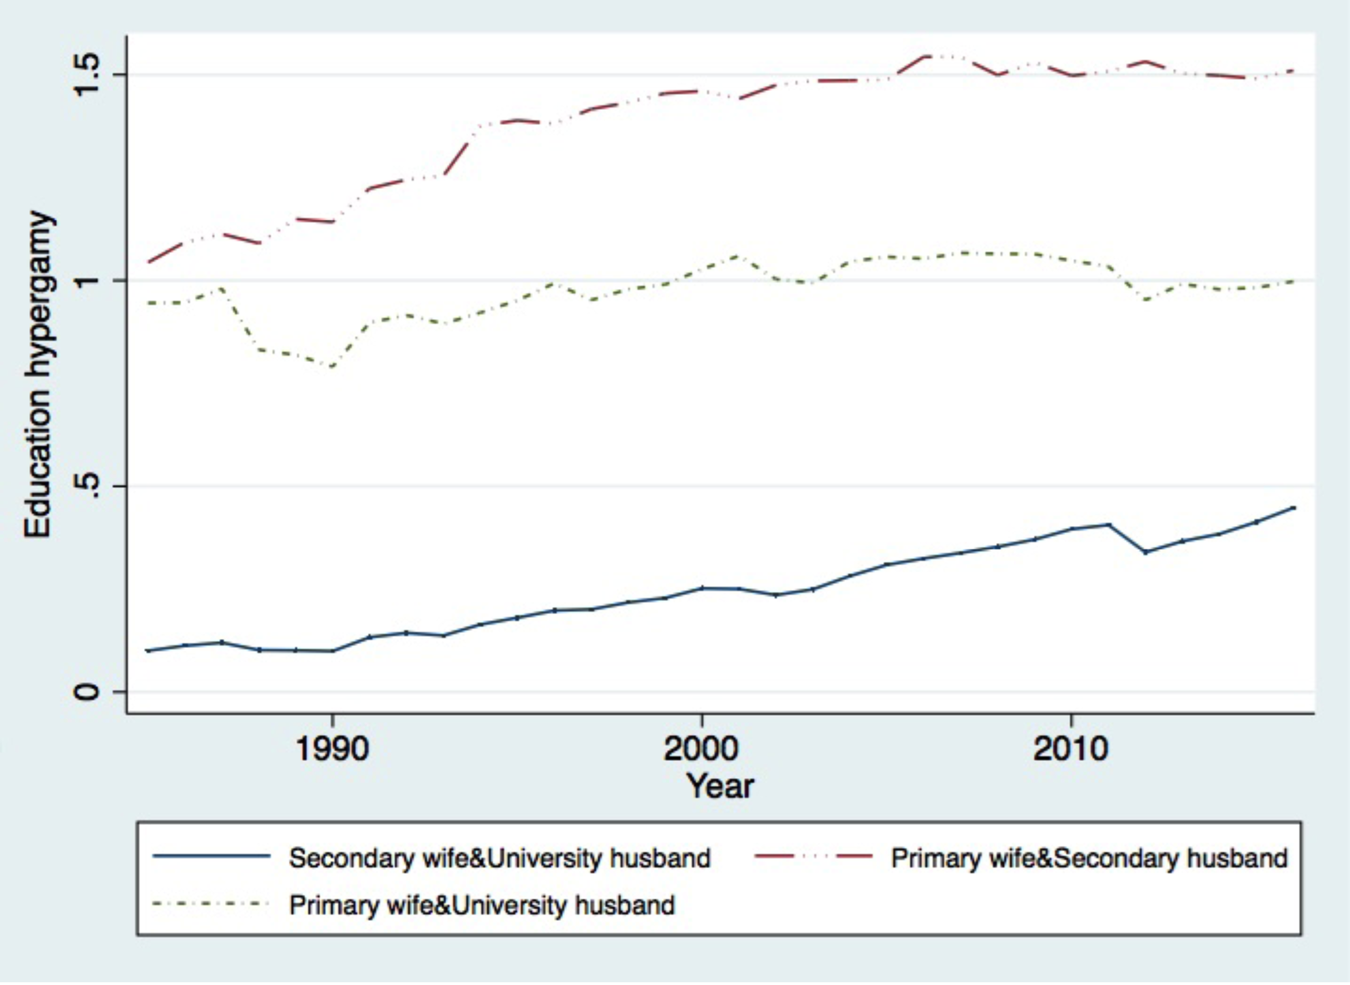
The proportion of women with a primary education married to men with a secondary education was close to random matching in 1985, while in 2016 it rose to become 1.5 times more than random matching. The proportion of women with a secondary level of education who married more highly educated spouses has shown an upward trend, but it is still below random matching. The proportion with a primary level of education married to spouses with a university degree had a relatively stable pattern, with a parameter around 1.
Then, to crosscheck the parameter computed in equation (1), we applied alternative estimations by using the years of education instead of educational level. The estimation procedure used equation (2), the regression of wives' (husbands') years of schooling on husbands' (wives') years of schooling.
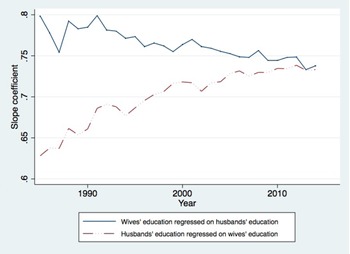
Figure 4 presents the trend of the coefficients, with the dashed line representing the influence of husbands' education on wives' education, and the solid line representing the reverse. The results show that the coefficient on wives' years of schooling decreased over time, while the coefficient on husbands' years of schooling rose over the same time period, indicating that an increase in husbands' education increases their wives' education more than it did decades ago, but that changes in wives' education affects their husbands' education less than before. These results could be explained by three main factors, as suggested by Olivo-Villabrille (Reference Olivo-Villabrille2017).
Estimates of the association between the educational attainments of spouses.
Source: Authors' calculation.

First, they may be caused by an increased preference for partners with a similar education level. In Thailand, we have seen an increase in this trend in more highly educated couples, but a decrease in the trend for primary educated couples. Second, there may have been an increase in the supply of higher-educated individuals in the marriage market during that time, which we have found in Thailand (Online Appendix Figure 3A). Finally, the increase in the propensity for individuals to marry more highly educated spouses may be the reason for the increase of the coefficient. This result is comparable to the educational hypergamy found earlier during the period of study.
5.2 The determinants of income inequality in Thailand
Using the framework of Eika et al. (Reference Eika, Mogstad and Zafar2019), where the counterfactual scenario for the group is constructed from the observed outcomes of the other groups, this section intends to measure the contribution of educational assortative mating to income inequality in Thailand. To perform the counterfactual scenario, we held the distribution of the variables that we intended to study fixed at the base year 1985. These included the marital sorting parameter, the return to education, and education composition, while we let the distributions of the others change over time. Under such conditions, we obtained a Gini coefficient and compared it with the actual specification in order to assess how household income inequality was affected by the changes in those factors.
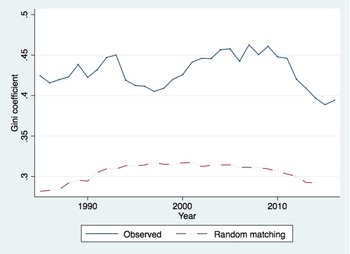
In order to compare assortative with random matching, we composed the counterfactual scenario assuming that the matching was random instead of educationally assortative. Figure 5 shows the actual and counterfactual scenario for the Gini coefficient over time. The actual Gini coefficient (solid line) is above the counterfactual scenario (dashed line), where husbands and wives were matched randomly, with the educational marital sorting parameter set equal to 1. For example, assortative mating drives the Gini coefficient upward, from 0.29 to 0.425 in 1990. This result suggests that assortative mating has led to an increase in household inequality, which has also been found in developed countries [Breen and Salazar (Reference Breen and Salazar2011), Eika et al. (Reference Eika, Mogstad and Zafar2019)].
Household income inequality and educational assortative mating.
Source: Authors' calculation.

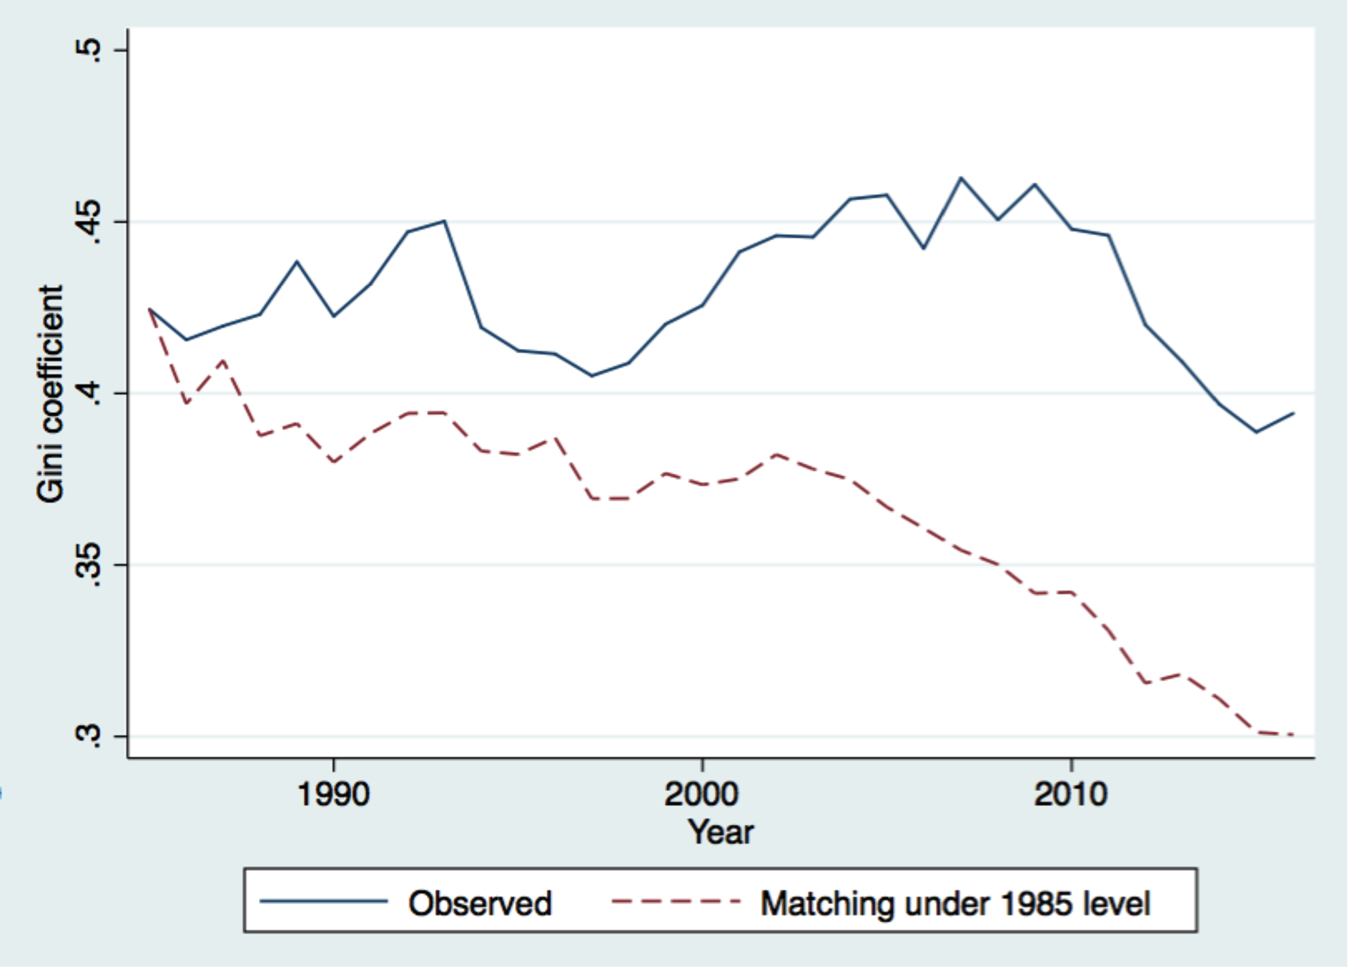
Figure 6 shows the counterfactual scenario, where married couples are matched under the 1985 marital sorting parameter. The increase of the actual specification suggests that changes in assortative mating over time mattered for the time trends in household income inequality. In 2000, for example, the Gini coefficient was supposed to be 0.37 in the absence of changes in educational assortative mating, compared to the actual Gini coefficient of 0.43. As previously found, the marital sorting parameter has decreased over time, and a negative association between income inequality and marital sorting with the same education has been found in this counterfactual experiment. This result contradicts many empirical studies e.g., Western et al. (Reference Western, Bloome and Percheski2008), Atkinson and Morelli (Reference Atkinson and Morelli2014), and Breen and Salazar (Reference Breen and Salazar2010), which indicated a positive relationship.
Household income inequality and changes in educational assortative mating.
Source: Authors' calculation.

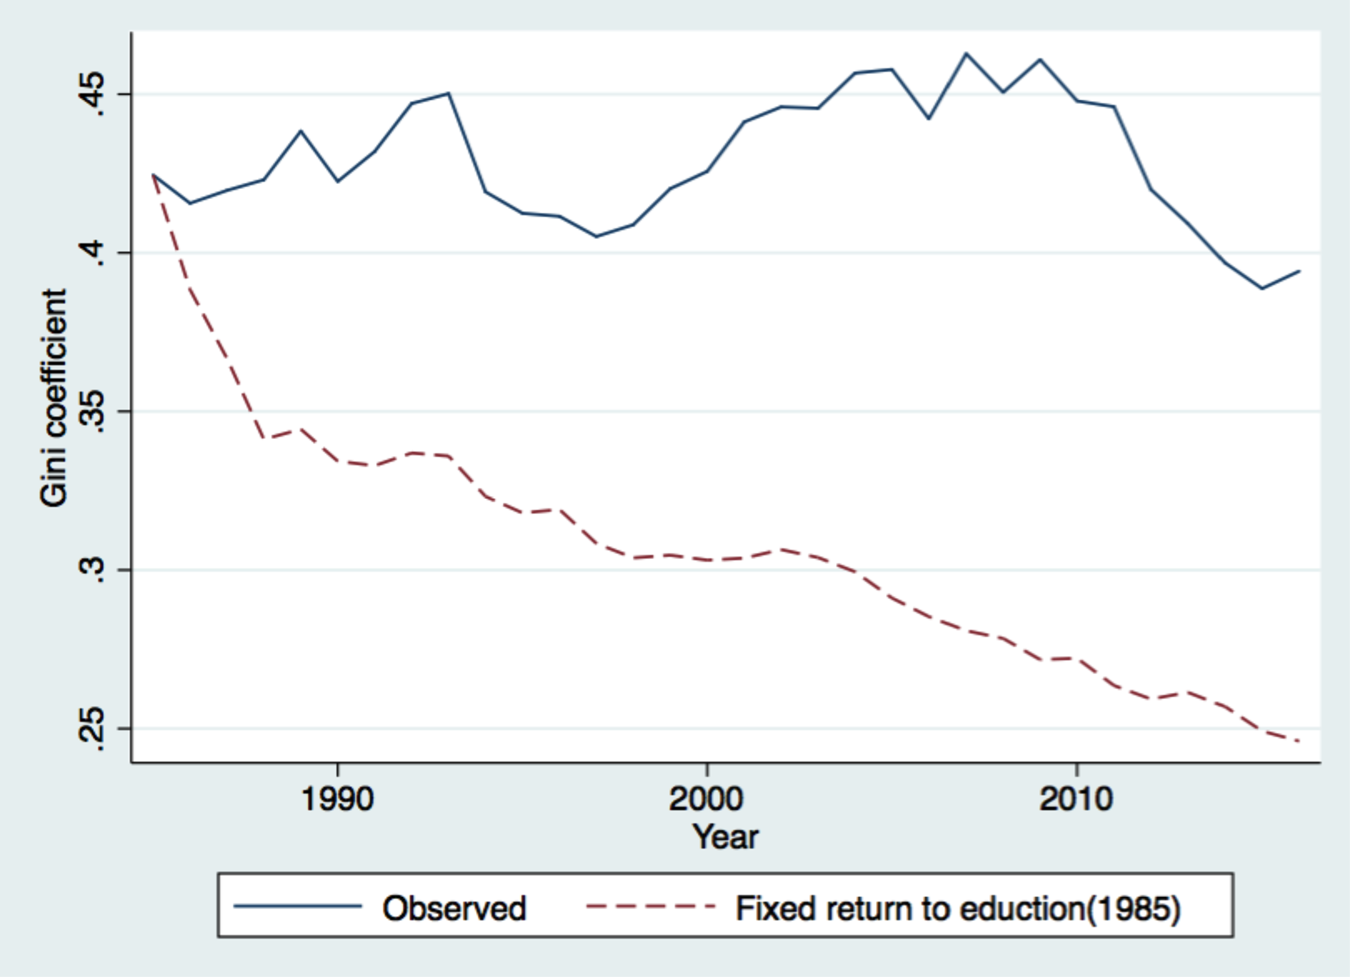
Figure 7 displays the counterfactual scenario where we fix the return to education at the 1985 level. The result suggests that increases in the return to education also played a role in the rise in household income inequality, indicating a positive relationship between return to education and household income inequality.
Household income inequality and changes in return to education.
Source: Authors' calculation.

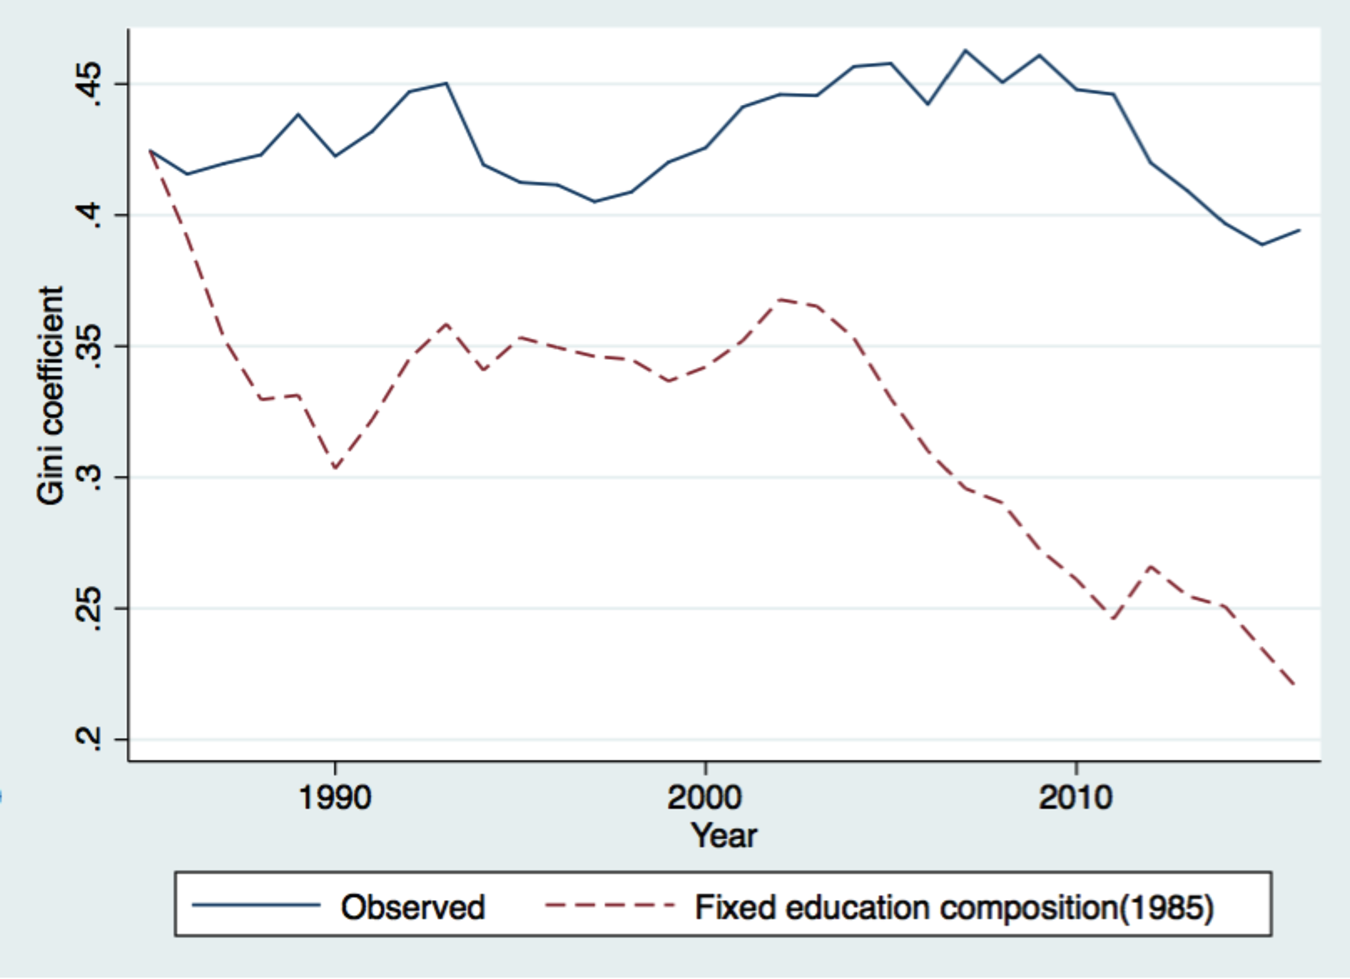
Similarly, Figure 8 shows the counterfactual scenario where education composition was fixed at the 1985 level. Increasing educational attainments, where the primary educated group has declined and the higher educated groups have increased over time, has an effect on household income inequality.
Household income inequality and changes in education composition.
Source: Authors' calculation.

6. Conclusion
This paper studied the extent of educational assortative mating and its role in determining household income inequality during 1985–2016 in Thailand. An important finding revealed that, despite the decreasing trend of educational homogamy overall, the trend varied by educational level. Educational homogamy has increased slightly for couples who obtained secondary and university education levels; but declined over time for those at the primary education level. We documented the increase of educational hypergamy in Thailand, particularly in women with a primary education who marry men with a secondary education.
To measure the contribution of educational assortative mating to income inequality, we followed the framework of Eika et al. (Reference Eika, Mogstad and Zafar2019), where the counterfactual scenario for the group was constructed from the observed outcomes of the other groups. The results of the counterfactual scenarios suggested that changes in household income inequality over time have been affected by educational assortative mating. In addition, the changes in educational assortative mating have increased the trend in household income inequality. A negative relationship between income inequality and marital sorting with the same education was found, which contradicts existing evidence in developed countries such as the US, Denmark, Germany, and the UK [Eika et al. (Reference Eika, Mogstad and Zafar2019)]. Finally, we found that an increase in education attainment, return to education, and education composition generated a rise in household income inequality as well.
In interpreting the results, while our study has provided detailed analysis on educational assortative mating and inequality, there are several caveats that should be pointed out. First, the difference of the variation between observed and counterfactual scenarios indicate that there might be other factors, such as individual preference, having effect on the inequality trends in Thailand. Second, as decomposition approach has been generally recognized as a descriptive method [Eika et al. (Reference Eika, Mogstad and Zafar2019)], we may not provide a rigorous causal interpretation or seek mechanisms resulting in the trends that we observe. Rather, our study contributes in the way of providing different factors to account for income inequality.
Conflict of interest
There are no conflicts of interest.
Supplementary material
The supplementary material for this article can be found at https://doi.org/10.1017/dem.2022.9.