I. INTRODUCTION
Pulsed laser induced dewetting has recently been shown to be a viable way to induce self-assembled pattern formation of metallic nanoparticles. The three dominant dewetting mechanisms include: (i) homogeneous nucleation, (ii) heterogeneous nucleation, and (iii) spinodal instabilities initiated by surface waves. The spinodal instability results in a characteristic length scale related to the original film thickness, the properties of the film, substrate, and gas ambient; thus it is suitable for forming spatially ordered metal nanoparticles. While historically several groups have investigated spinodal dewetting in polymeric thin films (e.g., Becker et al.Reference Becker, Grun, Seemann, Mantz, Jacobs, Mecke and Blosseya1), more recently, several investigations have focused on thin metal films dewetted via pulsed laser heating.Reference Bischof, Scherer, Herminghaus and Leiderer2–Reference Gedvilas, Raciukaitis and Regelskis9
Most recent works have focused on the behavior of elemental metal thin films on inert (nonreactive) substrates.Reference Bischof, Scherer, Herminghaus and Leiderer2–Reference Yasuhiko and Takahisa10 Bischoff et al. studied the dewetting of gold liquid metal films with a Q-swiched laser pulse and observed two coexisting mechanisms (nucleation of holes and spinodal dewetting) in 47 nm Au films on a fused silica substrate.Reference Bischof, Scherer, Herminghaus and Leiderer2 Henley et al. reported the dewetting behavior of a range of metals on silicon dioxide coated Si substrates and analyzed the radius of nanoparticles induced by the Rayleigh instability criterion.Reference Henley, Carey and Silva3 Kalyanaraman et al. have recently published a series of papersReference Trice, Thomas, Favazza, Sureshkumar and Kalyanaraman4–Reference Krishna, Sachan, Strader, Favazza, Khenner and Kalyanaraman8 describing the spinodal dewetting of various thin elemental films and have correlated the time and length scale of the spinodal instability using thin film hydrodynamic theory and have also shown the influence that temperature gradients (both lateral and in the film thickness) have on the growth modes. More recently, they also performed an energy analysis of the system and showed that the dispersion relation can be correlated to the minimization of competing capillary flow, viscous dissipation, and interface potential.Reference Krishna, Shirato, Favazza and Kalyanaraman7 Furthermore, they showed using their energy analysis that various dewetting morphologies could be understood.Reference Krishna, Shirato, Favazza and Kalyanaraman7, Reference Krishna, Sachan, Strader, Favazza, Khenner and Kalyanaraman8
In order to complement the recent work on pulsed laser induced thin film dewetting, we studied the dewetting dynamics of lithographically patterned thin nickel shapes,Reference Rack, Guan, Fowlkes, Melechko and Simpson11, Reference Fowlkes, Wu and Rack12 lines,Reference Kondic, Diez, Rack, Guan and Fowlkes13 and rings.Reference Wu, Fowlkes, Rack, Kondic and Diez14 Here we present results on the role of alloy composition on the dewetting behavior of thin metal films on Si substrates. Ultrathin Cu-Ni alloys (<8 nm) with different alloy compositions were chosen in this study because of their extended solubility and unique magneto-optical properties. This work complements a recent study demonstrating the surface enhanced Raman response of annealed and laser dewetted gold nanoparticles.Reference Lin, Jiang, Zhou, Xiao, Chen and Tsai15 To our knowledge, this is the first investigation comparing the pulsed laser induced dewetting of an alloy thin film. Recently, Kalyanaraman et al.Reference Krishna, Favazza, Gangopadhyay and Kalyanaraman16 showed that pulsed laser induced dewetting of bilayer Ag/Co thin films on silicon dioxide resulted in nanoparticles with short range order. Because the Ag-Co binary system is immiscible, the individual nanoparticles contained regions of pure Ag and Co.
Here we investigate the dewetting characteristics of the classic Cu-Ni isomorphous binary solid-solution alloy system. We initially describe the fundamental dewetting properties of the Cu-Ni alloys, and subsequently the optical properties of the thin films and dewetted nanoparticles are presented. In order to demonstrate the effect of the alloy composition, a deliberately broad range of compositions (copper content of 81, 49, and 21 vol %) was chosen. Additionally, to correlate the optical properties of the resultant nanoparticles, three film thicknesses were investigated which, as will be demonstrated, result in different nanoparticle size distributions. A 25 ns 248 nm KrF excimer laser (LPX300 Excimer laser, Lambda Physik, Lambda Physik GmbH, Göttingen, Germany) was used to irradiate the films. The fast laser pulse can rapidly melt the film, which can have nanosecond liquid lifetimes under these conditions, and therefore the laser pulse can minimize interfacial diffusion and surface reactions as well as reduce evaporation that could otherwise occur when annealing for longer times in the solid-state.
II. EXPERIMENT
Copper and nickel were cosputtered using radio frequency (RF) magnetron sources to form Cu-Ni alloy films with a volume percentage of Ni ranging from ~20 < Ni% < 80 along the diameter of a 100 mm silicon (100) wafer.Reference Klein, Melechko, Rack, Fowlkes, Meyer and Simpson17 The measured sputtering rates at the center of the substrate were 1.4 nm/min and 1.35 nm/min for Cu and Ni, respectively, using the following sputtering conditions: 5 cm diameter sputter targets and a Ni power = 40 W (238 V self bias), Cu power = 30 W (148 V self bias), 25 sccm Ar-H2 (5%) at 5 mTorr processing pressure. Using these sputtering conditions, three Cu-Ni alloy films with different thickness were sputtered on both quartz and silicon substrates by setting the sputtering time to 1, 2, and 4 min. No effort to remove the native oxide layer on Si wafers was performed before sputtering. Each wafer was then diced into nine pieces (~5 mm × 11 mm) along the composition gradient and the film thicknesses were measured via reflectometry (Filmetrics F20-UV thin-film analyzer, Filmetrics, Inc., San Diego, CA).
Two groups of films were subsequently laser treated and analyzed. The first group included five samples deposited on the Si substrate (representing various Cu-Ni compositions and different thicknesses): 1-49, 2-81, 2-49, 2-21, 4-49, where the first number stands for sputtering time (1, 2, or 4 min) and the second number corresponds to the estimated copper concentration (vol %). The second group included films sputtered on quartz substrates and consisted of samples (using a similar nomenclature): 1-81, 1-49, 2-81, 2-65, 2-49, 2-21, 4-81, 4-65, 4-49, and 4-21. The film compositions were calculated by the determined sputtering rate and confirmed by wavelength dispersive x-ray spectroscopy (WDX) measurements. Table I summarizes the compositions and the measured thicknesses of the two group of samples. The normalized thickness and composition of the Cu-Ni sputtered films estimated from a sputtering model developed for our systemReference Fowlkes, Fitz-Gerald and Rack18 is also shown in Table I.
Dewetting data of Cu-Ni alloy films.

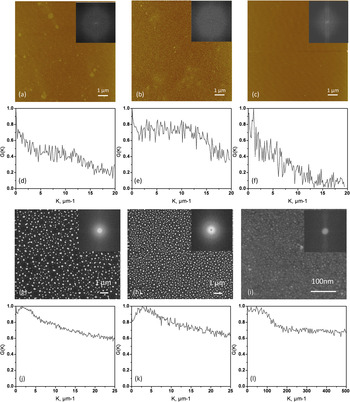
The films were irradiated in atmosphere by a normal incident laser beam (8 mm × 9 mm) with film centers located at the center of the laser beam. A KrF (krypton fluoride) laser with a 5 Hz repetition rate and ~25 ns (full width at half maximum) Gaussian temporal profile and 248 nm wavelength was used. The laser energy density was chosen by simulated time-temperature profiles to be above the melting threshold energy and in this case was 420 mJ/cm2 and 160 mJ/cm2 for films on Si and quartz, respectively. Importantly, the peak temperature is not constant for the films as both composition and film thickness affect the time-temperature profile of the laser treated films. For the dewetting mechanism discussed below, the resultant particle size has been shown to be independent of the peak temperature (for a 500 K range) for films processed above the melt threshold.Reference Trice, Thomas, Favazza, Sureshkumar and Kalyanaraman4 We have simulated the temperature range of pure copper and pure nickel films on quartz and silicon at the specific laser fluence and the peak temperatures range from 1960–1740 K (copper on silicon), 1965–1731 K (nickel on silicon), 1215–1989 K (copper on quartz), and 1330–1953 K (nickel on quartz). The simulations on quartz assumed a 160 mJ/cm2 fluence and the simulations on silicon assumed a 420 mJ/cm2 fluence; the first temperature listed is for a simulated film thickness of 2 nm and the second temperature of the range is for an 8 nm film thickness. From the simulations, the 2 nm films of both copper and nickel on quartz are estimated to be below the melt threshold; thus the liquid state spinodal dewetting process may not be operative here. In order to obtain fully developed nanoparticles, two laser pulses were applied to all films except for samples 2-21 and 4-49 on silicon which were irradiated with 5 and 25 pulses, respectively. As will be described later (Section III A), the larger number of pulses required for sample 2-21 is likely associated with the higher melting temperature of nickel and for 4-49 due to the longer spinodal time scale for thicker films. As has been discussed previously, liquid-phase transport dominates the dewetting behavior, thus individual pulses are essentially additive and contribute to the cumulative liquid lifetime.Reference Favazza, Kalyanaraman and Sureshkumar19 In order to confirm that the resultant nanoparticle size distribution was not correlated to the original surface roughness, an initial series of pure nickel films was grown and the as-deposited surface roughness was measured and compared to the resultant nanoparticle distribution. Figure 1 shows as-deposited atomic force microscopy (AFM) scans of the (a) 8 nm, (b) 4.5 nm, and (c) 2.5 nm nickel films which resulted in surface roughnesses of 0.56, 0.76, and 0.21 nm, respectively. The insets of Figs. 1(a)–(c) show the fast Fourier transforms (FFT) of the measured surface roughness and Figs. 1(d)–(f) show the radial distribution functions of the FFTs of each film. Figures 1 (g)–(i) show scanning electron micrographs of the resultant laser treated nickel films at the comparable thicknesses with the FFT of each image as an inset. Finally, Figs. 1(j)–(l) shows the radial distribution functions of the FFTs from the scanning electron micrographs of the nickel nanoparticles from Figs. 1 (g)–(i). Consistent with Favazza et al.,Reference Favazza, Trice, Krishna and Kalyanaraman20 the surface roughness length scale and nanoparticle length scale do not correlate; thus the ordered nanoparticle spacing observed and discussed below (Section III A) is attributed to a spinodal dewetting mechanism induced by random surface perturbations.
Atomic force microscope images of (a) 8 nm, (b) 4.5 nm, and (c) 2.5 nm thick nickel films with an inset of the FFT of the image. (d)–(f) Radial distribution function of the FFT of the AFM images. (g)–(i) SEM images of the resultant nickel nanoparticle distributions of the laser treated (g) 8 nm, (h) 4.5 nm, and (i) 2.5 nm thick nickel films. (k)–(l) Radial distribution functions of the FFT insets from the SEM images demonstrating that the surface roughness is not correlated to the nanoparticle spacing. (note different scale for (i) and (l).

III. RESULTS AND DISCUSSION
A. Dewetting pattern on Si as a function of film composition and thickness
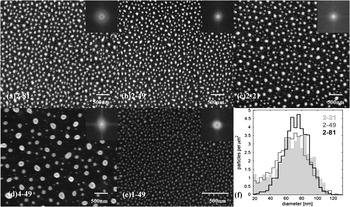
Figure 2 shows scanning electron microscope (SEM) images of sample 1-49, 2-81, 2-49, 2-21, 4-49, after laser irradiation. The resultant particles are pseudospheres sitting on the Si substrate with a contact angle θC that can be described by Young’s equation,

SEM micrographs for the final stages of (a) 81%Cu-19%Ni alloy/Si (film thickness: 4.4 nm), (b) 49%Cu-51%Ni alloy/Si (film thickness: 3.9 nm), (c) 21%Cu-79%Ni alloy/Si (film thickness: 3.4 nm), (d) 49%Cu-51%Ni alloy/ Si (film thickness: 7.4 nm), (e) 49%Cu-51%Ni alloy/Si (film thickness: 2 nm), (f) diameter distribution of three films: 4.4 nm with 81%Cu-19%Ni, 3.9 nm with 49%Cu-51%Ni, and 3.4 nm with 21%Cu-79%Ni. The inset in (a)–(e) are the power spectrum of the related FFTs.

where γSV is the solid-vapor interfacial energy (surface energy), γSL denotes the solid-liquid interfacial energy, and γ is the liquid-vapor energy (the surface tension). The resultant SEM images were analyzed to determine the particle size distribution (using Image J software) which is demonstrated in the histogram shown in Fig. 2(f). The FFT spectrum (see inset of SEM images in Fig. 2) reveals the characteristic periods of each SEM image and was used to determine the particle spacing. The resultant average particle diameters and spacings are summarized in Table I. Some data on the quartz substrate could not be determined due to charging in the SEM.
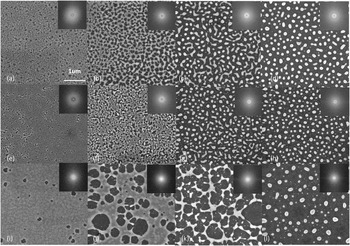
For the ultrathin Cu-Ni alloy films studied here, the dominant dewetting mechanism was suspected to be a spinodal process because both pure Cu and pure Ni thin films (ranging from 3 nm to 11 nm) break up via amplification of surface instability waves (spinodal instability) as observed in the pattern evolution in Fig. 3. In order to help understand the dewetting behavior of the alloy films, it is necessary to understand the dewetting behavior of pure metal films with equivalent thickness first. Figures 3(a)–(d) and Figs. 3(i)–(j) show the dewetting pattern evolution with increasing melt duration of a 7.5 nm pure Cu film and a 7.7 nm pure Ni film. These images were taken as a function of the radial position of the laser beam near the edge of the laser which represents a steep fluence gradient and thus a variable liquid lifetime. Initially, both films break up via the formation of small holes. While more holes appear and grow in size, continuous polygonal structures are formed which are due to the coalescence of the rims from adjacent holes. As also observed in other studies,Reference Trice, Thomas, Favazza, Sureshkumar and Kalyanaraman4, Reference Seemann, Herminghaus and Jacobs21 the correlation of the hole positionReference Trice, Thomas, Favazza, Sureshkumar and Kalyanaraman4 (revealed by observing a ring in the Fourier transform of the image) and uniform polygonal size indicate a dominant wavelength spreading along the liquid thin film induced by the spinodal instability. However, two clear and interesting observations of the images show a different length scale of the initial patterns in the Cu and Ni films.
(a)–(d) Dewetting pattern evolution of a 7.5 nm Cu film on an Si substrate as a function of liquid duration time. (e)–(h) Dewetting pattern evolution of a 7.5 nm 49%Cu-51%Ni film on an Si substrate as a function of liquid duration time. (i)–(j) Dewetting pattern evolution of a 7.7 nm Ni film on an Si substrate as a function of liquid duration time. The inset at each corner is the corresponding FFT power spectra.

First of all, note that both the distance between neighboring holes and the resultant polygonal size formed on the Cu film is significantly smaller than on the equivalent Ni film. Another observation is that a clear surface perturbation already appears on the whole Cu surface between the initial holes where the propagation of the surface wave reaches the substrate, while no clear surface wave can be observed on the Ni film at this initial state. This suggests a much smaller characteristic length scale of the initial perturbation and thus a possibly larger Hamaker coefficient for the liquid copper film relative to the liquid nickel induced as governed by the interface potential of the air-liquid and liquid-substrate interfaces. Once the surface perturbation grows and reaches the substrate, the hole consequently retracts via a balance of the relevant capillary, viscous, and inertial forces,Reference Krishna, Shirato, Favazza and Kalyanaraman7 and forms polygonal rivulets. The resultant particle size and distribution is a function of the subsequent break-up and transport of the rivulet network.Reference Krishna, Sachan, Strader, Favazza, Khenner and Kalyanaraman8 For the nickel films, the vertices accumulate the liquid and cause a breakup analogous to a pearling processReference González, Diez, Gratton and Gomba22 which can create secondary smaller particles between the vertices. For thicker films, and larger rivulet bridges, the rivulet can break up via a Rayleigh-Plateau instability which is modified by the substrate.Reference McCallum, Voorhees, Miksis, Davis and Wong23 For the shorter copper rivulet breakup, the network forms a bicontinuous network of rivulets which subsequently break up and form the nanoparticle array. Clearly, the final nanoparticle size and spacing is initially set by the spinodal wavelength of the holes and the subsequent competition between capillary-induced transport of the rivulets and the Rayleigh-Plateau or pearling-type instability.
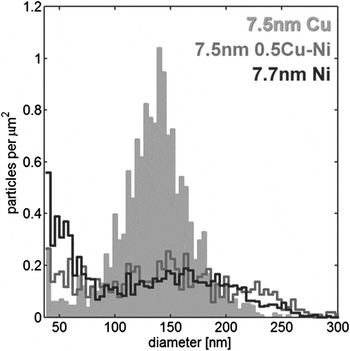
As a result of the different pathways for the morphology evolution, Ni films result in a larger spacing and larger size of primary particles and forms more small secondary particles as well relative to the Cu film (resulting in a bimodal distribution). The final particle distribution is shown quantitatively in Fig. 4. The dewetting process of films with thickness between 2 nm and 8 nm is assumed to be similar to the ~7.5 nm films and thus it is expected that the alloy films in this work follow the basic process of spinodal dewetting in pure metals but modified by alloy composition due to the different spinodal length scales.
Particle diameter distribution of three films: 7.5 nm Cu on an Si substrate, 7.5 nm 49%Cu-51%Ni on an Si substrate, and 7.7 nm Ni on Si substrate.

Figures 3(i)–(j) show the pattern evolution of the 7.5 nm 49%Cu-51%Ni alloy film (sample 4-49). Interestingly, this alloy composition shows pattern evolution attributes associated with both the pure copper and nickel films. The initial hole distances are comparable to the hole distance of the Cu film; however, the SEM image does not show an obvious perturbation wave on the alloy film surface between the initial holes which is similar to the pure Ni film. More exhaustive correlations between the dewetting pattern evolution as a function of composition will be investigated in the future, but it appears that the dewetting dynamics can be controlled by varying the film composition.
Hence, based on the characteristic pathway of pattern evolution and the resultant final distribution of nanoparticles in pure Cu and Ni film, we expect that one can tune the dewetting pattern of an alloy film by controlling alloy composition. As can be seen from Table I, the distribution of the nanoparticles formed on samples 2-81, 2-49, and 2-21 results in a very similar average diameter D (66-73 nm) and particle spacing S (~160 nm). However, the size distributions are clearly different for the different alloy compositions as demonstrated in the plot of the nanoparticle size distribution frequency in Fig. 2(f). It shows the Cu rich side (2-81) has a more uniform particle size compared to the Ni rich side (2-21) which has a larger range and possibly a bimodal size distribution (demonstrated more clearly in the image). Intuitively, one would expect that the metal with a higher percentage in the alloy would dominate the dewetting process and the characteristic final pattern. On the other hand, it is noted that the spacing between particles is quite similar for different film compositions. As pointed out by other studies,Reference Trice, Thomas, Favazza, Sureshkumar and Kalyanaraman4–Reference Krishna, Sachan, Strader, Favazza, Khenner and Kalyanaraman8 the spinodal dewetting only represents the initial stage of film breakup; once the polygonal or bicontinuous patterns are formed, the subsequent dewetting is dictated by other mechanisms and thus the convolution of nanoparticle spacing is complex.
Next we compare the results from samples 4-49, 2-49, and 1-49 in Table I to see the influence of initial film thickness on the particle size and spacing. According to TFH theories, the characteristic spinodal length Λ can be expressed as a function of film thickness (h) asReference Trice, Thomas, Favazza, Sureshkumar and Kalyanaraman4:

where γ is the surface tension of the metal and A is the Hamaker coefficient. As described, it is reasonable to suggest the final spacing between particles is proportional to spinodal length Λ as the spacing = aΛ, where a is a proportionality factor, thus the final particle spacing is correlated to the initial spinodal length scale.
Furthermore, the spinodal time scale related to this characteristic spinodal length Λ is obtained as τD = (96 π3γηh 5)/A 2.Reference Trice, Thomas, Favazza, Sureshkumar and Kalyanaraman4 This result predicts that the spinodal timescale is proportional to h 5, which means the thicker film may need a longer melting time (pulse number) to initiate the spinodal dewetting process.
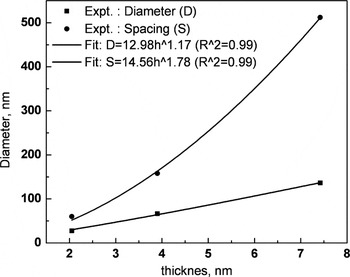
It is shown via a conservation of mass,Reference Trice, Thomas, Favazza, Sureshkumar and Kalyanaraman4 that for spinodal dewetting on SiO2 substrates, the average particle diameter (D) can be given as D ∝ h 5/3 based on volume conservation (assuming no mass loss during laser treatment). In Fig. 5(c), we plot the particle spacing and average diameter as a function of film thickness (solid circle) and the power law fit yields a correlation as spacing S = 17.56 h 1.67 and D = 11.76 h 1.235. The offset for our results on the Si substrate is reasonable considering two factors. The first factor is the different dewetting mechanism following the spinodal breakup, such as Rayleigh-like breakup which has a spacing correlation of ∝ S h½.Reference Kondic, Diez, Rack, Guan and Fowlkes13 Another point that may affect the nanoparticle diameter is the mass loss during laser processing due to evaporation and/or diffusion into the substrate when the films are on a Si substrate. In order to estimate the mass loss, we have calculated the cumulative volume of the nanoparticles by performing image analysis of the plane-view nanoparticle radius (r) size distribution of selected areas of the SEM images and summing the individual calculated nanoparticle volumes (V) from the expression V = π(r/sinθ)3(2 – 3cosθ – cos3θ), where θ is the wetting angle. We have estimated a mass loss of ~30% for films on silicon; whereas for laser dewetted films on silicon oxide, virtually no mass loss has been measured. While one would expect preferential mass loss of copper by both mechanisms because the copper diffusion coefficient is larger than the nickel diffusion coefficient; and because copper’s vapor pressure in the relevant temperature ranges are higher, WDS measurements before and after laser treatment yielded comparable stoichiometries. This, however does not unequivocally determine that the bulk is not somewhat depleted in copper because the probe depth of the WDS is well into the silicon; thus any preferential copper diffusion could not be distinguished.
Analysis of the length scales in the final nanoparticle distribution as a function of film thickness: the average nearest-neighbor spacing S of nanoparticles (solid circles) and the average nanoparticle diameter D (solid squares) for Cu-Ni alloy films. The fits use the power function and the R 2 in each graph indicate the correlation coefficient of the least-squares fitting.

B. Optical measurement and analysis
In order to investigate the functionality of the alloyed and pulsed laser assembled nanoparticles, the optical properties of the films before and after pulsed laser treatment were investigated. Transmission and reflectance spectra measurements were made in air from 300 to 900 nm (4.1–1.377 eV) at room temperature using an Ocean Optics HR2000 + spectrometer (Ocean Optics, Dunedin, FL). A bare quartz sample was used as a reference and the absorption or extinction was corrected for the substrate effects.
Metallic nanoparticles surrounded by a dielectric medium have attracted significant attention due to their unique optical effects including surface plasmon resonance (SPR) absorption. SPR is the oscillation of free (conduction) electrons inside a metal particle excited when the wavelength of incident light is equal or close to the plasmon resonance frequency of the particle. Au, Ag, and Cu are the most widely used metals that support plasmon resonance in the UV-visible region. However, compared to Au and Ag, much less effort has been devoted to understanding the plasmonic properties of Cu due to the tendency of surface oxidation that can affect the optical properties. Since Cu is the most widely used metal in electronic devices with high conductivity and low cost, it is valuable to study the tuning and control of its SPR peak when alloyed with Ni and covered with a thin native oxide layer. The plasmon excitation wavelength of nickel has been calculated and experimentally observed to be approximately 400 nm.Reference Amekura, Takeda and Kishimoto24, Reference Picciotto, Pucker, Torrisi, Bellutti, Caridi and Bagolini25 Previous studies have shown that the intensity, peak width, and peak wavelength of SPR dramatically depends on the dielectric environment, particle size, and geometry, as well as the dielectric function of the particle material. For an alloy material, the SPR peak is expected to shift as a function of the alloy composition. In this section, we briefly investigate the plasmonic behavior of the Cu-Ni nanoparticles synthesized with via pulsed laser dewetting which have a fixed dielectric medium environment with different alloy concentration and particle size.
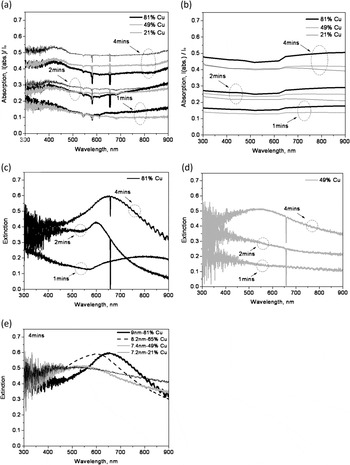
Firstly, the absorption of the original Cu-Ni thin films were measured to compare to the laser dewetted assembled nanoparticles. Figure 6(a) is a plot of the measured absorption efficiency of various Cu-Ni thin films with different compositions and thicknesses deposited on quartz. The films show a relatively flat absorption from 500 nm to 900 nm. A weak absorption feature appears at 400–500 nm for all samples.
(a) Experimental absorption spectra of Cu-Ni alloy as-deposited films. (b) Calculated absorption spectra of Cu-Ni alloy films with equivalent film thickness and alloy composition (81 vol % Cu, 49 vol % Cu, 21 vol % Cu). (c) Extinction spectra of 81 vol % Cu alloy nanoparticles dewetted from 2 nm, 4.4 nm, and 9 nm Cu-Ni films. (d) Extinction spectra of 49 vol % Cu alloy nanoparticles dewetted from 2.5 nm, 3.9 nm, and 7.4 nm Cu-Ni films. (e) Extinction spectra of 81 vol % Cu, 65 vol % Cu, 49 vol % Cu, and 21 vol % Cu alloy nanoparticles dewetted from 9 nm, 8.2 nm, 7.4 nm, and 7.2 nm Cu-Ni films, respectively.

In order to compare the measured spectra, the absorption spectra of Cu-Ni films with equivalent film thickness (2 nm, 2.5 nm, 3.4 nm, 3.9 nm, 4.4 nm, 7.2 nm, 7.4 nm, and 9 nm) and copper compositions of 81, 49, and 21 vol % were generated using the Beer–Lambert law:

where α is the absorption coefficient of the alloy whose effective medium was approximated by the volume fraction of the alloy and x is the film thickness. Since copper is prone to oxidization, the absorption of a 1 nm Cu2O film was also considered (not shown). We estimate that the thickness of Cu2O is close to or less than 1 nm using an oxidation rate of Cu of ~0.03 nm/day.Reference Chan, Zhao, Hicks, Schatz and Van Duyne26 The calculated spectra of the alloys without an oxide layer are plotted in Fig. 6(b), and they show good agreement with the measured spectra. Comparison of Figs. 6(a) and 6(b) shows that there is no clear peak in the as-deposited thin film alloy spectra, thus the observed small peak at ~440 nm is likely attributable to a thin Cu2O which has higher absorption at short wavelength range and a small peak at ~440 nm. Thus the main difference between the measured and calculated spectra between 400 to 500 nm is likely due to Cu2O absorption. Additionally, the band absorption of Cu and Cu2O may also contribute to this weak peak. The reported absorption band for Cu and Cu2O are both around 2.1 eV (590 nm) with only 0.1 eV difference.Reference Amekura, Takeda and Kishimoto24, Reference Liu, Liu, Mu, Yang, Shao, Zhang, Lu, Shen and Fan27, Reference Ghodselahi, Vesaghi and Shafiekhani28 While the optical gap of the thin film here is difficult to determine, the blue shift of band gap absorption to ~480 nm may be caused by the quantum confinement effect which was also observed by Liu et al. and Yang et al.Reference Liu, Liu, Mu, Yang, Shao, Zhang, Lu, Shen and Fan27, Reference Yang and Zhu29 However, further analysis such as time dependent optical measurements (to correlate to the copper oxidation) or careful chemical analysis is needed to confirm this assignment. Comparing Figs. 6(a) and 6(b) shows some expected trends in both the film thickness and increasing copper concentration. Of course the absorption spectra all increase with increasing film thickness and are very sensitive at these thicknesses because of the high absorption coefficient of both materials. For the ~2 and 4 nm thick films, the trend in the increased absorption in the long wavelength region (>650 nm) is consistent with increasing copper concentration.
For the optical properties of the dewetting formed nanoparticles, two series of results are presented and analyzed in this study. The first group includes four samples of 4 min-sputtered samples: 4-81, 4-65, 4-49, and 4-21. This series reveals the composition influence on the nanoparticle optical response. The second group compares the response of the Cu 81 vol % Ni 19 vol % (1-81, 2-81, and 4-81) and Cu 49 vol % Ni 51 vol % (1-49, 2-49, 4-49) samples, which reveal the effect that different nanoparticle sizes have on the plasmonic behavior.
1. Optical performance with different alloy concentrations
The extinction spectra of copper-rich Cu-Ni nanoparticles in the 4 min series (~8 nm thick), which have an average particle diameter of ~130 nm with a ~240 nm size distribution range, are shown in Fig. 6(e). Table I shows that the difference in the average diameter between these four samples is less than 5%; however, it is important to note that for these films, the final size distribution range is very similar as determined via SEM image analysis. This is contrary to what we observed for the films dewetted on silicon, which yielded very different dewetting characteristics (see Figs. 3 and 4). This is likely due to the different surface energy and Hamaker coefficients of the films on quartz relative to the films on Si. Thus we attribute the shift in the SPR peak position and shape to the alloy composition. The influence that the nanoparticle size and distribution have on the SPR is discussed in the following paragraph (sec. III. B. 2). The four samples have absorption peaks of: 4-81, 653 nm; 4-65, 600 nm; 4-49, 550 nm; and 4-21, 516 nm. The peaks for 4-81 and 4-65 with higher Cu concentration have much higher intensity and narrower width, while the peaks for 4-49 and 4-21 are very broad and weak. According to previous reports,Reference Zhang, Liu, Wang and Ming30, Reference Magruder and Wittig31 alloys (particularly solid solutions) typically have one single SPR absorption peak that is an intermediate of the two individual resonance peaks indicative of each element, and the peak position is dependent upon the elements and their relative concentration. It can be seen that although the results are likely perturbed by a thin oxidation layerReference Picciotto, Pucker, Torrisi, Bellutti, Caridi and Bagolini25 the surface plasmon peak has been effectively tuned over a 100 nm wavelength by alloying with Ni. The blue shift can be attributed to the decrease of the real part of dielectric function ε1 of the alloy when the amount of Ni increases according to the well known criterion for SPR [ε1 = 2(n d)2],Reference Amekura, Takeda and Kishimoto24 and the depression of the SPR peak could stem from the significant increase of the imaginary part ε2 because the intensity of SPR peak is inversely related to ε2.
2. Optical performance with different nanoparticle sizes
Figures 6(c) and 6(d) show the extinction spectra of the 81 vol % Cu (19 vol % Ni) sample series and 49 vol % Cu (51 vol % Ni) sample series, respectively. The average nanoparticle diameter of particles on the quartz samples trended slightly smaller than the particle size on the Si substrate. In summary, the average diameter and size distribution is estimated from SEM images as follows: ~130 nm with a ~240 nm distribution range for the 4 min samples, ~45 nm with a ~100 nm distribution range for 2 min samples, and ~20 nm with a ~40 nm distribution range for 1 min samples. We can see from Fig. 6 that the peak generated by smaller particles in sample 2-81 blue-shifts to ~602 nm and the peak is smaller and narrower compared to sample 4-81. It is well known that for larger particles (as for sample 4-81) beyond the Rayleigh approximation, the dipolar resonance appears to red-shift as well as to undergo substantial broadening, because the conduction electrons do not all move in phase. On the other hand, the depression of the peak for sample 2-81 may be attributed to the additional scattering of conduction electrons by the particle surface, which can increase the damping frequency by decreasing the mean free path of free electrons. In addition, the larger particle size distribution range in 4-81 can also contribute to the broadening of the SPR peak.
An important difference between our dewetting formed nanoparticles and most other reported nanoparticles used in SPR study is the particle shape and size distribution. Unlike generally used spherical nanoparticles embedded in either uniform or mixed dielectric medium, the nanoparticles studied here are spherical caps sitting on a quartz substrate with a certain contact angle which is ~70° as discussed earlier and have a wide distribution of diameter. On the one hand, a certain contact angle results in a particle height (h) to diameter (D) ratio: h/D = (1 – cosθ)/2sinθ, which is ~0.35 for θ = 70° (e.g., for a particle with 160 nm diameter, the height is ~56 nm). The dipole plasmon resonance is dependent on the particle shape and the height to diameter ratio, which makes the determination of SPR peaks more complex. On the other hand, the nanoparticle size distribution likely broadens the peak and additionally complicates the exact determination of the the plasmon peak. Our results, however, qualitatively agree with the work of Yang and Zhu,Reference Yang and Zhu29 which studied the tuning of SPR peaks by varying the height/diameter ratio of Cu nanoparticles with similar height/diameter ratio scale on a glass substrate with dimensions on the same order of magnitude as presented here. Consistent with our results, they observed a red shift in the copper plasmon peak (from ~670 nm to ~760 nm) with decreasing particle height from ~70 nm to ~20 nm at a fixed diameter (390 nm), and a blue shift from ~600 nm to ~260 nm at a fixed particle height (50 nm).
For the 50% Cu samples, as discussed above, a broad peak appears at ~550 nm for sample 4-49. However, no peak is observed for 2-49 and 1-49. Apparently the peak at the lower copper concentration is already weak and thus it is suspected that the plasmon peaks in sample 2-49 and 1-49 may be totally quenched due to higher damping frequency in smaller particles.
IV. CONCLUSIONS
The dewetting behavior of Cu-Ni alloy system on Si substrate was investigated and the optical properties of the as-deposited versus the pulsed laser assembled nanoparticle arrays were compared as a function of the Cu-Ni concentration. It was demonstrated that the nanoparticle size distribution and spacing is controlled by varying alloy composition and as-deposited film thickness. Pure thin Cu and Ni films show a different spinodal length scale and dewetting evolution. Subsequently, the dewetting of the alloy varies with the alloy composition. By varying the alloy composition and the as-deposited thickness, the surface plasmon resonance of the nanoparticle array assembled via pulsed laser dewetting could be tuned. Thus pulsed laser dewetting of alloy films has the potential to tune the nanoparticle size distribution and realize interesting optical responses in various applications. While the distribution of nanoparticle size and spacing is a natural consequence of the dispersion relation governing the spinodal dewetting process, future work will be performed investigating the plasmon resonance of dewetted lithographically patterned films with programmed instabilities and for directed assembly of the nanoparticles.
ACKNOWLEDGMENTS
The authors acknowledge support from the Material Sciences and Engineering Division Program of the DOE Office of Science (ERKCM38) for sponsoring the aspects of this work related to understanding the fundamental mechanisms operative during liquid phase, thin film dewetting. PDR also acknowledges support from the Sustainable Energy and Education Research Center at the University of Tennessee who supported the optical properties study portion of this research. The authors also acknowledge that the lithography and electron imaging results reported in this article were conducted at the Center for Nanophase Materials Sciences, Oak Ridge National Laboratory, and sponsored by the Scientific User Facilities Division (SUFD), Office of Basic Energy Sciences (BES), United States Department of Energy. The authors gratefully acknowledge useful discussions with Ramki Kalyanaraman and optical measurements taken by Jeremy Strader.