


Introduction
In searching for relevant contextual or environmental factors contributing to the etiology of alcohol use and use disorder, researchers have focused on family, peers, and schools, and have tended to overlook the role of the neighborhood in which one lives (Galea et al., Reference Galea, Nandi and Vlahov2004; Gardner et al., Reference Gardner, Barajas, Brooks-Gunn and Scheier2010). This is despite well-established findings linking neighborhood to overall health and well-being (Robert, Reference Robert1999; Pickett and Pearl, Reference Pickett and Pearl2001). Research on neighborhood contextual effects has been criticized for being too focused on establishing that ‘neighborhoods matter,’ without delineating for whom they matter (Sharkey and Faber, Reference Sharkey and Faber2014). This may explain why it has been so difficult to draw any firm conclusions from the limited research on the relation between alcohol outlet density and alcohol use and use disorder (Bryden et al., Reference Bryden2012; Gmel et al., Reference Gmel, Holmes and Studer2016). Perhaps neighborhood contextual effects are only relevant for certain vulnerable individuals (Sharkey and Faber, Reference Sharkey and Faber2014), and nearly all studies of neighborhood effects on alcohol involvement have failed to appreciate that individuals vary in their vulnerability to environmental risks (Belsky et al., Reference Belsky, Moffitt and Caspi2013).
By incorporating genetic information into studies of neighborhood effects, it is possible to examine whether a particular neighborhood context has a greater impact on those individuals who possess a genetic vulnerability. Gene–environment interactions (Shanahan and Hofer, Reference Shanahan and Hofer2005; Dick, Reference Dick2011; Manuck and McCaffery, Reference Manuck and McCaffery2014) may emerge when there are environments that are more and less facilitative for genetic propensities to be actualized. For example, genetic variation in alcohol consumption may be greater among individuals living in a neighborhood with greater availability of alcohol (such as having more outlets where alcohol can be purchased) than those living in a neighborhood with less availability of alcohol, or conversely, vulnerability to the effects of an ‘alcogenic’ environment (Huckle et al., Reference Huckle2008) may be moderated by one's genetic risk for alcohol use.
Just as concerns have been raised about neighborhood research, so have concerns been raised about the existing gene–environment interaction research. With some notable exceptions (e.g., Daw et al., Reference Daw2014; Slutske et al., Reference Slutske2015; Dinescu et al., Reference Dinescu2016; Strachan et al., Reference Strachan2017), the research has typically focused on environments that are proximate behaviors or family characteristics rather than more exogenous environments, such as neighborhoods (Rende et al., Reference Rende, Swan, Baker, Chassin, Conti, Lerman and Perkins2009; Bookman et al., Reference Bookman2011; Young-Wolff et al., Reference Young-Wolff, Enoch and Prescott2011; Boardman et al., Reference Boardman, Daw and Freese2013). Such studies also often rely on self-report to assess both the alcohol outcome and the environmental risk factor (Young-Wolff et al., Reference Young-Wolff, Enoch and Prescott2011), which may exaggerate their true associations (Buu et al., Reference Buu2007; Young-Wolff et al., Reference Young-Wolff, Enoch and Prescott2011).
Despite potential relevance to etiological models (Dick and Kendler, Reference Dick and Kendler2012), there is only one gene–environment interaction study that has linked neighborhood-level characteristics with alcohol use. Among young adult Finnish twins, the heritability of alcohol consumption was significantly higher among those residing in urban than in rural areas (Rose et al., Reference Rose2001). Follow-up analyses attempted to determine whether the urban–rural differences in the heritability of alcohol use might be explained by a larger percentage of young adults, more residential instability, or greater alcohol sales in urban than in rural communities by examining whether there was significant moderation of genetic and environmental influences by these specific neighborhood-level characteristics (Dick et al., Reference Dick2001). For both the percentage of young adults and residential instability, the variation in alcohol use explained by genetic influences increased and the variation explained by common environmental influences decreased as a function of increasing levels of these neighborhood features. Somewhat surprising was that the genetic variation in alcohol use was not moderated by differences in community-level alcohol sales. Instead, there was evidence that common environmental variation in alcohol use was higher in communities with lower alcohol sales than those in which alcohol sales were higher. Nearly two decades later, there is still no empirical evidence to support the hypothesis that genetic variation in alcohol use is greater among individuals living in a region with greater access to alcohol.
The present study is based on a United States national sample of 18–26-year olds from the National Longitudinal Study of Adolescent to Adult Health (Add Health) that included information about the density of alcohol outlets in the neighborhoods of the participants. To our knowledge, the Add Health study represents the only United States national epidemiologic survey that included geocoded alcohol outlet density information for nearly the entire USA. In a previous study based on the Add Health sample, we examined the extent to which six indicators of alcohol use (ranging from any use to problems) differed by several neighborhood characteristics: urbanicity, disadvantage, and the density of on- and off-premises alcohol outlets (Slutske et al., Reference Slutske, Deutsch and Piasecki2016). The density of on-premises, but not off-premises, alcohol outlets was positively associated with any use of alcohol in the past year, but not with any of the other alcohol outcomes. These results are consistent with a review of previous studies suggesting that the association between alcohol outlet density and alcohol consumption is not especially robust (Gmel et al., Reference Gmel, Holmes and Studer2016). Perhaps this is because living in a neighborhood with many alcohol outlets may only be consequential for certain genetically-susceptible individuals.
Because the Add Health study also included a genetically-informed subsample of twins and siblings, we were able to address this possibility by examining whether the contribution of genetic and environmental factors to alcohol use varied as a function of neighborhood-level densities of alcohol outlets. The hypothesis guiding this study was that genetic variation in alcohol use would be amplified among individuals living in a neighborhood with greater access to alcohol.
Methods
Participants
Participants were drawn from the National Longitudinal Study of Adolescent to Adult Health (Add Health). Variables of interest for the current study were obtained in Wave III (N = 15 197), which was conducted in 2001–2002 with a response rate of 77.4%. The mean age of the participants at Wave III was 22 years (range = 18–26, M = 22.0, s.d. = 1.78), and 53% of the participants were female. The participants came from 50 different states and the District of Columbia and from 5938 different census tracts.
Among the 15 197 participants were 3949 individuals from 2434 sibling pairs. These were the focus of the present study. This included 289 monozygotic twin (MZ; 145 female, 144 male), 452 dizygotic twin (DZ; 117 female–female, 131 male–male, 204 female–male), 1251 full biological sibling (FS; 368 female–female, 342 male–male, 541 female–male), and 442 half biological sibling pairs (HS; 117 female–female, 115 male–male, 210 female–male). The sibling subsample participants came from 49 different states and from 1840 different census tracts. Fifty-three percent of the participants were White, 23% were African-American, 15% were Latino, 7% were Asian, and 2% were Native American.
Twenty-six percent of the sibling pairs were currently living together, and this was significantly associated with the type of pair (MZ, 36%, DZ; 29%; FS, 24%; HS, 21%). Thirty-seven percent of the sibling pairs resided in the same census tract, and this was also significantly associated with pair type (MZ, 47%; DZ, 38%; FS, 36%; HS, 31%). Sixty-nine percent of the sibling pairs resided in the same state, which was also significantly associated with pair type (MZ, 79%; DZ, 72%; FS, 68%; HS, 64%).
Participants completed extensive in-home interviews during which alcohol use was assessed. All participants gave informed consent and the study was approved by the Institutional Review Board of the University of North Carolina at Chapel Hill. Alcohol outlet densities were extracted from state-level liquor license databases and other neighborhood indicators were extracted from the 2000 United States census. Information on the census tract-level densities of alcohol outlets was available for 91% (n = 3582) of the sibling subsample participants.
Outcome measure
Alcohol use
Alcohol use was measured as the number of days on which any alcohol was consumed in the past year. The responses were coded into the following ordered categories: 0 (none), 1 (1 or 2 days in the past 12 months), 2 (once a month or less [3–12 times in the past 12 months)), 3 (2 or 3 days a month), 4 (1 or 2 days a week), 5 (3–5 days a week), and 6 (every day or almost every day).
Environmental moderater measures
Alcohol outlet density
Alcohol outlet licensing data was gathered from individual states between September 2006 and June 2007. Data were obtained from 43 states and the District of Columbia; 34 of these provided both on-premises outlet (alcohol sold to be consumed on site, including bars and restaurants) and off-premises outlet (alcohol sold to be consumed elsewhere, such as liquor, convenience, and grocery stores) licensing data, and eight provided aggregate outlet licensing data. Two states provided only aggregate data for select counties, and seven states provided no outlet licensing data. The data were aggregated at the census tract level. The total number of on-premises and off-premises and all (both on- and off-premises) alcohol outlet licenses were divided by the total land area for each census tract to derive the density of outlets.
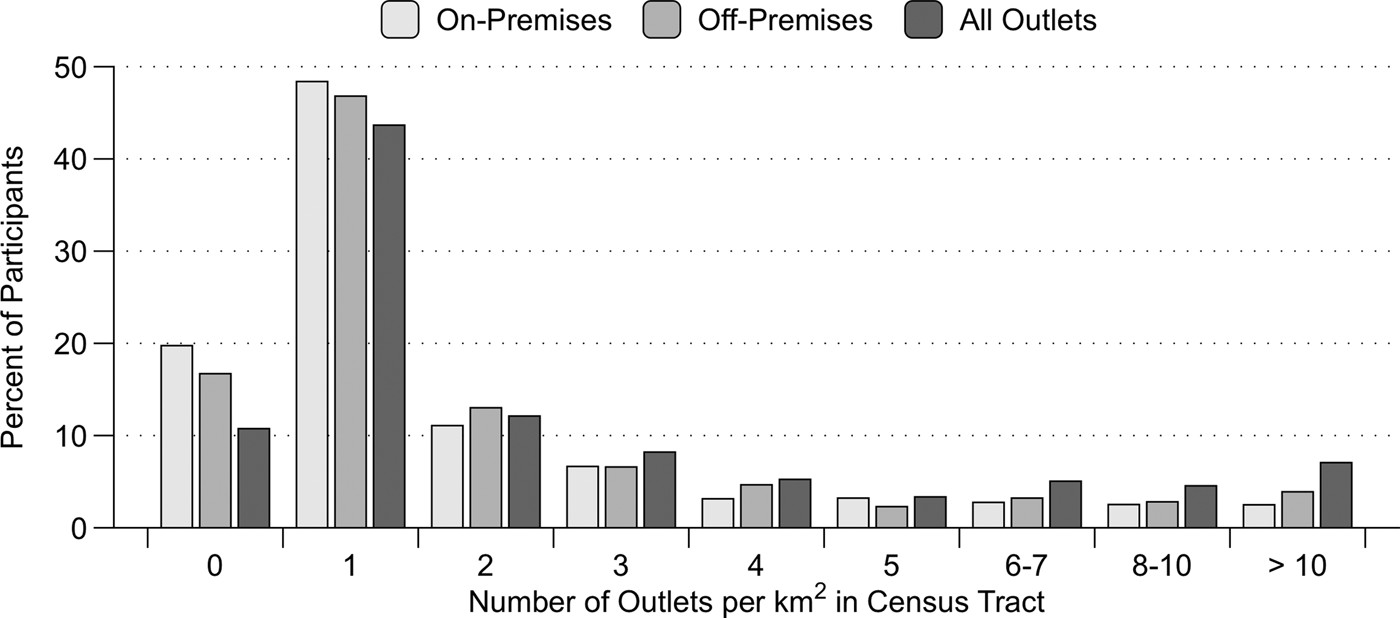
In this national sample, the mean number of on-premises, off-premises, and all alcohol outlets per square kilometer were 2.1, 2.1, and 3.8, respectively, for the census tracts where the participants resided. Based on the distribution of the outlet densities in the sample, we created nine-level ordinal variables for the densities of on-premises, off-premises, and all alcohol outlets corresponding to 0, 1, 2, 3, 4, 5, 6–7, 8–10, and 10 or more outlets per square kilometer (all categories other than zero and 10 or more include all densities greater than the previous and lower than the current density). The maximum values in the 10-or-more-outlets category were 205.4, 246.1, 482.6 for the densities of on-premises, off-premises, and all alcohol outlets, respectively. Figure 1 presents the percentage of participants at each level of the outlet density variables. The outlet densities were divided by ten to yield a moderator variable that ranged from zero to 0.8 for the biometric modeling analyses.
The percentage of participants living in census tracts with varying densities of alcohol outlets in a nationally representative sample of 18–26 year-olds in the USA. On-premises outlets sell alcohol to be consumed on site, and include bars and restaurants; off-premises outlets sell alcohol to be consumed elsewhere and includes liquor, convenience, and grocery stores. The maximum values in the 10-or-more-outlets category were 205.4, 246.1, 482.6 for the densities of on-premises, off-premises, and all alcohol outlets, respectively.
Covariate measures
Household income
Past-year household income was included as a covariate in one set of analyses to take into account the current financial resources of the participants. This represented the combined household income with a spouse or partner for 32%, the combined household income with parents for 31%, and the individual personal income for 37% of the participants.
State
The current state of residence was included as a covariate in some of the analyses to account for differences between the states in alcohol control laws (Xuan et al., Reference Xuan2015). In order to preserve the anonymity of the participants, the Add Health study developed randomly-assigned pseudo codes that uniquely identified the geographic units in which participants resided that were not linkable to outside data sources.
Urbanicity/population density
An indicator of urbanicity was included as a covariate in some of the analyses to account for differences in urban v. rural neighborhoods. Rural-urban commuting area codes (RUCA; United States Department of Agriculture Economic Research Service, 2015), based on measures of population density, urbanization, and daily commuting from the 2000 census, were used to classify the 1840 census tracts into the following four categories: metropolitan (1565 census tracts), micropolitan (161 census tracts), small town (71 census tracts), and rural (43 census tracts). These four categories of urbanicity differed in their mean population densities: 2385, 421, 56, and 19 persons/km2, respectively.
Neighborhood sociodemographic characteristics
Six covariates based on 8 census indicators were included in some of the analyses to account for sociodemographic differences between the neighborhoods in which the participants resided – two of these were indicators of race/ethnicity, and four were indicators of neighborhood disadvantage. The covariates were: (1) the proportion of African American individuals; (2) the proportion of Latino/a individuals; (3) the proportion of single-parent homes; (4) the average of the proportion of individuals and the proportion of families living below the poverty line; (5) the average of the proportion of individuals over the age of 25 who did not have a high school diploma, and the proportion of individuals over the age of 25 who did not have a bachelor's degree; (6) the proportion of individuals over the age of 16 who were unemployed.
Data analysis
Three alcohol use outcome variables differing in their level of covariate control were created. This was achieved by regressing the outcome variable onto the selected covariates and retaining the residual as the new outcome variable. The three levels of control included as covariates: (1) race; (2) race, state of residence, and urbanicity; (3) race, state of residence, urbanicity, household income, and the six census-based neighborhood sociodemographic characteristics. Race, state, and urbanicity were included in the regression as a set of dummy-coded variables. The psychometric properties of the resulting three alcohol outcome measures were: (covariate control level 1) mean = 0, variance = 2.9, skewness = 0.21, kurtosis = −0.93, (covariate control level 2) mean = 0, variance = 2.8, skewness = 0.24, kurtosis = −0.81, and (covariate control level 3) mean = 0, variance = 2.7, skewness = 0.23, kurtosis = −0.73.
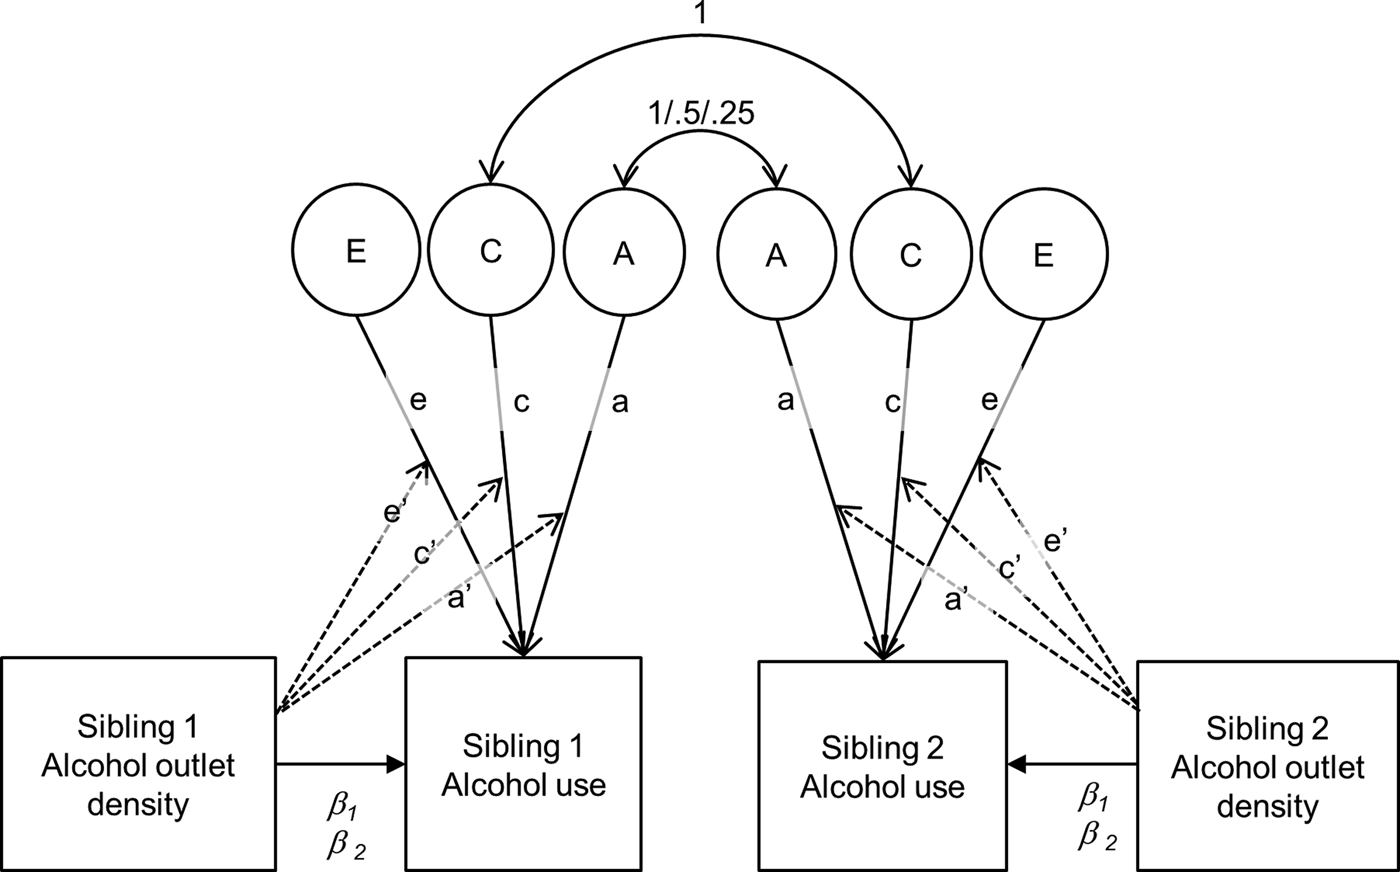
Biometric models that included gene–environment interactions were fit to the three covariate-adjusted alcohol use outcomes (Purcell, Reference Purcell2002; van der Sluis et al., Reference van der Sluis, Posthuma and Dolan2012; see Fig. 2). The effect of outlet density of the participant and the participant's sibling were regressed onto the alcohol use outcome (β 1 and β 2 in Fig. 2; van der Sluis et al., Reference van der Sluis, Posthuma and Dolan2012). The purpose of this was to remove any gene–environment correlation (even though non-significant correlations between alcohol outlet densities and alcohol involvement [largest correlation of only r = −0.02] ruled out this possibility). The regressions were allowed to vary for siblings of different genetic relatedness (e.g. different regression coefficients for MZ, DZ and FS, and HS). In all the models, the effects of age and sex were also regressed onto the drinking outcome to remove their contribution to the variance components. Omnibus tests of moderation were evaluated with a Wald chi-square (χ2) test of the three moderation parameters (a′, c′, and e′ in Fig. 2). Significant omnibus tests were followed by tests of each individual moderation parameter. All of the models were fitted directly to the raw sibling data by the method of full information maximum likelihood using the Mplus program (Muthén and Muthén, Reference Muthén and Muthén1998–2012)Footnote †Footnote 1.
Twin/sibling biometric model incorporating gene–environment interaction. a = variation explained by genetic factors, c = variation explained by shared environmental factors, e = variation explained by unique environmental factors, a′ = moderating effect of outlet density on a, c′ moderating effect of outlet density on c, e′ = moderating effect of outlet density on e. In this model the total genetic variation is a + a′* AOD, the total shared environmental variation is c + c′* AOD, and the total unique environmental variation is e + e′* AOD; these are the portions of variation that remain after removing the variation that is shared with alcohol outlet densities of either sibling with the following regression: alcohol use = β0 + β1AODsibling1 + β2AODsibling2.
Results
Environmental moderation of variance components
At the lowest level of covariate control (just accounting for age, sex, and race), the results of omnibus tests provided evidence that the density of on-premises, off-premises, and any alcohol outlets moderated the components of variation in the frequency of drinking (top panel of Table 1)Footnote 2. Follow-up tests revealed that all three alcohol outlet density indicators significantly moderated the genetic (χ2 = 7.91–13.63, df = 1, all p < 0.005) and unique environmental influences (χ2 = 7.73–8.92, df = 1, all p < 0.006) contributing to variation in drinking frequency. There was no evidence for moderation of shared environmental influences (χ2 = 2.11–2.21, df = 1, all p = 0.14).
Results of biometric model-fitting of gene–environment interaction for alcohol outlet density and the frequency of drinking at three levels of covariate control
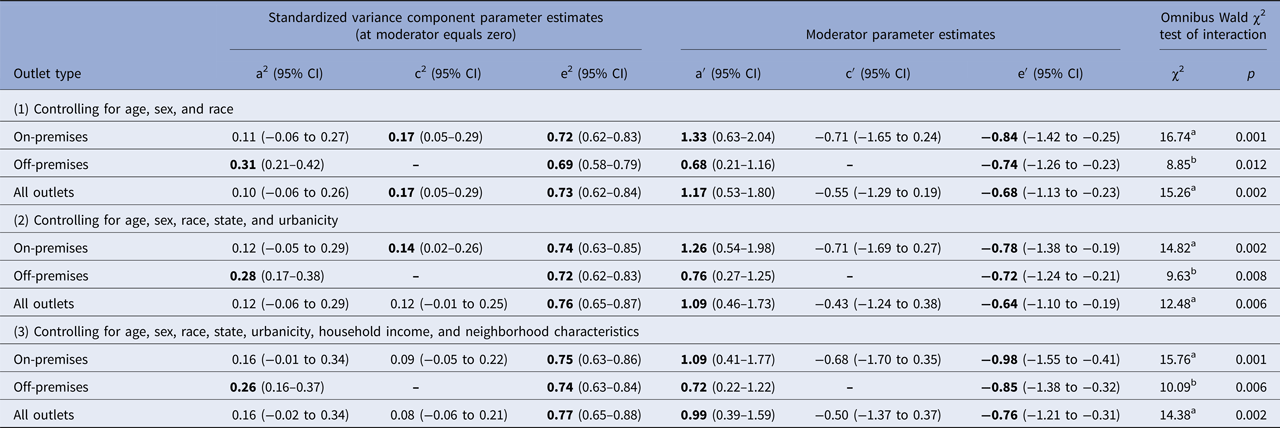
Note: Parameters in bold are significantly different from zero at p < 0.05.
a2 = proportion of variation explained by genetic factors; c2 = proportion of variation explained by shared environmental factors; e2 = proportion of variation explained by unique environmental factors; a′ = moderating effect of outlet density on a; c′ moderating effect of outlet density on c; e′ = moderating effect of outlet density on e; CI, confidence interval.
a df = 3.
b df = 2.
The results were similar at the more stringent levels of covariate control. After adding state of residence and urbanicity as covariates, the omnibus tests provided evidence that the density of on-premises, off-premises, and any alcohol outlets moderated the components of variation in the frequency of drinking (middle panel of Table 1), and follow-up tests revealed that all three alcohol outlet density indicators significantly moderated the genetic (χ2 = 9.30–11.81, df = 1, all p < 0.003) and unique environmental influences (χ2 = 6.70–7.80, df = 1, all p < 0.01) contributing to variation in drinking frequency. There was still no evidence for moderation of shared environmental influences.
At the highest level of covariate control, after adding household income and neighborhood sociodemographic characteristics as covariates, there remained evidence for significant moderation of genetic and unique environment effects (bottom panel of Table 1). All three alcohol outlet density indicators significantly moderated the genetic (χ2 = 8.00–10.44, df = 1, all p < 0.005) and unique environmental influences (χ2 = 9.75–11.07, df = 1, all p < 0.002) contributing to variation in drinking frequency, with no evidence for moderation of shared environmental influences.
The estimates of genetic influences as a function of the neighborhood densities of alcohol outlets at the highest level of covariate control are presented in Fig. 3. For example, the heritability of the frequency of alcohol use for those residing in a neighborhood with ten or more outlets (of any kind) was 74% (95% confidence limits = 55–94%), compared with 16% (95% confidence limits = 0–34%) for those in a neighborhood with zero outlets.
The heritability of drinking frequency as a function of alcohol outlet density. These results are based on models in which the effects of age, sex, race, state of residence, urbanicity/population density, household income, and six census-based neighborhood sociodemographic characteristics (proportion: African-American, Latino, single-parent homes, below the poverty line, low educational attainment, unemployed) were covaried. The maximum values in the 10-or-more-outlets category were 205.4, 246.1, 482.6 for the densities of on-premises, off-premises, and all alcohol outlets, respectively. Vertical bars represent 95% confidence intervals.

Post hoc analyses probing the effect of on-premises v. off-premises outlet densities
The densities of on-premises and off-premises alcohol outlets were strongly correlated in this national sample (r = 0.74; Slutske et al., Reference Slutske, Deutsch and Piasecki2016). A final step involved explicitly testing whether the moderation effects differed for the two outlet types. This was accomplished by including both moderators (and their interaction) into a single model and examining whether there was a significant decrement in model fit when the moderation parameters were equated. This post hoc test yielded no evidence for a significant difference in the moderating effects of the densities of on-premises v off-premises alcohol outlets on the heritability of the frequency of drinking (χ2 = 0.72, df = 1, p = 0.40).
Discussion
In a national sample of young adults, we demonstrated for the first time that the heritability of alcohol use is moderated by the density of alcohol outlets in one's neighborhood. The contribution of genetic influences was modest and non-significant, accounting for about 20% of the variation in neighborhoods with no alcohol outlets, but accounted for three-quarters of the variation in neighborhoods with 10 or more alcohol outlets per square kilometer. This suggests that areas in which there are many alcohol outlets will be an especially high risk for those individuals who have a genetic susceptibility to use alcohol.
These results contrast with the Finnish twin study that did not find moderation of genetic variation in alcohol use by differences in community-level alcohol sales (Dick et al., Reference Dick2001). This might be because the effects of the alcohol environment in Finland may not generalize to other contexts, such as the alcohol environment in the USA. Much of the alcohol purchased in Finland is from one of the government monopoly stores (Hallberg and Österberg, Reference Hallberg and Osterberg2016), and there are many other tight governmental controls that have limited alcohol advertising, including point-of-sale advertising inside and outside of outlets (Österberg, Reference Österberg2003).
Gene–environment correlation
A critical issue when studying gene–environment interactions is accounting for gene–environment correlation (Eaves et al., Reference Eaves, Silberg and Erkanli2003; Kendler, Reference Kendler, Kendler, Jaffee and Romer2011; Duncan et al., Reference Duncan2014). A gene–environment correlation occurs when one's genetic make-up influences exposure to a high-risk environment (Kendler and Eaves, Reference Kendler and Eaves1986; Rutter, Reference Rutter2006), such as living in a neighborhood with many alcohol outlets. It is important to account for gene–environment correlation because, for example, the overrepresentation of individuals at higher genetic risk for alcohol use and disorder in high outlet density areas can lead to results that mimic the effects of a gene–environment interaction. Although the implication of the concept of an ‘alcogenic environment’ is that the environment is impacting upon an individual's use of alcohol, it is equally plausible that this might reflect the impact of the individual on her choice of environment. A nice illustration of this comes from a 12-year multi-wave longitudinal study of 206 men who served as affected and control fathers in a high-risk study of alcohol use disorder. Not only did living in a disadvantaged neighborhood at baseline predict alcohol use disorder severity 12 years later, but alcohol use disorder severity at baseline predicted moving to or remaining in a disadvantaged neighborhood at 12-year follow-up (Buu et al., Reference Buu2007).
There was no evidence of gene–environment correlation in the present study. This was easily ruled out by the absence of an association between the density of alcohol outlets in the young adults’ neighborhoods and their drinking patterns. This is likely explained by the young age of the sample. Evidence from a study of Australian twins documented that gene–environment correlation for regional residence increases with age and may not be observed among young adults (Whitfield et al., Reference Whitfield2005). That the differential impact of genes in low- and high-alcohol-outlet-density environments cannot be attributed to selection supports the inference of the presence of a gene–environment interaction.
Venue type
The epidemiologic literature on the relation between the densities of different types of alcohol outlets and alcohol consumption among adults generally finds significant associations for on-premises but not for off-premises outlets (Truong and Sturm, Reference Truong and Sturm2007; Scribner et al., Reference Scribner2008; Gruenewald et al., Reference Gruenewald, Remer and LaScala2014). To our knowledge, however, there have not been any attempts to tease apart the independent effects of the different venue types. In the present study, there were significant moderating effects of outlet density on the genetic influences in drinking frequency for both on-premises and off-premises outlets, and a post hoc test suggested that the magnitude of the effect did not significantly differ for the two outlet types. This would seem to narrow the possibilities of the potential mechanisms underlying this effect.
Neighborhood disadvantage
In a previous paper, we demonstrated that alcohol outlet density could not explain the influence of neighborhood disadvantage on alcohol use outcomes (Slutske et al., Reference Slutske, Deutsch and Piasecki2016). Similarly, neighborhood disadvantage could not account for the moderating effect of alcohol outlet density on the heritability of alcohol use outcomes in the present study. Although alcohol outlets are more plentiful in more disadvantaged neighborhoods (Romley et al., Reference Romley2007; Berke et al., Reference Berke2010; Slutske et al., Reference Slutske, Deutsch and Piasecki2016), outlet density and disadvantage appear to function independently in contributing to risk for alcohol use and disorder.
Possible mechanisms
Moving away from disadvantage, there are several other potential mechanisms that might explain the moderating effect of neighborhood alcohol outlet density on the heritability of alcohol involvement. Environments marked by greater densities of alcohol outlets increase opportunities to drink in a number of ways. Alcohol is more easily accessible, with both lower ‘convenience’ (Stockwell and Gruenewald, Reference Stockwell, Gruenewald, Heather and Stockwell2004) and actual costs (Livingston et al., Reference Livingston, Chikritzhs and Room2007). Greater alcohol outlet densities may also lead to an increased emphasis on alcohol in the social relations within a community. Drinking norms can become more permissive in high-density areas (Campbell et al., Reference Campbell2009), and heavy-drinking social groups are more likely to form (Gruenewald, Reference Gruenewald2007). Finally, for those who are particularly vulnerable, a strong presence of alcohol marketing (Campbell et al., Reference Campbell2009) and the exposure to the outlets themselves (Meier, Reference Meier2011; Kirchner and Shiffman, Reference Kirchner and Shiffman2016) may serve as cues that could trigger alcohol-seeking behavior. It is possible that a combination of these factors creates an environment that may set the stage for the expression of the genetic predisposition for alcohol use.
Limitations
This study had a number of limitations. The modest sample size resulted in imprecise parameter estimates and required several less-than-optimal data analytic choices. Full and half-siblings were included in the biometric models; the model assumption of perfectly correlated shared environments may not apply to these types of siblings (Heath and Nelson, Reference Heath and Nelson2002). The modest sample size also made it necessary to combine the data from men and women in the analyses. Although the bulk of the evidence suggests that the contribution of genetic and environmental factors to alcohol use and disorder among men and women is similar (Salvatore et al., Reference Salvatore, Cho and Dick2017), there may be important differences in how they are moderated by neighborhood environmental characteristics (Dick et al., Reference Dick2001; Davis et al., Reference Davis, Natta and Slutske2017). Similarly, although our sample was racially diverse, it was necessary to combine the data from individuals from different racial/ethnic groups in the analyses. It will be important to replicate these results in a larger sample in which differences between men and women and between different racial/ethnic groups can be explored (Chartier et al., Reference Chartier2017).
There may be concerns about the use of census-defined geographic regions to define ‘neighborhoods.’ This is the only feasible approach for a national study such as Add Health. In addition, because the alcohol outlet data were aggregated at the census tract level, it was not possible to use a finer or coarser geographic unit of aggregation. A potential limitation of relying on census-tract-level densities is that the influence of living adjacent to a high-outlet-density census tract may be missed. An alternative measure of alcohol availability that is sometimes used rather than (or in addition to density) is the distance to the nearest alcohol outlet (Centers for Disease Control and Prevention, 2017). Although correlated, these two indicators provide different information – the shortest distance reflects the availability of alcohol nearby, whereas density represents the degree of choice of venue (Spoerri et al., Reference Spoerri2013). Studies that have used both distance and density have generally reached the same conclusions (Pollack et al., Reference Pollack2005; Spoerri et al., Reference Spoerri2013; Young et al., Reference Young, Macdonald and Ellaway2013; Ayuka et al., Reference Ayuka, Barnett and Pearce2014).
Although the assessments of alcohol use were conducted in 2001–2002, the densities of alcohol outlets were based on licensing data acquired 5 years later, in 2006–2007Footnote 3. It is likely that the indexes of the current neighborhood alcohol outlet densities may have been under- or overestimated (Zhang et al., Reference Zhang2015; Linton et al., Reference Linton2016). However, many states, such as California and Massachusetts, impose quotas on the number of liquor licenses in a region, and other states, such as Mississippi and Oregon, have monopolies on the sale of hard liquor, suggesting that many census tracts will have remained relatively unchanged.
Future directions
These findings could be extended by examining whether alcohol outlet density moderates measured (rather than inferred) genetic influences on alcohol use. One could derive polygenic risk scores from common DNA markers on a genotyping array to index measured genetic risk for alcohol use (Salvatore et al., Reference Salvatore2014, Reference Salvatore2015). This approach was successfully used to detect a gene–environment interaction in which the polygenic risk for smoking was more influential for those who lived in a neighborhood characterized by less social cohesion (Meyers et al., Reference Meyers2013).
Future research should also look beyond the residential neighborhood in characterizing the alcohol environment (Freisthler et al., Reference Freisthler2014). A promising approach utilizes GPS-equipped cell phones that participants carry with them throughout their daily lives to record time-stamped location information (Kirchener and Shiffman, Reference Kirchner and Shiffman2016). In addition to tracking proximity to venues outside of the residential neighborhood, it will also allow for a more fine-grained analysis of the type of alcohol venue. For example, different types of on-premises outlets (i.e. bars v. restaurants) are clearly not the same. Coupling this location information with ecological momentary assessment of self-reports of alcohol use and other potential predictors of use and misuse, such as subjective states (e.g. craving) and other contextual factors (e.g. the presence of friends; Piasecki et al., Reference Piasecki2011; Treloar et al., Reference Treloar2015) will provide a much richer picture of the relation between alcohol outlets and alcohol involvement and bring us closer to identifying mechanisms (Kirchener and Shiffman, Reference Kirchner and Shiffman2016). Although this approach may be difficult to implement in the sample sizes required for an adequately-powered twin study, it would lend itself well to the incorporation of genetic risk information gleaned from polygenic risk scores.
Conclusions
Despite limitations, this study represents a major step forward. It is the first to examine the association between neighborhood alcohol outlet densities and alcohol use within a genetically-informed study design and the first to demonstrate that the heritabilities of alcohol use are moderated by the density of alcohol outlets in one's neighborhood. The results suggest that living in a neighborhood with many alcohol outlets may be especially high risk for those individuals who are genetically-susceptible to habitually drink. These findings are consistent with the recommendation to limit alcohol outlet density to reduce excessive alcohol consumption and suggests that the effects may be even greater than anticipated (Campbell et al., Reference Campbell2009), because even in the absence of an overall association between outlet density and adverse outcomes there may still be subgroups of individuals adversely affected.
Acknowledgements
This research uses data from Add Health, a program project directed by Kathleen Mullan Harris and designed by J. Richard Udry, Peter S. Bearman, and Kathleen Mullan Harris at the University of North Carolina at Chapel Hill, and funded by grant P01-HD31921 from the Eunice Kennedy Shriver National Institute of Child Health and Human Development, with cooperative funding from 23 other federal agencies and foundations. Special acknowledgment is due Ronald R. Rindfuss and Barbara Entwisle for assistance in the original design. Information on how to obtain the Add Health data files is available on the Add Health website (http://www.cpc.unc.edu/addhealth). No direct support was received from grant P01-HD31921 for this analysis. Arielle Deutsch is now at the Sanford School of Medicine, University of South Dakota, Sioux Falls, SD 57104.
Ethical standard
The authors assert that all procedures contributing to this work comply with the ethical standards of the relevant national and institutional committees on human experimentation and with the Helsinki Declaration of 1975, as revised in 2008.
Conflicts of interest
None.



