


Introduction
The long time status of mass balance in an ice mass can be monitored by (i) remote sensing of vertical changes of the ice surface (e.g. Reference Zwally, Brenner, Major, Bindschadler and MarshZwally and others, 1989), (ii) accurately balancing ground-based surface measurements of the vertical motion with the vertical motion expected from the measured accumulation of the area (e.g. Reference HamiltonHamilton, 2002), (iii) comparing the flux of ice through a section where the geometrical dimensions are known, with the estimated accumulation received in the drainage area up-glacier (e.g. Reference ClarkeClarke, 1987), (iv) numerically estimating the mass balance (e.g. Reference Huybrechts and OerlemansHuybrechts and Oerlemans, 1990; Reference PattynPattyn, 2002), or (v) gravimetric measurements (e.g. Reference Bentley and WahrBentley and Wahr, 1998). The different techniques are summarized by Reference Rignot and ThomasRignot and Thomas (2002), who deliver a state-of-the-art review of the status of the largest ice sheets.
The third method is known as the balance-flux method. The balance-flux method has been widely used over the years, where ground-based surveys or remote-sensing techniques have provided data for ice motion used to calculate ice flux through some predetermined section (e.g. Reference Whillans and BindschadlerWhillans and Bindschadler, 1988; Reference RignotRignot, 2001). The advantage of this method is that the average mass balance for the catchment area can be found, which gives better results for estimations of ice-sheet mass balance than a number of isolated measurements. The problem with estimating mass balance of ice sheets is the limitation in the different methods, where relatively small uncertainties in the data or technique can grow into large errors when integrated over large areas.
The uncertainty inherent in using the balance-flux method is dependent on the quality of the surface velocity measurements, the accuracy of the geometry of the calculated section, the reliability of the depth integration of the ice flux and, finally, knowledge of the accumulation rate and size of the catchment area. Typically the incoming flux, ϕ in, has the highest uncertainty, since the exact drainage area is difficult to estimate (Reference Price and WhillansPrice and Whillans, 1998), and the accumulation rate is usually generalized from a few measurements integrated over a large area, leading to problems in accurately estimating incoming mass (Reference Fricker, Warner and AllisonFricker and others, 2000). The determination of the outgoing flux, ϕ out, or the ice flux through some section, also has its problems. The bed geometry may be poorly known, and even if the geometry is accurately known, we need to know the distribution of the stresses in the ice and the ice temperature to calculate the internal deformation of the ice, which integrated with depth and cross-sectional length gives the ice flux.
The usual application of the balance-flux method is to investigate the balance between ϕ in and ϕ out. In this work we twist the argument slightly, and ask whether we can estimate ϕ in from calculations of ϕ out in a section of a small glacier, and thus use ϕ out as a gauge of ϕ in in the upstream catchment area. The area we select is small and has a well-defined catchment, and we have fairly accurate records on accumulation rates from ground-penetrating radar (GPR) recordings in the area. ϕ out is determined across a well-defined cross-section, using numerical methods, controlled by measurements. We assume steady state (ϕ out = ϕ in), and the usefulness of ϕ out as a measure of ϕ in is estimated by comparing the calculated values of ϕ out and ϕ in.
Site Description and Data
The glacier that is the focus of this study is Bonnevie-Svendsenbreen (Fig. 1), a tributary glacier to the outlet glacier Kibergbreen, flowing through the Heimefrontfjella escarpment, Dronning Maud Land (DML), Antarctica. The Heimefrontfjella escarpment is part of a rift system from the break-up of Gondwana, and is subdivided by radially aligned weakness zones into four separate ranges: Tottanfjella, Sivorgfjella, XU-fjella and Milorgfjella (some confusion exists here in the geography, due to parallel nomenclature from early German and Norwegian expeditions). Behind Heimefrontfjella the Amundsenisen ridge connects to the Valkyrie Dome further inland. Bonnevie-Svendsenbreen feeds from a small, local dome on the Sivorgfjella plateau (∼2600ma.s.l.) and falls down the escarpment westwards where it joins Kibergbreen at ∼1600ma.s.l. Fieldwork by several Swedish expeditions has gathered accumulation, ice-velocity and ice-thickness data in this area since 1987.
(a) Bonnevie-Svendsenbreen, Kibergbreen and the Sivorgfjella plateau on a SPOT image taken 5 December 1995. Altitudes are given as ma.s.l. (b) Maps of Sivorgfjella. The dashed line encircles the catchment area for Bonnevie-Svendsenbreen. The inset shows an overview of the actual part of Dronning Maud Land, where Ns is the Finnish/Swedish Nordenskiöld base, S is the Svea summer base and Nm is the German Neumayer base. VS and SWG are the ice streams Veststraumen and Stanford-Willis Glacier.

Incoming mass
The catchment of Bonnevie-Svendsenbreen on the Sivorgfjella plateau is well pronounced due to the high relief topography (Fig. 1a), and, based on the Système Probatoire pour l’Observation de la Terre (SPOT) imagery, we estimate that the total area up-glacier of the cross-section is (70.7 ± 6.0)×106 m2. The larger part of the catchment is within the altitude range 2300–2700ma.s.l. (Fig. 1a).
The 1970–89 accumulation rate in this region of DML was studied in nine ice cores taken in a profile from Riiser-Larsen Ice Shelf to Amundsenisen (Isaksson and Karlén, 1994a, b), by stake profiles and by GPR profiling (Reference Richardson, Aarholt, Hamran, Holmlund and IsakssonRichardson and others, 1997; Reference Richardson-NaslundRichardson-Naslund, 2001).
The general picture over the studied period is an accumulation rate, ȧ, of ∼0.40mw.e. a–1 at the coast, with a decline to < 0.10mw.e. a–1 250km from the ice-shelf edge. At a distance of 550 km from the ice-shelf edge and inland over the lowland plateau Ritscherflya, _a increases to an average of 0.50mw.e. a–1 on the Heimefrontfjella escarpment. This high _a was recorded on the outlet glacier Kibergbreen, which drains Amundsenisen (Reference Richardson, Aarholt, Hamran, Holmlund and IsakssonRichardson and others, 1997). The standard deviation of ȧ was found to be as high as 0.30mw.e. a–1 in this area (Reference Richardson-NaslundRichardson-Naslund, 2001). Behind the escarpment there is a rapid decline to <0.10mw.e. a–1 up to Amundsenisen (∼2500ma.s.l.), about 50km inland, and 30 km west of the Sivorgfjella plateau (Fig. 1b).
The exact ȧ of the Sivorgfjella plateau is not known. An ice core taken on the south side of the Sivorgfjella dome did not show any clear signals that could be used as time markers, probably due to strong wind mixing of the snow (Reference Isaksson and KarlénIsaksson and Karlén, 1994a; personal communication from E. Isaksson, 1995). A snow-pit study in February 1990 in the same area suggested ȧ = 0.19 mw.e. a–1 over the year 1989/90 (Reference Näslund, Pohjola and StroevenNaslund and others, 1991), and then within the standard deviation shown by Reference Richardson-NaslundRichardson-Naslund (2001).
Based on this information, the local average ȧ on the Sivorgfjella plateau (Fig. 1b), which is drained partly through Bonnevie-Svendsenbreen, is likely 0.5 mw.e. a–1. Integrated over the catchment area, this gives an estimate of ϕ in ≈ 4.4×10⁷m3 ice a–1.
Outgoing mass
A digital elevation model is made using topographical maps at a scale of 1 : 25 000 (IfAG, 1993). The subglacial geometry is estimated from ice-depth measurements by radar soundings performed by several Swedish Antarctic Research Program (SWEDARP) expeditions to the area (e.g. Reference Holmlund, Naslund and BodinHolmlund, 1993), and supraglacial bedrock topography is used to interpolate data into a map of the bedrock topography using statistical minimum curvature techniques (Fig. 2).
(a) The bathymetry in m ice depth, and (b) the topography in ma.s.l. of Bonnevie-Svendsenbreen. Measured velocity resultants are inserted as arrows in (b), and the ice radar shots are marked as crosses. The dashed rectangle delineates the area for which the force budget is calculated, the solid line rectangle shows the area covered by the stress distribution calculated from the force-budget model, and the dashed line marks the cross-section. Ice thickness < 100m is blanked.

The ice velocity of the area is studied by optical triangulation and distance measurements of 30 stakes comprising nine strain nets (Reference Pohjola, Stroeven, Miller and OerterPohjola and Stroeven, 1991) (Table 1), using the AGA Geodimeters 400 and 114/14. Feature tracking from repeat satellite imagery is also used to make the ice-velocity field denser (e.g. Reference Merry and WhillansMerry and Whillans, 1993). We use geocoded SPOT images taken 9 years apart, which gives a good space resolution of the tracked features (Table 1). The features used are crevasses on the icefall, ogives below the icefall, and ice blocks on the glacier surface deposited by ice avalanches from the lateral ice walls. The measured ice-velocity resultants are shown together with ice surface topography in Figure 2b. In Figure 3 we show the surface velocity field gridded using minimum curvature methods, and the similarly gridded uncertainty of the velocity field, based on the error limits from the ice-velocity measurements. The uncertainty varies with the method used, and with the motion of each marker.
(a). The surface velocity distribution (ma–1), and (b) the uncertainty of the velocity distribution (m a–1) within the area where the force budget is calculated.

Averaged data from the measurements of surface velocity on Bonnevie-Svendsenbreen

As seen in Figure 2b, the radar profile is skewed to the southern side of the glacier. We use the distribution of surface topography and surface velocity in Figures 2b and 3a to interpolate the ice thickness to the center of the glacier, assuming that the general distribution of the velocity profile is proportional to the ice thickness. The result is shown in Figure 2a.
Method
The flow through a cross-section, ϕ out, is calculated as

where u is the ice-velocity resultant, s is ice surface, b is ice bed, A–A' is the cross section, y is the lateral and z is the vertical dimension. The spatial velocity distribution of u s is the measured surface velocities, where the vertical distribution u(z) is calculated using Glen’s general flow law for ice

which describes the deformation of an ice body as the result of internal and external frictional resistance of the gravitationally determined driving stress, where έ e is the effective strain rate, τ e is the effective stress, B is the temperature-dependent viscosity parameter, and n = 3. The effective stress τ e is described as

which introduces a complexity into Equation 1. The distribution of τ e is calculated using the force-budget technique described as

where τ b i is the basal drag, R is the resistive stress, and i = x,y (Reference Van der Veen and WhillansVan der Veen and Whillans, 1989). The driving stress is

where ρ is the ice density, g is the gravitational acceleration, z is the ice depth, and dZ/dX is the surface slope. In our approach, the input data are put into a 100 ×100m grid, and the gradients are calculated over lengths of 1000 m in order to minimize the effects of uncertainties in the determination of the input data. The strain rates  are calculated from the gridded surface velocity gradients, and, assuming ice is an incompressible medium, the vertical strain rate is calculated as
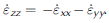 . The internal friction is a
function of B, which is dependent on the distribution of the ice temperature, T, such as

where B 0 = 1.928 Pa a1/3 and T 0 = 3155 K (Reference Pohjola and HedforsPohjola and Hedfors, 2003). The temperature distribution is calculated in each gridpoint using

where t is time, c is specific heat capacity, K is thermal conductivity, ρ is ice density (900 kg m–3), u, v, w are horizontal (along-flow), lateral (across-flow) and vertical ice velocities, Q is heat generated from internal and external heat sources (Reference Pohjola and HedforsPohjola and Hedfors, 2003), and T=–27˚C (Reference Isaksson and KarlénIsaksson and Karlén, 1994b). From Equation 1 the velocity profile is calculated as

where w is found from the vertical velocity distribution calculated from ′έ zz ;w b is assumed to be zero. Equation 1 is simplified assuming τxx , τyy , τzz and τxy are constant with depth, which provides for the depth-integrated values given from the force budget to be used. The stresses τxz and τxy at the base are set equal to the basal drag τ b x and τ b y . To get the depth relation of these stresses it is assumed that they decrease linearly with height over the bed to a value close to zero at the surface.
T(z) is calculated in each gridpoint, using an iterative routine that uses a convergence criterion; T(z) is accepted when u s calculated = u s measured, Equation 1 and u b = 0. The variable altered between iterations is the effect of the strain heating, or Q in Equation 1.
To summarize our approach, we use Equation 1 to obtain an average temperature, T, for the ice block considered in Equation 1. We use the highest quartile of the temperature distribution, giving T = –11.2˚C which is used to solve the stress distribution in Equation 1 (the argument for using the highest quartile of T is that most of the stress is taken up by ice at the bed and margins which is warmer than the average ice). The vertical distribution, T(z), is used to calculate the velocity profiles at each 100 m step on the y axis, using Equations (2) and (8). Finally we use Equation 1 to integrate the velocity profiles to obtain the ice flux.
Results
In Figure 4a we show the surface field of effective strain rate used as input to the force-budget model. The strain rates show the decreased deformation as the glacier relaxes from the icefall. The merging of Bonnevie-Svendsenbreen into Kibergbreen does not seem to be important in έ e, likely due to the lesser driving forces here, compared to within the icefall. We do, however, find the basal friction increases towards the merging with Kibergbreen, as shown by the calculated basal drag in Figure 4c. This tells us that the most important factor for the retardation of Bonnevie-Svendsen-breen is localized at the bed. Bonnevie-Svendsenbreen is heated when it flows down the icefall (Fig. 4b; Pohjola and Hedfors, 2003). The symmetry between basal temperatures (Fig. 4b) and the basal drag hints at the possibility that basal temperatures in Bonnevie-Svendsenbreen cool towards Kibergbreen, perhaps due to conduction from a likely cooler Kibergbreen.
(a). The calculated distribution of depth-integrated effective strain (a–1), (b) basal temperature (˚C), and (c) basal drag (kPa) as result of the ice-temperature and force-budget modelling. Note that this area is smaller than the outlined area in Figures 2 and 3 due to the derivation done in the force-budget calculation.

The calculations through the section A–A' produce ϕ out=(4.1±0.4)×107 m3 ice a–1.We do three runs, first using the velocity field in Figure 3a as input to the calculations in Equations (1–8), and then a maximum (minimum) flow run, where the uncertainty in Figure 3b is added to (subtracted from) the measured velocities in Figure 3a. The amount of ϕ out is the median of the minimum and the maximum runs, estimating the size of the uncertainty of the result. In Figure 5 we present the velocity, effective stress and temperature distributions of the first run of the ice-dynamical picture through the cross-section.
The distribution of (a) ice velocity (m a–1), (b) effective stress (Pa) and (c) ice temperature (8C), using isolines of 2.58 equidistance, in the cross-section A–A0.

Discussion
The calculated ϕ out clearly suggests that ϕ in should be found in the upper range of the likely numbers from the studies of the accumulation rates in the area. Before going into more detail on this outcome, we will discuss other sources of errors in the calculation of ϕ out.
The selected cross-line traverses the area of the highest uncertainties in the velocity distribution. The reason for choosing this cross-line is to avoid areas proximal to the merging downstream with Kibergbreen, where ice-dynamical complexity is likely to be introduced. The high uncertainty assigned to the data here is based on the fact that data are sparse here (Fig. 2a). This introduces a risk that the data may have a degree of statistical fiction. The spatial velocity distribution produced in Figure 3a is logical, which reduces the risk of fictional velocity data.
The interpolation of the center of the subglacial trough using the ice-velocity distribution and the surface elevation, and the interpolation of the flanks of the glacier using the adjacent mountainsides, introduces an uncertainty in the ice-thickness data. This uncertainty in ice thickness is proportional to the uncertainty in the velocity records. The symmetry within the distribution of ice thickness in Figure 2b is in favor over the risk for large errors in the ice-thickness data used. The uncertainty of the ice-thickness data will have little influence on the calculated flow, since the flow is determined by the surface velocities, which we do have control of.
The ice-temperature profiles we use to obtain the ice viscosity are modeled, and not known from empirical data. In our numerical approach we let the temperature module iterate until we get a match between the calculated velocity at the ice surface and the measured velocity. If surface velocities or ice thickness deviate substantially from real values, the numerical routine will not converge. The spatial distribution of the basal temperatures in Figure 4b suggests that the distribution of ice velocity and ice thickness is essentially close to reality. In the upper left corner of Figure 4b there seems to be a strange pattern in the basal temperatures, which may point to an inconsistency in the input data, but this area is outside the cross-section we use.
The numerical approach in itself may produce an uncertainty. One source may be the gridding of the data, which introduces a statistical uncertainty. Also, the force-balance technique in itself may introduce uncertainty. We assume the studied area is an iso-viscous bloc. Having layered viscosities, and calculating the force balance on small finite volumes may give a slightly different outcome. However, Reference Whillans, Chen, van der Veen and HughesWhillans and others (1989) found that this makes only a small difference. A third consideration is the numerical code itself. In order to study this, we altered the iteration steps, and convergence criteria in the calculations, but found only small deviations of the ϕ out in the order of a few ‰.
Based on this, we assign the result ϕ out = (4.1 ± 0.4) ×107m–3 ice a–1 as a firm output, which shows that this technique may produce well-confined results. Better information on the velocity field at the surface would decrease the uncertainty limits.
How large is the accumulation rate in the catchment of Bonnevie-Svendsenbreen? We assume that ϕ out = ϕ in, which is correct as long as there have not been any changes (within the uncertainty level) of the accumulation rate in time. The results from Reference Richardson, Aarholt, Hamran, Holmlund and IsakssonRichardson and others (1997) show ȧ = 0.50 ± 0.30mw.e. a–1 in the area of Sivorgfjella (where the uncertainty indicates the spatial variability, not the uncertainty of the average for the area). If ϕ out = ϕ in, where ϕ out = (4.1 ± 0.4)×107m3 ice a–1, then this equals ȧ = 0.50 ± 0.05mw.e. a–1, which is similar to the results found by Reference Richardson, Aarholt, Hamran, Holmlund and IsakssonRichardson and others (1997). We therefore suggest that the Sivorgfjella plateau has a spatial average ȧ = 0.50 ± 0.05mw.e. a–1.
Can we use calculated ice fluxes through determined sections in order to estimate upstream accumulation rates? Based on the results here, the answer is yes. Having good control of the velocity field at the surface, and fairly good control on the ice geometry, we may even say that the flux through the section can be given to a larger certainty than the estimations of the incoming mass. This leads to the argument that it may always be difficult to estimate the sign and size of balance flux, since the uncertainty of the incoming mass is usually much larger than for the outgoing flux.
Conclusions
The accumulation rate on the Sivorgfjella plateau is 0.50 ± 0.05mw.e. a–1. This is a high rate for the East Antarctic environment, and shows the size of local orographic enhancement of accumulation on an ice sheet.
The balance-flow method, in combination with the force-budget technique and an ice-temperature model, is a useful tool for studies of mass fluxes over a catchment area.
The most important source of uncertainty in these calculations is the quality and the spatial distribution of the ice surface velocity data. In our dataset we have 10% uncertainty in the ice-flux estimation. A large number of GPS measurements over an area, and perhaps densified by interferometric synthetic aperture radar (InSAR) data, could be used in the way we have described, giving significantly reduced uncertainties in ice-flux calculations, disregarding less certain ice temperature and ice-thickness data.
Acknowledgements
V.P. is indebted to the late I. Whillans for supporting the force-budget modeling that was initiated during a postdoctoral period too many years ago. V.P. also acknowledges C. Merry, then at the Byrd Polar Research Center (BPRC), Columbus OH, USA, and W. Karlén for support with this project. A. Stroeven is saluted for excellent field assistance. V.P. credits the Swedish Research Council for funding a postdoctorate at BPRC 1995–97, the Alfred Wegener Institute and the Swedish Polar Research Secretariat for logistical support. Stiftelsen Ymer-80 is credited for financial support of this work. Two reviewers are thanked for constructive comments.



