1. Introduction
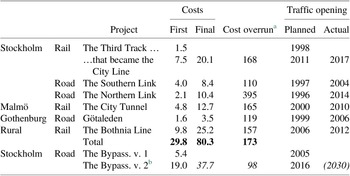
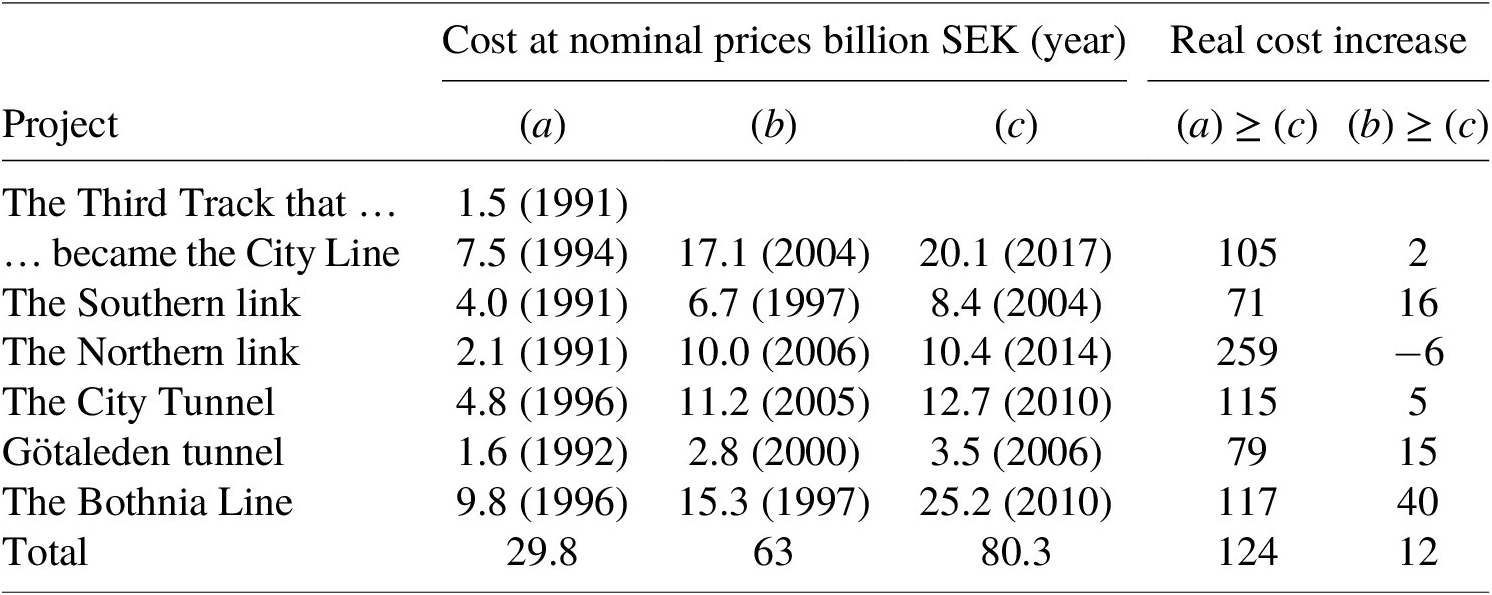
New roads and railways are built to make it possible to travel and transport goods, now and in the future. To maximize social welfare, the infrastructure improvements that provide the highest net benefits within a limited budget should be prioritized. The number of future users of a new road or railway and the cost of building it are of vital significance for estimating net benefits (Andersson et al., Reference Andersson, Hultkrantz, Lindberg and Nilsson2018). By reviewing the seven Swedish infrastructure projects enumerated in Table 1, from the time when the decision to have the project built to traffic opening, the present article focuses on the second of these variables. Specifically, the purpose is to identify reasons for cost increases between first estimates to the final, invoiced costs. An additional purpose is to consider the motives for policymakers to proceed with projects despite large cost increases.
The seven projects.

Note: Cost when the formal time to implement the project and final cost, billion Swedish Krona (SEK) at nominal prices. Planned and actual traffic opening.
a ((Final cost/estimated cost)−1) × 100.
b Estimated.
A large body of literature compares costs at different stages of the process from initial ideas to ready-to-use roads, railways, and other infrastructure projects. Flyvbjerg et al. (Reference Flyvbjerg, Ansar, Budzier, Buhl, Cantarelli, Garbuio and Glenting2018) define cost overrun to be the difference between actual and estimated capital costs. To facilitate accurate comparisons across investments geographies and time periods, cost overrun is accounted for in relative terms.
Flyvbjerg (Reference Flyvbjerg2016) reports cost overruns for an international database including 1603 projects that is approximately 40 per cent in real terms. In the domestic arena, a range of studies of infrastructure projects have reached similar conclusions. This includes several studies by the national audit organizations,Footnote 1 including Riksrevisionsverket RRV (1994) and Riksrevisionen (2010, 2011, 2021). The point of departure for the audits is that a transparent and reliable account of what happens with costs over time is central to good cost control. It should also be feasible to identify which cost estimate provides the basis for an investment decision. Both Riksrevisionen (2010) on road investment and Riksrevisionen (2011) on railway projects conclude that these objectives are not met.
Against the base of a massive number of empirical examples, the literature is concerned with providing reasons for cost overruns. Due to the contextual embeddedness of projects, Love and Ahiaga-Dagbui (Reference Love and Ahiaga-Dagbui2018) assert that there is no universally accepted theory that can explain cost overrun causation. They suggest that two schools of thought have emerged that seek to provide a platform for understanding and examining the phenomenon:
-
(i) Evolutionists propose that cost overruns are the result of changes made between the inception stage and eventual project completion. This includes scope changes, the general complexity of many projects, geology issues, and cost variations over the business cycles. These features become visible in ex post studies and offer tangible explanations of cost deviations.
-
(ii) Psycho-strategists attribute overruns to deception, planning fallacy and unjustifiable optimism in the initial cost estimation.Footnote 2
Flyvbjerg et al. (Reference Flyvbjerg, Ansar, Budzier, Buhl, Cantarelli, Garbuio and Glenting2018) argue that the evolutionist approach merely represents superficial manifestations of what is going on. In behavioral terms, a causal chain starts with human bias, which leads to underestimation of scope during planning and subsequent scope changes during delivery. If the bias is not identified and dealt with up front, cost overruns are inevitable.
Flyvbjerg (Reference Flyvbjerg2021) takes this one step further. His position is that behavioral biases are not limited to cognitive biases, and that behavioral economics in its present form suffers from an overfocus on cognitive psychology: Economic decisions get over-accounted for in psychological terms, when political, sociological, and organizational perspectives may be more pertinent. His conclusion is that cognitive bias is only half the story in behavioral science. Political bias is the other half.
Political bias – understood as deliberate strategic distortions – arises from power relations instead of from cognition. Political bias is particularly important for big projects. Flyvbjerg (Reference Flyvbjerg2021) argues that for large projects the most significant behavioral bias is political bias, also referred to as strategic misrepresentation. For real-world decision-making in big hierarchical organizations with millions and sometimes billions of dollars at stake, political bias is pervasive. This explains the political willingness to have large projects built irrespective of what is known about their costs and benefits.
Eliasson and Fosgerau (Reference Eliasson and Fosgerau2013) suggest that cost overruns not necessarily emanate from political bias. Instead, cost overruns may arise as a selection bias. This is bound to arise whenever uncertain ex ante predictions provide an input to implementation decisions. All that is required for selection bias to be present is that the selection of projects is influenced by noisy cost estimates.
The seven projects in the present article contribute to the long empirical list of cost overruns. A second contribution is provided by observing the void of relevant historical cost information, making it difficult to estimate costs of new projects. While some observations in the subsequent description of the seven projects may fit in with the idea of political bias, the article, third, contributes by arguing that the way in which the planning and decision process is organized in Sweden per se provides incentives for cost increases. The generalizability of this hypothesis hinges on if other countries arrange their decision processes in similar ways.
To provide a context for last argument, the article starts with describing the national framework for planning and implementing infrastructure investments (Section 2). Section 3 describes the seven projects enumerated in Table 1, and Section 4 crunches these numbers to facilitate a real-term estimate of the difference between ex ante and ex post costs. Section 5 discusses reasons for cost overruns during project implementation, that is, from tendering to ready-to-use roads and railways, while Section 6 considers cost increases during the early stage of the process. Section 7 concludes.
2. The framework for planning and building infrastructure
This section describes how new roads and railways are planned and built. Section 2.1 sets out the institutional framework and Section 2.2 the organization of the processes.
2.1 The institutional structure
Sweden’s public sector comprises three tiers with elected assemblies at both the national level, in 21 regions and in 290 local communities. Each of the (1+21+290=) 312 tiers raises taxes to finance their activities.
The government is responsible for policy-related aspects of infrastructure provision for all railways and most roads outside municipalities. Agencies are used to administer and implement investment in and maintenance of both modes on behalf of the government. The Government’s Offices handle the day-to-day communication between the government and its agencies. From an international perspective, Sweden’s Government Offices is small relative to the size of the agencies (Molander et al., Reference Molander, Nilsson and Schick2002).
The national railway monopoly was horizontally separated in 1988, making the Swedish National Railway Administration (Banverket) responsible for infrastructure, while train operations were operated by the incorporated SJ AB (Nilsson, Reference Nilsson2002). The Swedish National Road Administration (Vägverket) held the corresponding responsibility for national roads since the 1940s. The two administrations were merged in 2010 and now operate as Trafikverket, the Swedish National Traffic Administration, subsequently referred to as the infrastructure manager (IM). Its two main tasks are to prepare a draft program for investment and maintenance activities and - after that the government has established the priorities in these programs - to implement them by way of competitive tendering .
The public sector’s regional and local tiers handle public transport and local roads, respectively. While the central government pays for national infrastructure, regions and communities have an obvious interest in having national roads and railways built on their turf. One reason is that municipal masterplans for physical planning may be based on the construction of a new road or railway included in the national investment program. Deviations from that program may have knock-on consequences for projects in regions and communities. Moreover, national roads and railways provide valuable services not only for long-distance travel and transport but also for residents, intermingling the roles of the three tiers of policymakers. National infrastructure planning is therefore a component of a complex formal and informal interplay between different institutional and political tiers of society. This provides one background to the extensive lobbying for specific projects: compare Jussila Hammes and Nilsson (Reference Jussila Hammes and Nilsson2016).
2.2 The default process for planning and implementation of new infrastructure
The practical work of the physical planning – the specification of where and how new infrastructure is to be built – is handled by the IM’s regional offices. The physical planning is meant to account for a series of important concerns in society.
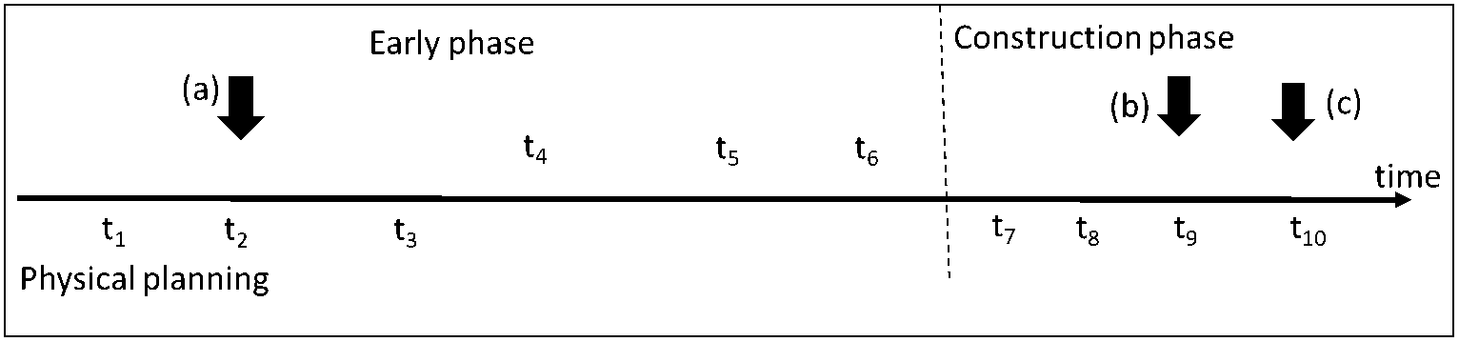
Measures in the infrastructure are triggered by shortcomings of an existing road or railway. A feasibility study is the first step of the process toward building a new road or railway (t 1 in Figure 1). The main purpose is to assess whether a draft proposal would be able to handle the problems on the existing infrastructure that it is supposed to remedy. This includes a cost assessment based on experiences from previous similar projects. The next step is to prepare a Road or Railway Inquiry (t 2). The resulting document is to be of sufficient quality to make it possible to take a position on the various alternatives to handle the problems that are at hand. In combination with inputs from a consultation process, the IM decides which alternative to proceed with.Footnote 3
Timeline for project planning and implementation.

The third step in the process is the preparation of a Train Plan or a Road Plan for each single project. The format is regulated in law (1971:948 and 1995:1649, respectively; cf. t 3). The purpose is to streamline planning of national and local infrastructure and to make sure that relevant aspects of the environmental legislation are handled. Those affected are given the opportunity to express their views. The output is a scheme providing further details of the project’s location and design, including a cost estimate that is to provide a valid basis for subsequent budgeting.
While the IM handles the physical planning of single projects, the government manages the financial planning. The first step in this is to establish the budget for infrastructure construction and maintenance for an upcoming 12-year program which is updated every fourth year (t 4). The first 8 years of a new program comprises the projects in the plan which is nearing its end. It is therefore the final 4 years where there is scope for new projects. The IM drafts a program proposal which inter alia is supposed to be based on BCA’s. The cost estimate marked by (a) in Figure 1 provides the input for the economic analysis. After sending the draft on a national round of consultations, the government establishes the 12-year program, that is, the priority order of projects that are to be implemented within the set budget limit (t 5).
Before a project can be started, formal parliamentary approval is required. This is done in the annual budget decision (t 6). Practical implementation starts with the IM tendering a consultant to prepare a project plan (t 7) which includes a Bill of Quantities. This document enumerates all construction activities that are to be implemented to have the road or railway built and in which quantities. Appendix describes the nature of this document which is part of the subsequent Quote for Bids for project implementation (t 8). The builder willing to implement activities at lowest cost is allocated the contract (t 9). The winning bid provides the first outside indication of the realism of the initial cost estimate. During implementation, the contractor is paid for work performed and the final cost is the sum of invoices paid by the client (t 10).
3. The seven projects Footnote 4
During the second part of the 1980s, insufficient infrastructure capacity as well as environmental issues, not least in metropolitan areas, was in focus of policy deliberations. The political starting point for the six projects described in Section 3.1 was a fundamental policy change in the late 1980s. Based on Bill 1989/90:88, the parliament established that it was necessary to finance major road and railway investments in whole or in part outside the national budget. The decision to initiate the six projects was taken by the parliament, at a point of time slightly earlier than at (a) in Figure 1. Section 3.2 then provides the same type of information about the seventh project, the Bothnia Line.
The seven projects described in this section were not initiated as part of the standard planning process described in Section 2.2; they were based on tailormade legislation. Despite this difference between the standard and the extraordinary decision process, I will argue in Section 4.4 that the incentives leading to cost overdraws are very similar.
3.1 Planning and implementation of six metropolitan projects
To handle both the need for additional funds and the overlapping responsibilities of the public sector’s three tiers, the government appointed a negotiator for the country’s three metropolitan areas in March 1990. The envoys were instructed to draft agreements with representatives for the respective regions and local communities. Each settlement was to include measures to improve the environmental situation and accessibility and to improve preconditions for regional development through measures in the overall traffic system. In addition, each negotiation was supposed to stimulate the planning and implementation of regional and local activities complementary to national responsibility.
After one year, the proposals from the three negotiators were published as SOU 1991:19. Later that year, the parliament approved a subsequent government bill by allocating SEK 10 billion for investments in traffic infrastructure over and above regular appropriations (1990/91: TU 24). This is the point of time when the actual decision to start these projects were made. This section presents the four projects emanating from the negotiations in Stockholm (Section 3.1.1) and one each in Malmö and in Gothenburg (Section 3.1.2).
3.1.1 Stockholm
The Third Track that became the City Line
The 1991 committee proposal included the construction of a Third Track next to the existing two tracks passing through the midst of Stockholm, the purpose being to enhance capacity. Costs were estimated to be SEK 1.5 billion with traffic starting after 6 years in 1998.
The Third Track would affect buildings of historical and cultural values, and a fierce debate blocked the further preparation of this design. A feasibility study evaluating alternative ways to enhance capacity included a 6 km double track commuter train tunnel under the central parts of Stockholm’s city. In March 2005, the government, the city of Stockholm, and the County Council signed a letter-of-intent to proceed with the City Line. This second version of the project included two underground stations paid for by the region. The cost estimate was SEK 7.5 billion with completion in 2011.
In 2007, the final financial agreement also included municipalities and county councils in mid-Sweden. The motive was that the additional track capacity would benefit also the larger region. At that time, the budget was SEK 17.1 billion. Construction commenced in 2009 with traffic opening in July 2017. The final cost for the City Line was SEK 20.1 billion.
The Southern (Road) link
By building a tunnel with several links to the surface south of central Stockholm, traffic to and from the city’s eastern suburbs could bypass the downtown area. The 1991 deal indicated that construction of the Southern Link was to begin in 1994 and be completed in 1997 at a cost of SEK 4 billion. The need to amend existing zoning decisions as well as local resistance delayed the start of construction, and an agreement between the signatories of the overall Stockholm package was endorsed in 1997. The cost estimate was now SEK 6.4 billion, with the state paying SEK 5.6 billion and the city of Stockholm the rest.
Construction started in 1997 at a tendered price of SEK 6.7 billion. Traffic commenced in 2004, and the final bill was SEK 8.4 billion. The latter cost increases were due to changes in the scope of the project as well as new rules for tunnel safety.
The Northern (Road) Link
Analogous to the Southern Link, the Northern Link would relieve northern parts of the city from through-traffic. A substantial section of the project was built in a tunnel. Construction would start in 1994 with traffic opening in 1996, estimated costs being SEK 2.1 billion.
While the tunnel part of the project could be built according to preliminary plans, another section would affect an environmentally sensitive park area. For this reason, the administrative court rejected the first design. After adjustments, financing of the project was decided in 2002, with the estimated cost updated to SEK 6.2 billion with a 75/25 split of costs between the government and Stockholm community. After a new round of projecting, construction began in 2006, when the cost was estimated to be SEK 9.1 billion. The final 2014 cost was SEK 10.4 billion.
The (road) Bypass
The existing north–south bypass to the west of Stockholm is used close to capacity, and the Stockholm agreement included a new bypass further to the west. Västerleden, in the tables called the Bypass v. 1, was to be built in tunnels albeit on bridges when crossing lake Mälaren. Its estimated cost was SEK 5.3 billion.
A new environmental code as well as resistance against the bridges that would cross pristine parts of the countryside, meant that this solution was rescinded. A new feasibility study resulted in Förbifart Stockholm (the Bypass. v. 2), a 20.7 km-long tunnel with two lanes in each direction, passing 60 m below the surface of the lake at its lowest point. The second bypass version includes three intersections connecting the tunnel to the surface and replacing the bridges in the original design. The 2003 cost estimate was SEK 18–20 billion.
Because of escalating costs, financing became a hurdle. This was solved in Bill 2006/07: 109 where the government linked two formally unrelated issues to each other: one was the introduction of congestion tolls around the city of Stockholm, and the other the earmarking of proceeds from the toll to pay inter alia for the bypass (Eliasson, Reference Eliasson2014). The formal decision to have v. 2 of the project built was made in 2009 when it was expected to cost SEK 27.6 billion, adjusted so SEK 31.5 billion in 2013.
Construction started in 2014, but the project has experienced several problems. One reason was that the rock under the lake was of worse quality than expected, stopping work altogether for a period. Moreover, one entrepreneur violated environmental legislation related to the handling of blasted rock, subsequently going bankrupt. When this is written in 2022, it is estimated that traffic may commence is 2030 costing SEK 37.7 billion (price level 2017).
3.1.2 Malmö and Gothenburg
The Malmö city railway tunnel
The negotiator responsible for forging a deal for the Malmö region suggested the construction of a new 10.5 km long double-tracked railway, half of it in a tunnel under the city. The City Tunnel created a shortcut for passenger trains between Malmö Central station over the Öresund Bridge to and from Denmark.
The original settlement did not resolve the financing of the project estimated to cost SEK 3 billion. During subsequent deliberations, the project grew and came to include changes to the railway yard around the Malmö Central station. Based on Bill 1996/97:161 with costs estimated at SEK 4.8 billion, the project was formally approved. At that time, the tunnel length had increased and included a station under the city paid for locally.
Construction began in 2005 when costs were estimated to be SEK 9.4 billion, excluding components that were the responsibility of the city of Malmö and the surrounding region. When the tunnel was opened for traffic in 2010, its final cost was SEK 12.7 billion.
Götaleden
In Gothenburg, Götaleden, a new road under the river that separates the city into northern and southern parts, was proposed by the regional negotiator in 1991. Construction was planned to commence in 1997 at an estimated cost of SEK 2.1 billion with traffic opening in 1999. At the actual start of construction in 2000, costs had increased to SEK 2.8 billion, with final costs being SEK 3.5 billion and traffic starting in 2006. A significant part of the cost increases was attributed to new tunnel standards as well as stricter requirements for disturbances from tunnel traffic for the surrounding properties.
3.2 Planning and implementation of the Bothnia Line
Since traffic started at the end of the 19th century, trains between the northern and southern parts of Sweden use a single-track line situated long away from the cities along the bay of Bothnia. The Bothnia Line is a greenfield single-track railway parallel to the existing north-south track but close to the sea. The city of Umeå is at the line’s northern end with the greenfield section proceeding 200 km along the coast. It links to the existing Ådalsbanan and to the city of Sundsvall, an additional 120 km to the south. The stated purpose of the Bothnia Line was to provide a railway benefitting both passenger and freight traffic along the line as well as the region at large.
The project was not included in the investment program established at this time but was seen to be a long-term option. Both the six projects described in Section 3.1 and most of the other projects shortlisted in the program were situated in densely populated parts of the country, while few projects in the sparsely populated northern half were included. The decision to proceed with the Bothnia Line therefore included a regional equity dimension.
The first official document referring to the Bothnia Line was published in 1992 (Bill 1992/93: 176). The cost for the entire Umeå–Sundsvall project was estimated to be SEK 7.9 billion. In 1994, the government commissioned a study, and the subsequent report estimated costs to be SEK 9.8 billion SOU(1996, p95)… Soon after, Bill 1997/98: 62 was sent for approval to the parliament.
Botniabanan AB, a limited company owned by the state and the municipalities along the line, was to handle the financing, design, procurement of construction, and the subsequent leasing of the line’s greenfield section. Restoration of the existing Ådalsbanan was to be financed by appropriations.
The section immediately south of Umeå gave rise to substantial delays relative to the original schedule. Reasons included both the formal administrative admissibility process, design issues, and court proceedings triggered by environmental concerns. In addition, the European Commission saw a risk that the project would not fulfill obligations according to the Species and Habitats Directive and the Birds Directive. The Swedish government was therefore requested to clarify the environmental protection status of the river delta close to the line’s northern endpoint. Much of the legal proceedings were in progress at the same time as construction of non-controversial sections had commenced. At a late stage of the construction process, it was decided to install the new ERTMS signaling system. This further delayed the start of traffic, which came to be in August 2012. The final cost for the Bothnia Line is estimated to be SEK 25.2 billion.
4. Presenting costs in a way that can be used for analysis
Based on the above project descriptions, this section specifies by how much the costs for the seven projects have increased. Section 4.1 describes which cost estimates that are used while Section 4.2 presents different ways to measure cost increases in real terms.
4.1 Challenges in defining costs
The article seeks to quantify and explain the difference between the projects’ final costs and the initial cost estimate. The final project cost at (c) in Figure 1 is straightforward to define but may be difficult to pinpoint in practice. The Bothnia Line provides an illustration. Neither the upgrading of Ådalsbanan nor the construction of a marshalling yard in Umeå was part of the formal definition of the project. These costs have been included in the estimate of final costs since it would not be feasible to operate traffic in the way it is now done without these extra activities.
The starting point for a project, (a) in Figure 1, is both conceptually and empirically challenging to pinpoint. Much of the literature in the field, including Flyvbjerg et al. (Reference Flyvbjerg, Ansar, Budzier, Buhl, Cantarelli, Garbuio and Glenting2018), use the point of time when a project is first included in an investment program as its starting point. They note that the real decision to build a project often has been made earlier.
The seven projects in the present study were, however, initiated outside the ordinary planning process. Specifically, the government asked the parliament to accept bills in 1991 and 1993 (cf. Sections 3.1 and 3.2, respectively). Five of the seven projects later came to be parts of investment programs, but not until long into the planning process.
Even though the parliament gave the go-ahead for the seven projects in the early 1990s, the analysis in Section 4.2 is cautious in the choice of starting year for the ex ante–ex post cost comparison. For the City Tunnel and the Bothnia Line, the government asked for extra cost information before formally approving them. It is therefore the cost at the time when the final design was approved that is used. In Table 1, the City Tunnel’s first estimate is therefore SEK 4.8 rather than SEK 3 billion and SEK 9.8 rather than SEK 7.9 billion for the Bothnia Line. Similarly, the Third Track was part of the 1991 agreement between the different public sector tiers in Stockholm. The first and formally approved surface solution was however abandoned, and the City Line came to be built. It is therefore the estimate for the latter design that is used as the project’s baseline cost. Similarly, it is the formally accepted cost for v. 2 of the Bypass that is used as a baseline, even though this version is very much like v. 1. If the very first cost estimates had been used, the cost increases estimated in the next section would have been larger.
The seven projects do not represent a random selection of infrastructure schemes. Jäderholm (Reference Jäderholm2020) is a consultancy report which was to focus on projects that include more tunneling than average. Moreover, the projects are larger than average-sized projects in Swedish infrastructure planning. This means that the numerical results in the next section may not be generalized to average infrastructure projects. Instead, the discussion in the article provides indications of the type of situation that may appear in infrastructure planning. As more and more projects in metropolitan regions are built underground to avoid situations with competing interests for access to land on the surface, it is particularly important to pay attention to these challenges for tunneling projects.
Several other large projects have, however, been implemented outside the ordinary planning process. One spectacular example is an 8.7 km-long double-track tunnel through the Hallandsås ridge. Planning commenced in 1975, but the line was not opened for traffic until 2015 with huge cost overruns.Footnote 5 In Gothenburg, another large tunneling project is under construction, seeing substantial cost increases before construction started. Moreover, the ongoing discussion about building a high-speed railway provides higher construction costs for every new update of the physical planning.
4.2 From nominal to real cost increases
Before establishing the size of cost overdraws, it is necessary to transfer cost information in Table 1 from current to fixed prices. Two different techniques are used. The first uses the consumer price index (CPI), which controls for the way in which prices in a basket of consumer goods and services change over time. This is referred to as the taxpayer perspective since it explains if, and by how much, tax revenue must be raisedFootnote 6 to pay for increasingly expensive construction. The second means for disentangling nominal from real cost increases is to use a sector-specific index.
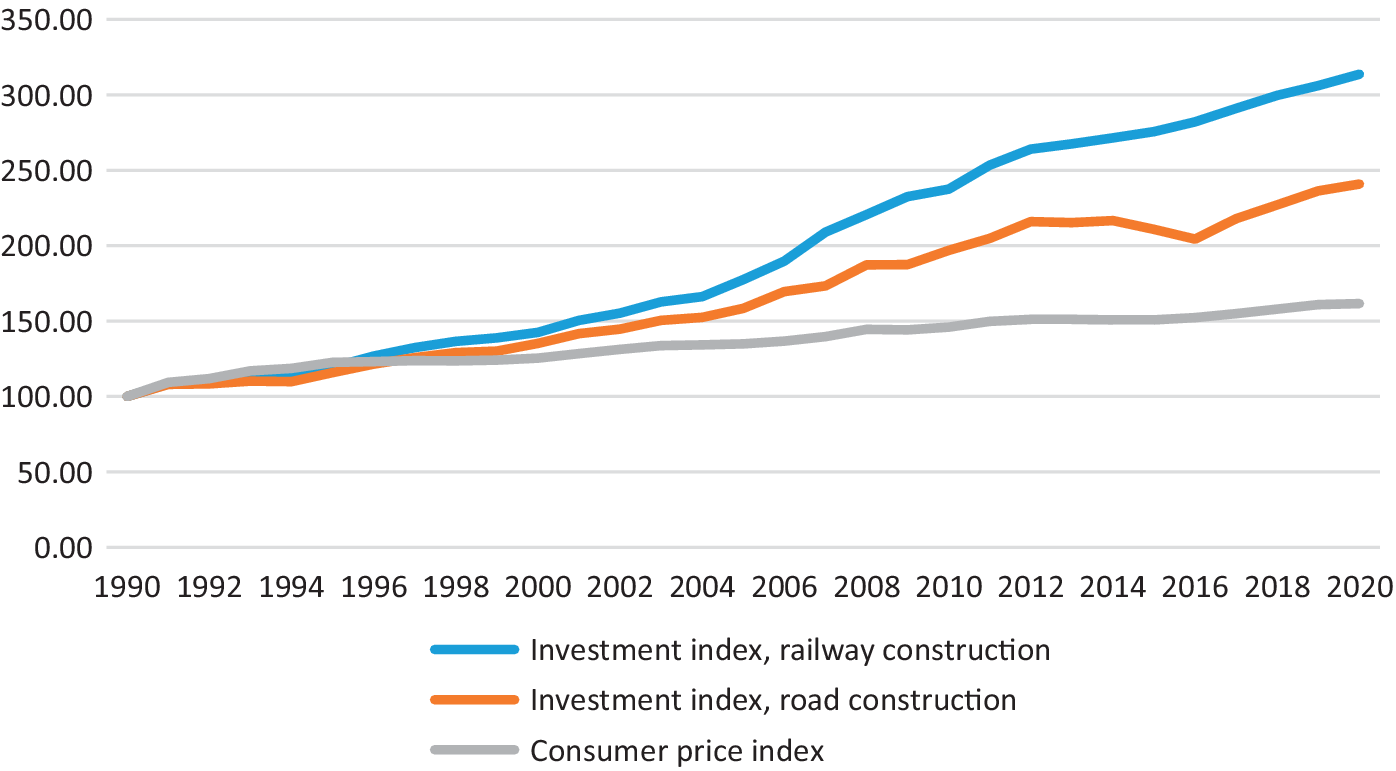
Figure 2 shows CPI and sector-specific indices for railway and road construction. Prices for inputs used by the construction industry obviously increase much faster than consumer costs do. Specifically, costs for building new railways trebled over this 30-year period, road construction costs increased by a factor of 2.4, and consumer prices increased by a factor of 1.6.Footnote 7
Price index changes between 1990 and 2020. Sources: CPI from Statistics Sweden and investment indices from the IM’s home page.

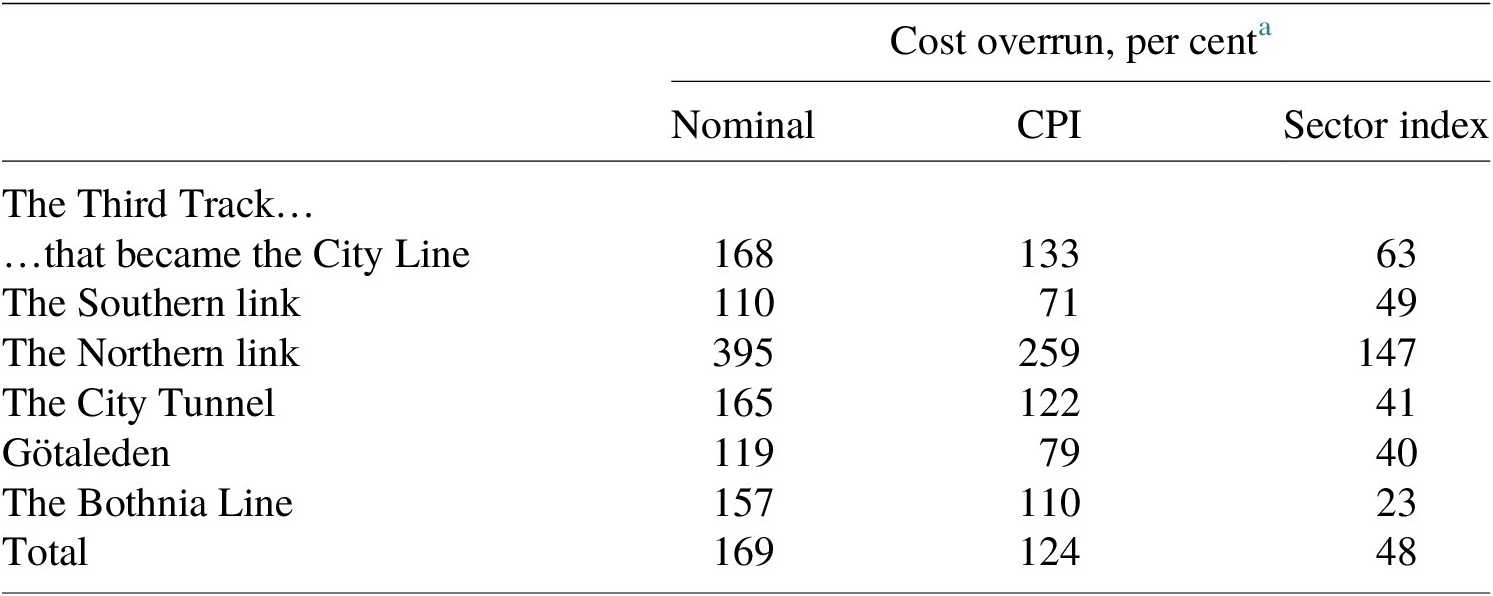
These indices are applied to distinguish between nominal and real cost increases for the seven projects in Table 2. As an example, the cost for the City Line tunnel increased by 168 per cent in nominal terms. In real terms, this corresponds to costs increasing by 133 per cent from a taxpayer perspective, that is, using CPI, while costs increased by 63 per cent when using the railway-specific index.
The seven projects.

Note: Nominal cost increases in Table 1 converted to real cost increases for each project using the consumer price index and specific road/rail index.
Abbreviation: CPI, consumer price index.
a ((Final cost/estimated cost)−1) × 100.
Taken together, the table shows that the nominal costs on average are 169 per cent higher than the initial estimate for the six concluded projects. In real terms, and using CPI, costs increased by 122 per cent and by 48 per cent when using the sector-specific index. These differences follow directly from the indices illustrated in Figure 2.
Table 3 provides additional information about the cost escalation by introducing the tendered cost, that is, at (b) in Figure 1. There is a degree of uncertainty about the tendered cost, not least since most projects have been tendered in several separate contracts. The estimate is, however, sufficiently precise to lend itself to an obvious conclusion: While the average construction cost is 124 per cent higher than the first estimate for the six projects that have opened for traffic, only 12 per cent units are due to changes during the final stage of the process, that is, between t 9 and t 10 in Figure 1. It should be noted that both the total cost increase and the share thereof emanating from the construction phase will increase once the Bypass is opened for traffic.
Nominal costs (a) at the start of the process, (b) when projects are tendered and (c) final.

Note: Invoiced costs. Real cost increase using consumer price index.
5. Why costs increase: the construction phase
Table 3 establishes that most cost escalation takes place during the projects’ early period, but for reasons that will become apparent, cost increases during the implementation of projects are first scrutinized. Figure 1 illustrates the fact that construction is implemented in two stages: the IM first tenders a consultant to prepare documentation for the second stage, the tendering of the construction per se. Section 5.1 describes some important features of the first of these two stages, while Section 5.2 establishes the (im-)possibility to follow up construction costs.
5.1 Engineering and conservatism
Procurement and contracting within the construction industry are constrained by rules and procedures established and upgraded over long periods of time by representatives of both buyers and sellers of the industry’s services. The Unit Price Contract format (UPC, Bajari et al., Reference Bajari, Houghton and Tadelis2014), by engineers referred to as Design-Bid-Build,Footnote 8 is frequently used. Rather than specifying the output of an assignment – a new road or railway with specified qualities – these contracts include a Bill of Quantities indicating precisely which activities are to be implemented and in which quantities. Once all activities have been completed, the road or railway is supposed to be ready for use.
A consultancy is tendered to undertake engineering, inter alia to prepare the Bill of Quantities, using its experts in the different types of activities that are necessary for preparing for the upcoming project. An example of a Bill is given in Appendix. A builder’s bid for this type of contract comprises one unit price for each quantity – which explains the UPC acronym – and the vector product of prices and quantities generates the total bid.
While this contract format has several advantages, one drawback is that it makes the implementation process rigid. The builder is not at liberty to improve the way the work is done compared to the specification in the Bill of Quantities without negotiations with the buyer. If a firm comes up with suggestions for truly innovative ways to do the job, the IM may have to reject that proposal or re-tender the project.
Restrictions on adapting the way work is done may be one reason for the sector’s large cost increases relative to consumer prices described in Figure 2. Contrary to most industrial production, it is, for instance, not feasible to substitute inputs which become more expensive. The same rigidity is introduced by the fact that most multiyear project contracts are indexed to changes in the price of inputs. This is a way to let the IM take the exogenous price risk, eliminating builder incentives to take measures during the construction phase to avoid cost increases. These features of the UPC contracts may also contribute to that the construction industry is a productivity laggard compared to other sectors of the economy (Salomonsson et al., Reference Salomonsson, Nilsson and Nyström2019).
For projects that include tunneling, the engineering tasks specified in the Bill of Quantities must be based on correct information about the ground at the construction site. Since many years, below-surface engineering studies use geotechnical techniques for this purpose, meaning that holes are drilled. Originating in the benefits of identifying the most likely sites to find oil when drilling wells, a set of techniques referred to as geophysical engineering has gradually been developed. This is complementary to geotechnical surveys. Geophysical data may, for instance, identify places where boreholes seem to be most desirable. The high local quality of the geotechnical data helps calibrate the low-resolution geophysical images and proves large-scale images of the ground. In combination with geological data, these results are valuable for evaluating the quality of the rock and to suggest how subsurface work should be implemented to reduce the risk of unexpected challenges both during and after construction.
Although geophysical methods are involved along with geology and geotechnics when investigating the underground in many countries (Reynolds, Reference Reynolds2011), Malehmir et al. (Reference Malehmir, Zhang, Dehghannejad, Lundberg, Döse, Friberg, Brodic, Place, Svensson and Möller2015) provides one of the few examples of its use in Sweden. The Bypass project illustrates the consequences of inadequate pre-studies. That project was stopped for several months during 2019 because of problems pertaining to rock quality. Better ex ante engineering of the ground may have reduced the risk for subsequent delays and cost increases. Even if the inclusion of geophysical techniques would increase the costs for contract preparation, it may be balanced by cost savings during implementation.
5.2 The (im-)possibility of following up on construction costs
Compared to the massive cost increases before tendering, the average 12 per cent increase in real costs during construction seems modest. Moreover, the reality of digging and blasting may by nature bring unpleasant surprises. This observation does, however, make it even more relevant to try to establish if some of these surprises can be avoided. For this purpose, follow-ups are inevitable.
However, today it is not feasible to follow up on the micro components of projects tendered by Sweden’s IM.Footnote 9 While there are records of all contracts that are signed, as well as meticulous handling of incoming invoices, there is at present no way to link prices and quantities ex ante (the contract) to ex post (the invoices) without manual detective work. Moreover, large projects typically comprise several separate contracts, making ex post reviews even more challenging.
Road and railway engineers frequently assert that all projects are unique, meaning that there is nothing to be learned from follow-ups. This may be a valid argument on an aggregate level, for instance if the seven projects in this article would be used for developing proposals for better implementation approaches. However, the claim is not correct on the micro level. The detailed nature of the Bill of Quantities in UPCs establishes the way in which an entrepreneur is supposed to implement projects. Subsequent invoices and payments are not made against estimated but the actual quantity of work, which must therefore be specified in each invoice. Moreover, the IM’s project leader monitors the invoices on a random basis, meaning that the buyer and seller of works typically agree about total costs.
Taken together, this means that the scope to follow up on performance is vast. Since this is currently not feasible, it is, for instance, not possible to establish the significance of tunneling costs for overall cost overdraws in the seven projects.
6. Why costs increase: the early phase
Planning and implementation of new projects are affected by changes in society at large which may contribute to cost overdraws. Section 6.1 addresses this aspect while Section 6.2 summarizes an official ex post review of the Bothnia Line, one of the few studies of this nature. Section 6.3 considers if BCA may play a role for cost overdraws whereafter Section 6.4 suggests a simple model framework based on the logic of the planning process per se as a way to understand the huge difference between actual and estimated costs.
6.1 Cost increases generated by external forces
Not least during long periods of gestation, changes which are external to the parties in the process may have consequences for project costs. One example is that the focus on the environmental side effects of construction projects grew during the planning of the seven projects, subsequently expressed in a new environmental code (Bill 1997/98: 45). Moreover, rules and regulations for tunnel construction were tightened. Bill 2005/06:168 (“Safety in tunnels”) affected costs both because of new tunnel standards and due to stricter requirements on disturbances from traffic in tunnels.
Another change occurred when the Act that triggered a change in policy (cf. Section 3.1) was reversed. Bill 1995/96: 220 established that the benefits of new roads and railways do not generate public sector revenues. A new Act therefore sent the formal responsibility for financing infrastructure investment back to the parliament’s annual appropriations Bill. In this way, lawmakers are supposed to be given a better overview and greater influence over priorities than when complementary funding from regions and communities, ad hoc loans, or other financing mechanisms is used. One consequence was that responsibility for planning and implementation of some of the seven projects gradually came to be incorporated into ordinary long-term infrastructure planning. This may have had consequences for at what time allocations were made available and for the time it took to build new infrastructure.
What here is labeled external changes have some resemblance to what was referred to as evolutionist explanations in the initial review of literature. At least some of these consequences could have been foreseen. Public protests during the period, for instance, signaled that the public’s position toward trade-offs between “hard” and “soft” policy aspects was changing.
6.2 An external review of the Bothnia Line
The description of the six metropolitan projects is based on official documents and interviews. The Bothnia Line has also been subject to a formal ex post review; compare Riksrevisionen (2012). One topic for that examination was the project’s cost increase from SEK 8.2 (1997) to SEK 16.8 billion (2010) (Riksrevisionen, 2012, Table 5.1).Footnote 10 The audit concluded that the IM’s original estimate omitted necessary upgrades and alterations in adjacent networks, first and foremost on the existing southern part of the system, Ådalsbanan. Furthermore, the length of bridges and tunnels increased significantly between the original assessment and the line that was built. The audit concluded that initial cost estimates were deliberately kept low by the IM.
The government’s overriding purpose with the project was to improve the efficiency of traffic to and from the country’s northern parts, thereby increasing the competitiveness of the region’s business community. The review concluded that this purpose was not met. One reason was that the initial target for travel time – 5 h between Umeå and Stockholm – neither was nor will be achieved. The IM did not provide appropriate documentation of this aspect before the decision to build the Bothnia Line was made. This is said to be particularly remarkable considering that the IM shortly after the decision to build the line radically revised its travel time forecasts.
Several previous audits have pointed to the problem with cost increases. The most recent audit, Riksrevisionen (2021), testifies that the repeated critique has not had any discernible consequences. One possible reason is that neither the auditors nor anyone else have had the competence, or had access to relevant information, to see through the details of construction contracts. The Bill of Quantities and the subsequent invoices are fully controlled by the IM’s project manager and the firm doing the job. Importantly, the few people at the Government Office who are operationally liaisoning with the IM are not hired to have this type of competence. Ex ante cost estimates are a black box for outside parties.
6.3 The role of BCA for cost overruns
Flyvbjerg and Bester (Reference Flyvbjerg and Bester2021) show that the results of ex ante BCAs frequently are in error; costs are systematically underestimated, and benefits overestimated. With this as the empirical basis, they define “the cost-benefit fallacy” as a situation in which individuals behave as if benefit–cost estimates are largely accurate and unbiased, when in fact they are not.
This observation would provide a relevant background for the present study if BCA results were instrumental in the decision-making process. The only BCA that was formally part of any decision process was, however, included in the Bothnia Line inquiry (SOU, 1996, p. 95). Costs and benefits were then approximately equal; final costs came to be higher and benefits lower than anticipated.
A BCA published in 2006 established that the net present value of the Third Track was negative (Citybanan, 2006). In 2001, an audit reviewed the use of BCA in infrastructure planning. Nilsson (Reference Nilsson2000) produced a background report discussing the social costs for and benefits of the City Tunnel. The main conclusion was that BCA results did not feature in the stated motives for the tunnel and that the project, at the cost level at that time, was not socially profitable. These assessments were made after the decision to build was taken. It has not been possible to identify BCAs of the Southern or the Northern Link nor Götaleden.
A possible motive for policymakers to accommodate increasing costs during projects’ gestation periods is that benefits are thought to exceed construction costs. There is, indeed, one example of this interpretation that may be relevant. In approximately year 2000, 17 years after the first proposal, a BCA of the Bypass indicated that project benefits exceed costs. That first assessment is not in the public domain, but an updated BCA from 2012 estimated investment costs to be SEK 31.9 billion and the present value of benefits SEK 81 billion; cf. Förbifarten (2012). While this indicates that even a very costly Bypass is worthwhile to build, the assessment was prepared long after that the original decision was made.
The discussion about the relevance of BCA for decision-making is also related to the role of different parties involved in the process. The initial phase of the seven projects, which is the stage when projects are given the green light and in which the largest cost increases occur, is driven by representatives for the electorate. Texts and cost estimates are prepared by road and railway engineers officials at the IM’s regional offices while no economists have been part of these provisions.
In their critique of BCA, Flyvbjerg and Bester (Reference Flyvbjerg and Bester2021) show that cost underestimation is more common than benefit overestimation. This observation should be cast against the fundamental transparency differences between the costs and benefits in a BCA. Transport sector benefits are based on traffic forecasts, and there is an extensive literature on traffic forecasting; compare Eliasson et al. (Reference Eliasson, Börjesson, van Amelsfort, Brundell-Freij and Engelson2013) and Andersson et al. (Reference Andersson, Brundell-Freij and Eliasson2017) for the Swedish context and a recent survey published by NCHRP (2020). In contrast, Section 5 established that construction cost estimates are notoriously impenetrable, at least in Sweden. The systematic differences in benefit and cost bias may therefore derive from that it is not possible to scrutinize and question cost estimates while the analytical quality and transparency of benefit estimates are high.
Irrespective of BCA results, elected decision-makers are commissioned to prioritize projects according to their political beliefs. Nellthorp and Mackie (Reference Nellthorp and Mackie2000) provide an example where project priorities in Britain are not in conflict with BCA results. But starting with Nilsson (Reference Nilsson1991), several articles have shown that projects are typically prioritized irrespective of their social rate of return; Eliasson et al. (Reference Eliasson, Börjesson, Odeck and Welde2015) is a recent application to the Scandinavian context. The prime function of BCA today is therefore to function as an instrument for transparency, making it clear that some decisions are irresponsible. Cost overruns appear even if projects are not preceded by a BCA and if a BCA is prepared, the economist becomes the slave on the triumph chariot.
With that statement in mind, it is still obvious that the huge cost increases established in Section 4 have severe consequences for the results of infrastructure BCA at large. Economic analysis is supposed to provide a guide for project prioritization which happens at t 4 in Figure 1. Cost estimates of new projects are based on an even earlier phase of the planning process when many design issues remain to be considered. The risk that BCA results overestimate project rate of return is therefore obvious. The differences of cost overdraws between projects that have been established also introduce an obvious risk that project priorities turn out to be biased.
6.4 Cost increases and the planning process
Flyvbjerg (Reference Flyvbjerg2021) asserts that political bias drives cost overruns. But how reasonable is it that decision-makers seek to trick the rest of society into believing that projects are worthwhile and that trusting early cost estimates is reasonable? And if the political bias hypothesis does not explain why costs increase for the present seven cases, what would rather rationalize projects being implemented despite costs increases? What makes governments of both center-right and center-left majorities carry on?
I suggest that the logic of the planning process provides an under-estimated reason for cost overdraws. The critical decision in this process is the prioritization of projects in the investment program, represented by the arrow at (a) in Figure 1. The IM’s regional officers know that the lower the initial estimate of construction cost, the higher is the chance that a project is included in the program. Furthermore, with low costs, more projects can be squeezed into the pre-set budget for the 12-year program.Footnote 11 The government of the day will then be able to posture with their grand ambitions for the future when making the program public.
This logic is further supported by the poor understanding of cost drivers and pitfalls of completed projects discussed in Section 5. 2. In the absence of systematic information about what historically has been working well or not, the early-stage preparation of new projects is fully reliant on the IM’s engineer(s).
This logic would not provide a sufficient explanation if future program revisions would change the priority order in the face of increasing costs. There are, however, few if any examples of increasingly costly projects that have been excluded or substantially delayed relative to the program’s priorities. Being aware of this, neither politicians nor IM officials have reasons to provide prudent cost estimates at the early stages of the process.
The seven projects in this review deviate from projects included in the regularly updated infrastructure programs. The incentives generated by the planning process are however the same as for the extraordinary measures. Once the government has sent a bill to the parliament in the way described in Section 3, the chance – or risk – that subsequent cost increases may result in the original decision being canceled is slim.
From a political perspective, regions and communities regard a project in an investment program on “their” turf to be a gift from the national government, which foots the bill. The program is seen to be a promise and inevitable protests from the beneficiaries makes any backtracking by the government politically costly. Cost increases therefore become an integral part of the planning of new infrastructure, not primarily as a means for deception but because of the way in which the process is organized.
Social psychology offers a model with some resemblance to this assertion. The “foot in the door technique” is a compliance tactic that assumes that agreeing to a small request increases the likelihood of agreeing to subsequent requests. If an initial small request is accepted, the person who agrees to this finds it more difficult to refuse a bigger one (Freedman & Fraser, Reference Freedman and Fraser1966).
The process also involves a degree of dynamic inconsistency. This refers to a situation in which a decision-maker’s preferences change over time in such a way that one belief can become inconsistent with the opinion at a later point in time (Loewenstein & Prelec, Reference Loewenstein and Prelec1992). The projects’ extended gestation periods provide some substance to this explanation in that high priorities in today’s investment program may not materialize in costly(ier) spending for many years yet. It is not even certain that today’s political majority will survive and pay the cost once implementation starts.
Anecdotes about two of the projects cast additional light on these aspects. Allegedly, the Bothnia Line was approved as part of political horse trading: The ruling party gave the project a green light in return for an opposition party voting for the government on a completely different issue. Similarly, the City Tunnel was said to be a price paid by a senior central government figure for the support of the same party’s representatives in the southern region in a different context.
While it is not feasible to corroborate the validity of these stories, they provide an additional indication of that costly investment projects may be politically cheap. Moreover, the fact that the first part of the quid pro quo has been delivered – the political majority has had its issue approved by the opposition party – is more difficult to back on the “quo” because of increasing construction costs. After a long period of time with central-left political majority, the last 50 years has seen several shifting majorities, today with a politically weak minority government. This strengthens the reasons for any government to use “gifts” of this nature for pushing through important changes in other areas.
7. Conclusions
Building new infrastructure may always come with negative surprises. Reasons include the subsurface conditions for tunneling projects, complex interactions with existing installations in metropolitan areas, and so forth. Even though construction cost increases during the planning and implementation process are inevitable, the article has established that the cost overdraws for seven large road and railway projects are excessively high.
Three major reasons have been highlighted. One is that it presently is not feasible to base early-stage cost estimates for new projects on a robust platform of historical cost information. Second, the industry is conservative in its thinking about pre-studies and contract designs. One example is the persistent use of rigid contract structures that makes it more difficult for builders to adapt implementation to the actual rather than the pre-conceived situation at the construction site.
The third category of explanations of cost overruns is related to politics. Flyvbjerg (Reference Flyvbjerg2021) suggests political bias to be pervasive in large projects. I argue in favor of a soft version of this hypothesis. The decision to establish an investment program, that is, a prioritization of projects for the coming years, provides incentives that reduce the significance of costs. The first part of this is that low-balling on costs before the program has been established benefits both policymakers and the IM’s regional representatives that prepare the cost estimates. Once the program has been established, the second part of the incentives kicks in. The further into the planning, the more obvious will the shortcomings of the initial project versions become. It will therefore be necessary to adjust project design, and this will always mean that it will cost more.
The reason for projects not being shelved is to avoid political wrangling. The central government foots the bill while regions and communities that benefit from having new roads or railways built on their turf consider the program to be a promise. Even increasingly expensive infrastructure may be cheap in a larger jigsaw of policy making. The political bias is, in this interpretation, related to the institutional setting that imbeds sector decisions.
Schumpeter (Reference Schumpeter1942) asserts that political elites fight for majority and that the ultimate definition of democracy is that the losing party concedes, and that power is transferred to the winner. He maintains that the people voting for the different elites is not aware of the particulars of policymaking and that the superficial signals sent by the parties affect which majority will win, not the facts of the situation at hand.Footnote 12 In everyday politics, there are also many “reasonable” explanations that may placate the electorate. A number of these were referred to as evolutionist justifications in the literature review and Section 6.1 provides examples from the present context. This means that the incentives to reduce the risk for cost overdraws are meager within the status quo framework.
It is still embarrassing for the incumbent party, irrespective of political leaning, that infrastructure costs run amok. There is therefore a long-run interest across the political spectrum to reduce the prevalence of cost overruns by changing the institutional framework. And there are many examples of policymakers tying themselves to the mast to further the greater good. The Maastricht restrictions on budget deficit and aggregate public-sector debt are perhaps the most obvious example. Footnote 1 provides domestic examples of two agencies that have been removed from the day-to-day politicking despite that this makes the incumbent’s job more cumbersome.
A profound change of the planning framework would be to reduce the length of the program from three to two political cycles, that is, from covering eight rather than 12 years. This would not change the incentives that have been elaborated on but would reduce the scope for stuffing the program with projects to placate different interests. It would also add time to consider the design of new projects and reduce the risk for over-optimistic solutions. A more marginal change would be to instruct the IM to start using more flexible contract formats. And as long as the UPC is the workhorse contract format, the IM could be instructed to improve its capacity to follow up on contract costs. Since all relevant information is available in the IM’s different databases, it would not be costly to institutionalize micro-level cost follow-ups. The benefits of better transparency would inform both the public and the political majority at each time.
Many projects come to cost more than anticipated, but the Arlanda Airport rail link, a Swedish PPP project which was decided in 1993 and with traffic starting in 2000, did not. This is a spectacular example of a tunnel beneath the airport terminals that was implemented outside the standard planning process without cost increases for the government and opening on time. If anything, this demonstrates that cost increases in tunnel construction are not inevitable, compare Hultkrantz et al. (Reference Hultkrantz, Karlström and Nilsson2008).
Competing interests
The author declares none.
A. Appendix: Procurement and design of investment contracts
Sweden joined the European Union in 1995. When the seven contracts were tendered from 1997 and onwards, the Union’s framework provided the basis for how procurement was to be done. Except for the legal framework, procurement and contracting within the construction industry are constrained by negotiated rules based on procedures established and upgraded over long periods of time by representatives of both buyers and sellers of the industry’s services. One example is the construction industry’s use of Unit Price Contracts (UPCs). Each UPC specifies precisely which activities are to be implemented and in which quantities. Once all activities have been executed, the road or railway is supposed to be ready for use.
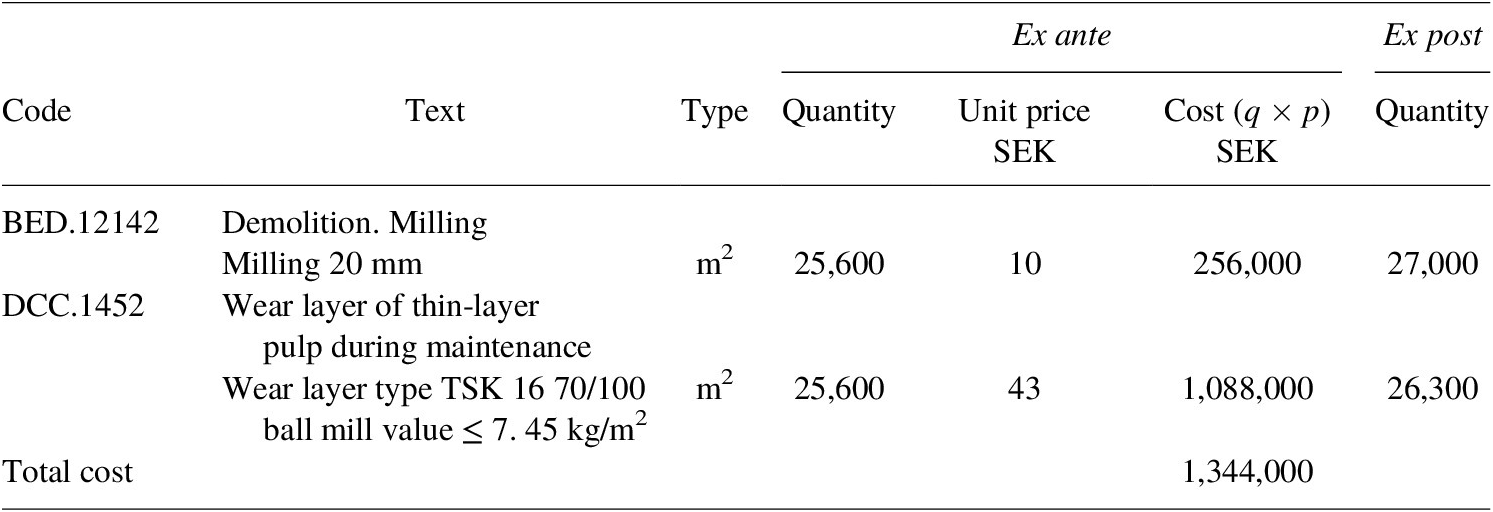
Table A1 provides an example of a Bill of Quantities for a UPC pavement renewal contract. This document is at the core of the Quote for Bids. The example includes only two of the activities necessary for the whole assignment, each activity represented by one line in the table. The first activity has B in the first position of the code specifying the task. Code B comprises all activities referred to as “Preparatory and Assistance Works, Sanitation, Removal, Disassembly, Demolition, Clearance”. Another two positions with letters, plus – in this case – five numerical positions are used to establish that the activity requires that the surface is milled to remove 20 mm of the existing blacktop over an area of 25,600 m2 (the “type” and “quantity” columns). This is the buyer’s specification of the activity. This builder’s bid is SEK 10/m2, meaning that the total cost for implementing this activity is SEK 256,000.
The second activity starts with the letter D which includes all types of work on or with the surface. Code DCC comprises many different types of pavements. In combination with the numerical code, the example in the table specifies a wear layer of type TSK 15 with several further quality specifications. The new pavement covers the same area as the old pavement that is to be milled. The bidder asks for SEK 43/m2 to do this job, which totals slightly more than SEK 1 million.
Two activities of a pavement renewal contract’s quantity list.

Each construction firm participating in the contest submits one unit price for each activity, and the aggregate value of each bid is the sum of unit prices times quantities. The bid in the table totals slightly more than SEK 1.3 million. The lowest bidding sum is typically awarded the contract.
This way to tender works means that the buyer holds the risk for any changes of quantities that must be made of ex ante estimates. In the table, this has been exemplified with the ex post fact that both the quantity of milling and the area of the new blacktop being slightly higher than estimated in the winning bid. The builder is paid for actual, not estimated quantities.
The tendering agency must also pay for any extras, that is, any additions to the original work description. This would comprise a completely new activity, corresponding to another line in the Bill of Quantities. The unit price must in this case be negotiated after that the original contract is signed.
The challenge for the bidder is to estimate the unit cost for each activity. The chance of winning a contract is obviously lower the higher the unit price. The other side of this trade-off is that a low bid exposes the bidder to the risk of implementing the assignment at a loss. Except for the uncertainty of the level of the unit price, the buyer of the services bears the brunt of all risk. Milgrom and Roberts (Reference Milgrom and Roberts2000) provide a lucid account of incentive and welfare aspects of different ways to design contracts.