Introduction
Clay minerals are crucial for soil function as they contribute significantly to soil-structure development, cation exchange capacity, and stabilization of organic carbon. Furthermore, fine clay fractions also serve as indicators of geochemical reactions occurring in soils, providing valuable insights into pedogenesis. Therefore, a detailed characterization of fine minerals helps to better understand how soils function and evolve.
In temperate climates, the clay mineralogy of soils is composed primarily of inherited clay minerals from the parent material due to the moderate degree of weathering that limits the kinetics of neoformation (Pédro, Reference Pédro1987). Most of these inherited clay minerals belong to the 2:1 type, undergoing interlayer modifications during pedogenesis (e.g. cation exchange, depletion of K+ in mica-illite layers, and aluminization of swelling clay layers) (Pédro, Reference Pédro1983). Consequently, the clay mineralogy of temperate soils most often consists of several types of mixed-layered minerals (MLMs), which can consist of up to four types of 2:1 layers (e.g. illite-smectite-vermiculite-chlorite; Jackson et al., Reference Jackson, Whittig, Vanden Heuvel, Kaufman and Brown1953). Due to this significant level of complexity, determining the role of clay minerals in the past and present evolution of soils is challenging, not least because identifying them remains difficult even after several decades (Gieseking, Reference Gieseking1975).
Soil clay minerals are generally characterized by the proportion and mineral composition of the <2 μm fraction in a given soil horizon (Rich and Thomas, Reference Rich, Thomas and Normax1960). Of the numerous mineralogical descriptions of the <2 μm fraction in temperate soils in the literature, the pioneering work of Jackson et al. (Reference Jackson, Whittig, Vanden Heuvel, Kaufman and Brown1953) was the first to highlight the significant heterogeneity in the clay mineralogy of temperate soils. Based on X-ray diffraction (XRD) analyses of sub-fractions extracted from the <2 μm fraction by sequential size fractionation (Jackson et al., Reference Jackson, Whittig and Pennington1950), several discrete and mixed-layer minerals (MLMs) were identified. An increasing diversity of 2:1 layers constituting random MLMs as particle size decreased was also in evidence (up to four types of 2:1 layers were found in the <0.08 μm sub-fraction). A similar sequential fractionation approach, with additional quantitative analysis provided by elemental analysis, was used later (Laird et al., Reference Laird, Barak, Natar and Dowdy1991; Laird and Nater, Reference Laird and Nater1993). Results showed the predominance of MLMs with 2:1 layers (i.e. illite-smectite MLMs) in the <2 μm fraction of the temperate soil studied. These studies demonstrated the benefit of sequential size fractionation for identifying the smallest clay minerals, which are predominantly interstratified and have the lowest coherent scattering domain sizes (CSDS) values. However, due to its time-consuming nature, this procedure was rarely used for several decades, during which time the complex crystal structures of MLMs in temperate soils remained to be investigated. Thanks to progress in XRD profile modeling for quantifying complex clay mineralogy with MLMs in diagenetic or hydrothermal environments (Drits et al., Reference Drits, Lindgreen, Sakharov and Salyn1997a; Inoue et al., Reference Inoue, Lanson, Marques-Fernandes, Sakharov, Murakami, Meunier and Beaufort2005; Lanson et al., Reference Lanson, Sakharov, Claret and Drits2009), as well as benefiting from sequential fractionation to emphasize observation of the smallest clay minerals, an approach that couples these methodologies was developed for soils (Hubert et al., Reference Hubert, Caner, Meunier and Ferrage2012). This approach provided new insights into the clay mineralogy of temperate soils, including: (1) the description of kaolinite-illite MLMs (Hubert et al., Reference Hubert, Caner, Meunier and Ferrage2012; Dumon et al., Reference Dumon, Tolossa, Capon, Detavemier and Van Ranst2014; Viennet et al., Reference Viennet, Hubert, Ferrage, Tertre, Legout and Turpault2015; Bakker et al., Reference Bakker, Hubert, Wander and Lanson2018); (2) the structures of natural hydroxy-interlayered minerals (HIMs) (Viennet et al., Reference Viennet, Hubert, Ferrage, Tertre, Legout and Turpault2015); and (3) the contributions of three components of 2:1 MLMs that are randomly interstratified (R0) in some temperate soils (Viennet et al., Reference Viennet, Hubert, Ferrage, Tertre, Legout and Turpault2015; Bakker et al., Reference Bakker, Hubert, Wander and Lanson2018; Bakker et al., Reference Bakker, Lanson, Findling, Wander and Hubert2019). However, this approach has only been implemented on a limited number of samples so far, and it probably has much more to reveal about soil-clay mineralogy.
A detailed description of the mineralogy of clay is particularly interesting as an indicator of changes in soil properties in long-term experiments. Long-term experimental sites established over a century ago provide a unique opportunity to study the impact of past and present human activities on soils (e.g. Rothamsted, Versailles, and the Morrow Plots). During these exceptionally long study periods, clay minerals and their evolution serve as valuable markers of changes in soil function in response to human influence. To this end, a detailed understanding of the original clay mineralogy is first required. This initial clay mineralogy is typically collected at the start of designing the experimental site. However, given that these sites can last for decades or even a century, reassessing the clay mineralogy as progress is made can significantly improve the initial characterization and interpretation of the associated evolutionary mechanisms (Tye et al., Reference Tye, Kemp and Poulton2009; Loveland et al., Reference Loveland, Wood and Weir2018).
The 42 plots of Versailles, established in 1928, are among the oldest heritage sites in the world to study the role of anthropogenic pressures on soil function. The original objective was to study the effect of various agricultural inputs and fertilizers on the evolution of the soil’s physical, chemical, and physicochemical properties in the absence of vegetation (van Oort et al., Reference van Oort, Paradelo, Proix, Delarue, Baize and Monna2018). The most recent description of the mineralogy of the site’s original clays was provided by Pernes-Debuyser et al. (Reference Pernes-Debuyser, Pernes, Velde and Tessier2003). More recent work involving XRD profile modeling of the <2 μm fraction, without sequential fractionation, on a nearby site with the same soil (Hubert et al., Reference Hubert, Caner, Meunier and Lanson2009) showed that this approach provides a more comprehensive description of clay mineralogy, particularly with regard to MLMs. With this in mind, the primary objective of the present article was to re-investigate the mineralogy of the 1929 soil sample from the 42 plots in Versailles, in order to demonstrate how the method can refine the description of its clay mineralogy. The results were then compared with the clay mineralogy of temperate soils obtained using a similar approach. In a second step, the similarities in the composition and structure of the clay minerals in temperate climates were discussed, with particular emphasis on the prevalence of illitic clay phases in temperate soils.
Materials and methods
Long-term 42 plots experiment at INRAE Versailles, and soil-surface horizon characteristics
The soil-surface horizon studied (upper 25 cm) is from the long-term 42 plots experiment of INRAE Versailles (48°48’12.8"N, 2°05’09.9"E), which was set up in 1928. The soil is a Haplic Luvisol (WRB, 2015), a silt-loam textured soil developed in loess, which is representative of cultivated soils in northwestern Europe. The experimental site (16 m × 20 m) consists of 42 plots (2 × 2.5 m), including 16 duplicate plots receiving various chemical treatments (organic, phosphate, potassium, and nitrogen fertilizers, neutral salts, and basic amendments), and 10 reference plots with no inputs (van Oort et al., Reference van Oort, Paradelo, Proix, Delarue, Baize and Monna2018). The sample studied, from the soil archive of the long-term 42 plots experiment (INRAE Versailles, France), was collected in a reference plot (no. 9) in 1929, shortly after the experiment began, and stored as an air-dried sample for 90 years.
The physicochemical characteristics of the soil surface horizon in the reference plot in 1929 were measured by Pernes-Debuyser and Tessier (Reference Pernes-Debuyser and Tessier2002) and Pernes-Debuyser et al. (Reference Pernes-Debuyser, Pernes, Velde and Tessier2003). In brief, the sand (50–2000 μm), silt (2–50 μm), and clay (<2 μm) fractions represent 22.4%, 58.2%, and 19.4% of the <2000 μm fraction, respectively. The amount of organic carbon is relatively small at 16 g kg-1, the soil pH of 6.3 is close to neutral, and the cation exchange capacity (CEC) at the soil pH (CECsoil) is significant at 15.3 cmol+ kg-1. This is dominated by Ca2+ (87% of the CECsoil) with slight contributions from Mg2+ (8%), K+ (1.3%), and Na+ (0.6%). Exchangeable aluminum was not detected.
Size fractionation
Thirty grams of the air-dried <2000 μm fraction of the 1929 sample was split into three 10 g replicates to estimate the uncertainty of conventional particle-size fractionation into three classes: sands (50–2000 μm), silts (2–50 μm), and the clay fraction (<2 μm). Due to the absence of carbonates and the small organic-carbon content, no further treatment was applied to prevent structural modification of the clay minerals, particularly the highly reactive mixed-layer minerals (MLMs) (Jackson, Reference Jackson1956; Moore and Reynolds, Reference Moore and Reynolds1997; Mikutta et al., Reference Mikutta, Kleber, Kaiser and Jahn2005). The replicates were dispersed in deionized water using fast sonication for a few minutes and passed through a 50 μm sieve to obtain the sand fraction. The <50 μm fraction was then saturated using three repeated cycles with 2 mol L−1 NaCl and washed by dialyzing in deionized water using a Spectra/Por® membrane (MWCO: 6–8000 Da) until chloride-free. The silt fraction as well as the <2 μm fraction, were then collected using a sedimentation technique according to Stokes’ law, with repeated siphoning until the withdrawn suspension became clear. The fractions obtained were then dried at 60°C and weighed.
Following homogenization of the dried, Na-saturated, <2 μm fractions of the three replicates, a starting mass of 2.5 g (hereafter referred to as the ‘bulk <2 μm’ fraction) was sequentially separated into five sub-fractions (<0.02, 0.02–0.05, 0.05–0.1, 0.1–0.2, and 0.2–2 μm). This was achieved using a centrifugation procedure that had previously been employed by Bakker et al. (Reference Bakker, Hubert, Wander and Lanson2018, Reference Bakker, Lanson, Findling, Wander and Hubert2019). The procedure was carried out using a Beckman Coulter Avanti J-30I centrifuge with a JS-24.38 swinging bucket rotor. The sub-fractions were collected using repeated centrifugation cycles until the supernatant became clear (seven repetitions). The centrifuge procedure for each sub-fraction differed in terms of running time and centrifugal force (70, 20, 15, and 15 min at 95,200, 72,000, 12,000 and 6500 g, respectively, for size thresholds of 0.02, 0.05, 0.1, and 0.2 μm). The sub-fractions obtained were then dried at 60°C and weighed. All of the sub-fractions and the bulk <2 μm fraction were Ca-saturated using four saturation cycles with 0.5 mol L−1 CaCl₂ and excess salt was removed by dialysis.
XRD analysis
Oriented preparations of the Ca-saturated bulk fraction and the five sub-fractions were obtained by pipetting slurries of the suspensions onto glass slides and drying them at room temperature. These air-dried preparations (referred to as Ca-Ad) were then collected by XRD at a fixed relative humidity (RH) of 45% (±3%). Ethylene glycol solvation of the samples was then achieved by exposing the same slides to ethylene glycol vapor at 40°C for 48 h (referred to as Ca-Eg), prior to XRD analysis. The XRD patterns were recorded using a Panalytical X’Pert Pro MPD diffractometer equipped with an X’Celerator detector, operating with an angular aperture of 1.021°, coupled with a VTI RH-100 humidity generator device and an Anton Paar THC chamber. The scanning parameters were a step size of 0.05°2θ and a counting time of 6 s per step throughout the 2–53°2θ CuKα₁+₂ angular range. The sizes of the divergence slit, antiscatter slit, and two Soller slits were 0.125°, 0.25°, and 2.3°, respectively.
XRD full-profile modeling of 00ℓ reflections
The full-profile XRD modeling of the experimental 00ℓ reflections over the 2–53°2θ range was achieved using Sybilla© software, which was developed by Chevron (Aplin et al., Reference Aplin, Matenaar, McCarty and Pluijm2006), via a trial-and-error process. This modeling is based on algorithms initially developed by Sakharov et al. (Reference Sakharov, Naumov and Drits1983), and the XRD calculation theory was described by Sakharov and Lanson (Reference Sakharov, Lanson, Bergaya and Lagaly2013). This approach has been applied successfully to the characterization of complex soil clay mineralogy (Hubert et al., Reference Hubert, Caner, Meunier and Lanson2009; Hubert et al., Reference Hubert, Caner, Meunier and Ferrage2012; Dumon et al., Reference Dumon, Tolossa, Capon, Detavemier and Van Ranst2014; Viennet et al., Reference Viennet, Hubert, Ferrage, Tertre, Legout and Turpault2015; Bakker et al., Reference Bakker, Hubert, Wander and Lanson2018; Bakker et al., Reference Bakker, Lanson, Findling, Wander and Hubert2019), as well as to understanding the transformation mechanisms involved (Lanson et al., Reference Lanson, Ferrage, Hubert, Prêt, Mareschal, Turpault and Ranger2015; Dzene et al., Reference Dzene, Ferrage, Viennet, Tertre and Hubert2017), based on direct comparison between experimental and calculated patterns for 00ℓ reflections. Experimental XRD patterns obtained for the bulk <2 μm and its sub-fractions after Ca-Ad and Ca-Eg treatments were modeled following the multispecimen method (Drits and Tchoubar, Reference Drits and Tchoubar1990; Sakharov et al., Reference Sakharov, Lindgreen, Salyn and Drits1999; Drits, Reference Drits2003). In brief, the multispecimen method relies on the difference in layer thickness and structure factor (influenced by the nature, quantity and location of the interlayer cations) of the expandable interlayers produced by the various treatments. The fitting strategy allowed convergence to a single structure model which fits the experimental XRD profiles obtained from both Ca-Ad and Ca-Eg treatments, based on the direct comparison between experimental and calculated 00ℓ XRD reflections and the refinement of structural parameters such as the CSDSs, the composition of discrete and MLM structures (proportions of the different layer types) and their stacking mode (Reichweite parameter R and junction probabilities), as well as their relative proportions. Similar crystal structures and amounts of clay phases (either discrete or MLM) were obtained for the bulk <2 μm, referred to hereafter as the ‘<2 μm fit’ and for each sub-fraction (<0.02, 0.02–0.05, 0.05–0.1, 0.1–0.2, and 0.2–2 μm). The validity of the global structure model was also assessed by: (1) consistency of the structure models with particle size; and (2) comparison of the relative proportions of clay phases in the bulk <2 μm with those calculated from the sum of clay phase contributions in each sub-fraction, weighted by relative mass (referred to hereafter as ‘<2 μm calc.’).
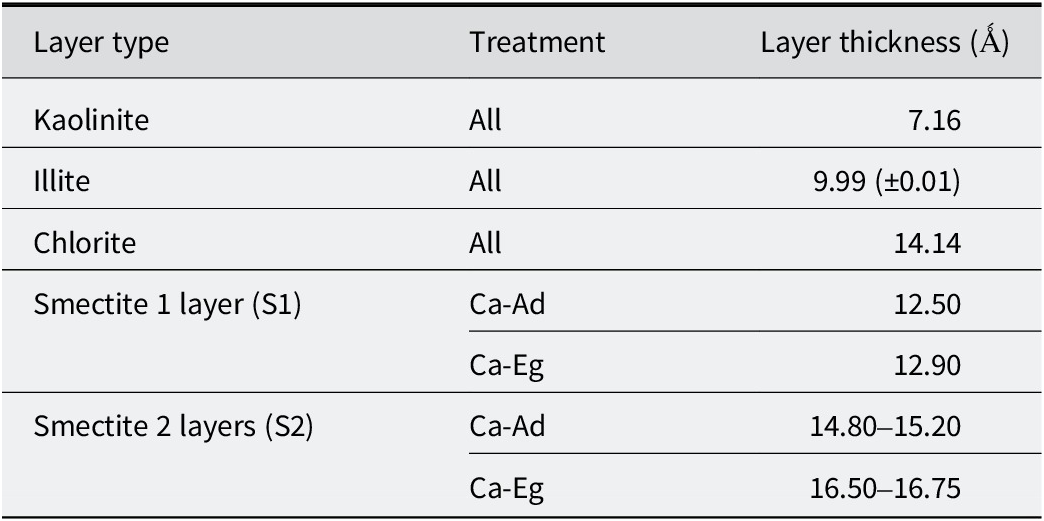
The instrumental and experimental factors, including horizontal and vertical beam divergences, the goniometer radius and the length of the oriented slides, were measured and introduced without further adjustment. The mass absorption coefficient (μ*) was set to 50 cm2 g-1. Sigma-star (σ*), representing the distribution of particle orientation (Reynolds, Reference Reynolds1986; Dohrmann et al., Reference Dohrmann, Rüping, Kleber, Ufer and Jahn2009), was set to 7.5° for all structure models, except for the 0.2–2 μm sub-fraction, for which it was adjusted to 12° due to the lower orientation of coarse particles. The distributions of CSDSs along the c* axis were assumed to be lognormal (Drits et al., Reference Drits, Środoń and Eberl1997b) around an adjustable mean value (N). The z-coordinates of all atoms within the clay layer frameworks were set as proposed by Moore and Reynolds (Reference Moore and Reynolds1997). The octahedral iron occupancy (from 0 to 1.5 per O20(OH)4) and the amount of interlayer cations were considered to be adjustable parameters. For illite and smectite layers, the structural formulae for soil illite and smectite proposed by Laird et al. (Reference Laird, Barak, Natar and Dowdy1991) were used as a starting reference for the layer crystal chemistry. The layer thicknesses of the various clay layers used in the structural model were set according to Table 1. The layer-to-layer distances for kaolinite, illite, and chlorite were set at 7.17 Å (±0.01 Å), 9.99 Å (±0.01 Å), and 14.14 Å, respectively, for the two treatments. Variable layer-to-layer distances for the smectite layers were considered as a function of their hydration or swelling behavior in the Ad and Eg states (Drits, Reference Drits2003). In the Ad state, Ca-saturated smectite layers can be in a dehydrated (S0w) state, a monohydrated (S1w) state, or a dihydrated (S2w) state. This leads to layer-to-layer distances of ~10.0 Å, ~12.5 Å, and ~15.0 Å, respectively (Ferrage, Reference Ferrage2016). Under Eg solvation, Ca-saturated smectite layers may contain one (S1g, ~12.9 Å) or two (S2g, ~16.8 Å) sheets of Eg molecules in their interlayers (Moore and Reynolds, Reference Moore and Reynolds1997). To account for the ‘disorder of the second type’ (Sakharov and Lanson, Reference Sakharov, Lanson, Bergaya and Lagaly2013), these layer-to-layer distances were allowed to deviate from their mean values by introducing a variance parameter (σz) from 0 to 0.5 Å. Fit quality was estimated using the unweighted profile R-factor (Rp; Howard and Preston, Reference Howard, Preston, Bish and Post1989) over the 4.5–53°2θ range, excluding angular domains containing non-clay mineral reflections for bulk <2 μm and 0.2–2 μm fractions (i.e. quartz and feldspar).
Layer thickness considered for the different types of layers after Ca-Ad and Ca-Eg during the simulation of the experimental XRD patterns

Table 1. Long description
The table consists of three columns: Layer type, Treatment, and Layer thickness in Angstroms.
* Kaolinite: For all treatments, the thickness is 7.16.
* Illite: For all treatments, the thickness is 9.99 plus or minus 0.01.
* Chlorite: For all treatments, the thickness is 14.14.
* Smectite 1 layer (S1): Under C a-A d treatment, the thickness is 12.50. Under Ca-E g treatment, the thickness is 12.90.
* Smectite 2 layers (S2): Under C a-A d treatment, the thickness ranges from 14.80 to 15.20. Under C a-E g treatment, the thickness ranges from 16.50 to 16.75.
Results
Size fractionation
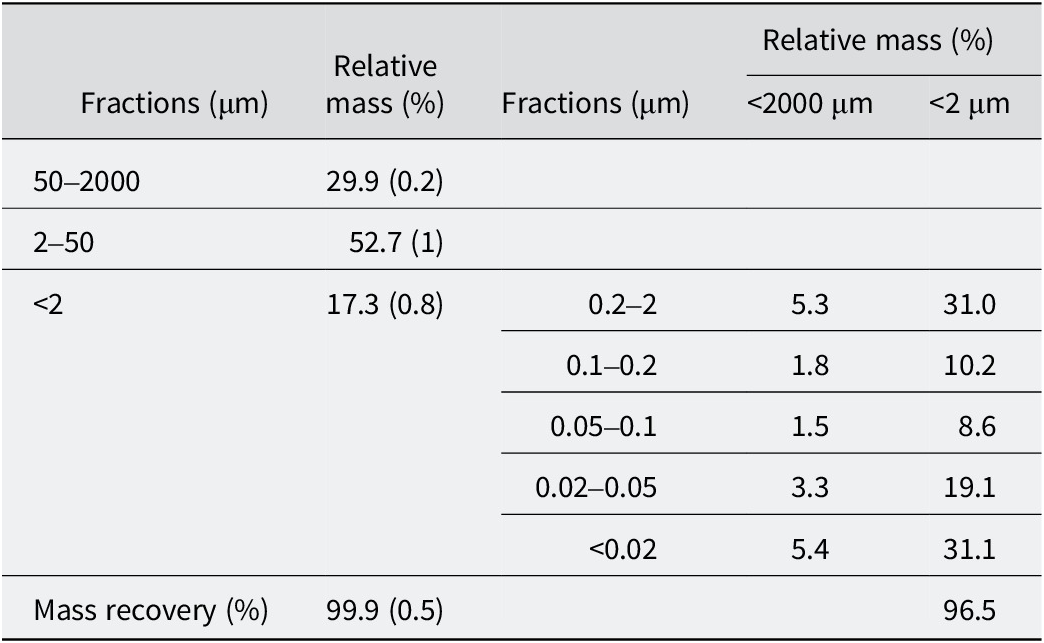
The reliability of the size-fractionation procedure was indicated by the high recovery rates of 99.9% and 96.5% for the <2000 μm and <2 μm fractions, respectively (Table 2). Sequential size fractionation of the <2 μm fraction showed that more than half of this size fraction consisted of fine particles (<0.05 μm), 31% of which were very fine (<0.02 μm). The contribution of the sub-fractions between 0.05 and 0.2 μm was relatively small (<20%), while the proportion of the coarser sub-fraction remained significant at 31%.
Particle-size distribution
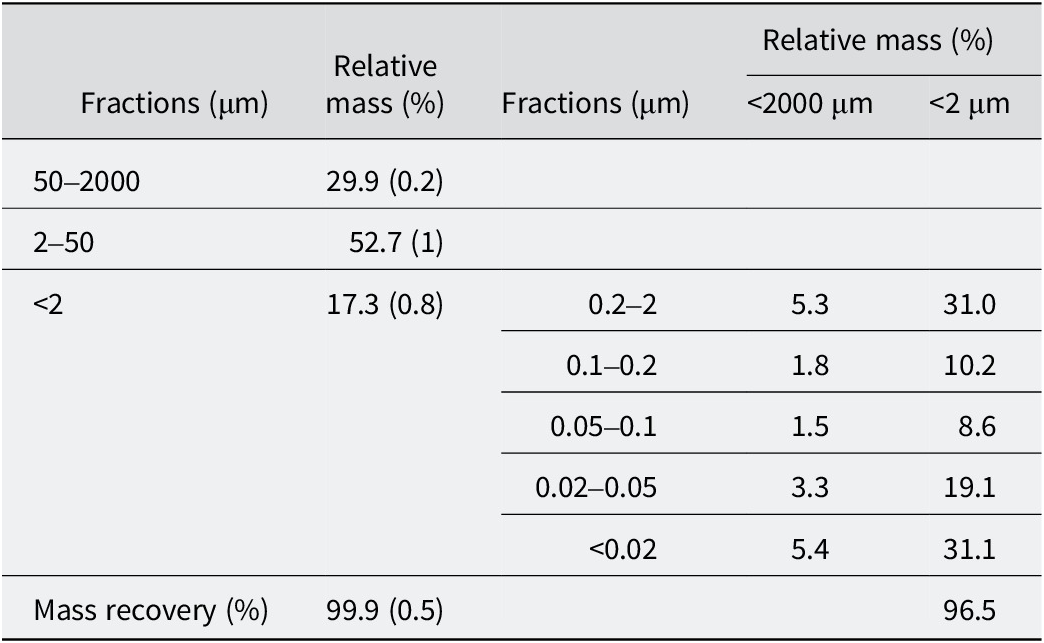
Table 2. Long description
The table is divided into primary fractions and sub-fractions of the less than 2 micrometer group.
Primary Fractions:
* 50 to 2000 micrometer: 29.9 percent with a standard deviation of 0.2.
* 2 to 50 micrometer: 52.7 percent with a standard deviation of 1.
* Less than 2 micrometer: 17.3 percent with a standard deviation of 0.8.
* Total Mass recovery: 99.9 percent with a standard deviation of 0.5.
Sub-fractions of the less than 2 micrometer m group (Relative mass normalized to 100 percent):
* 0.2 to 2 micrometer: 5.3 percent of total mass and 31.0 percent of the clay fraction.
* 0.1 to 0.2 micrometer: 1.8 percent of total mass and 10.2 percent of the clay fraction.
* 0.05 to 0.1 micrometer: 1.5 percent of total mass and 8.6 percent of the clay fraction.
* 0.02 to 0.05 micrometer: 3.3 percent of total mass and 19.1 percent of the clay fraction.
* Less than 0.02 micrometer: 5.4 percent of total mass and 31.1 percent of the clay fraction.
* Mass recovery for the sub-fraction: 96.5 percent.
Standard deviations for <2, 2–50, 50–2000 μm are in parentheses. The relative masses of the sub-fractions of the <2 μm fraction are normalized to 100%.
XRD results
XRD qualitative analysis
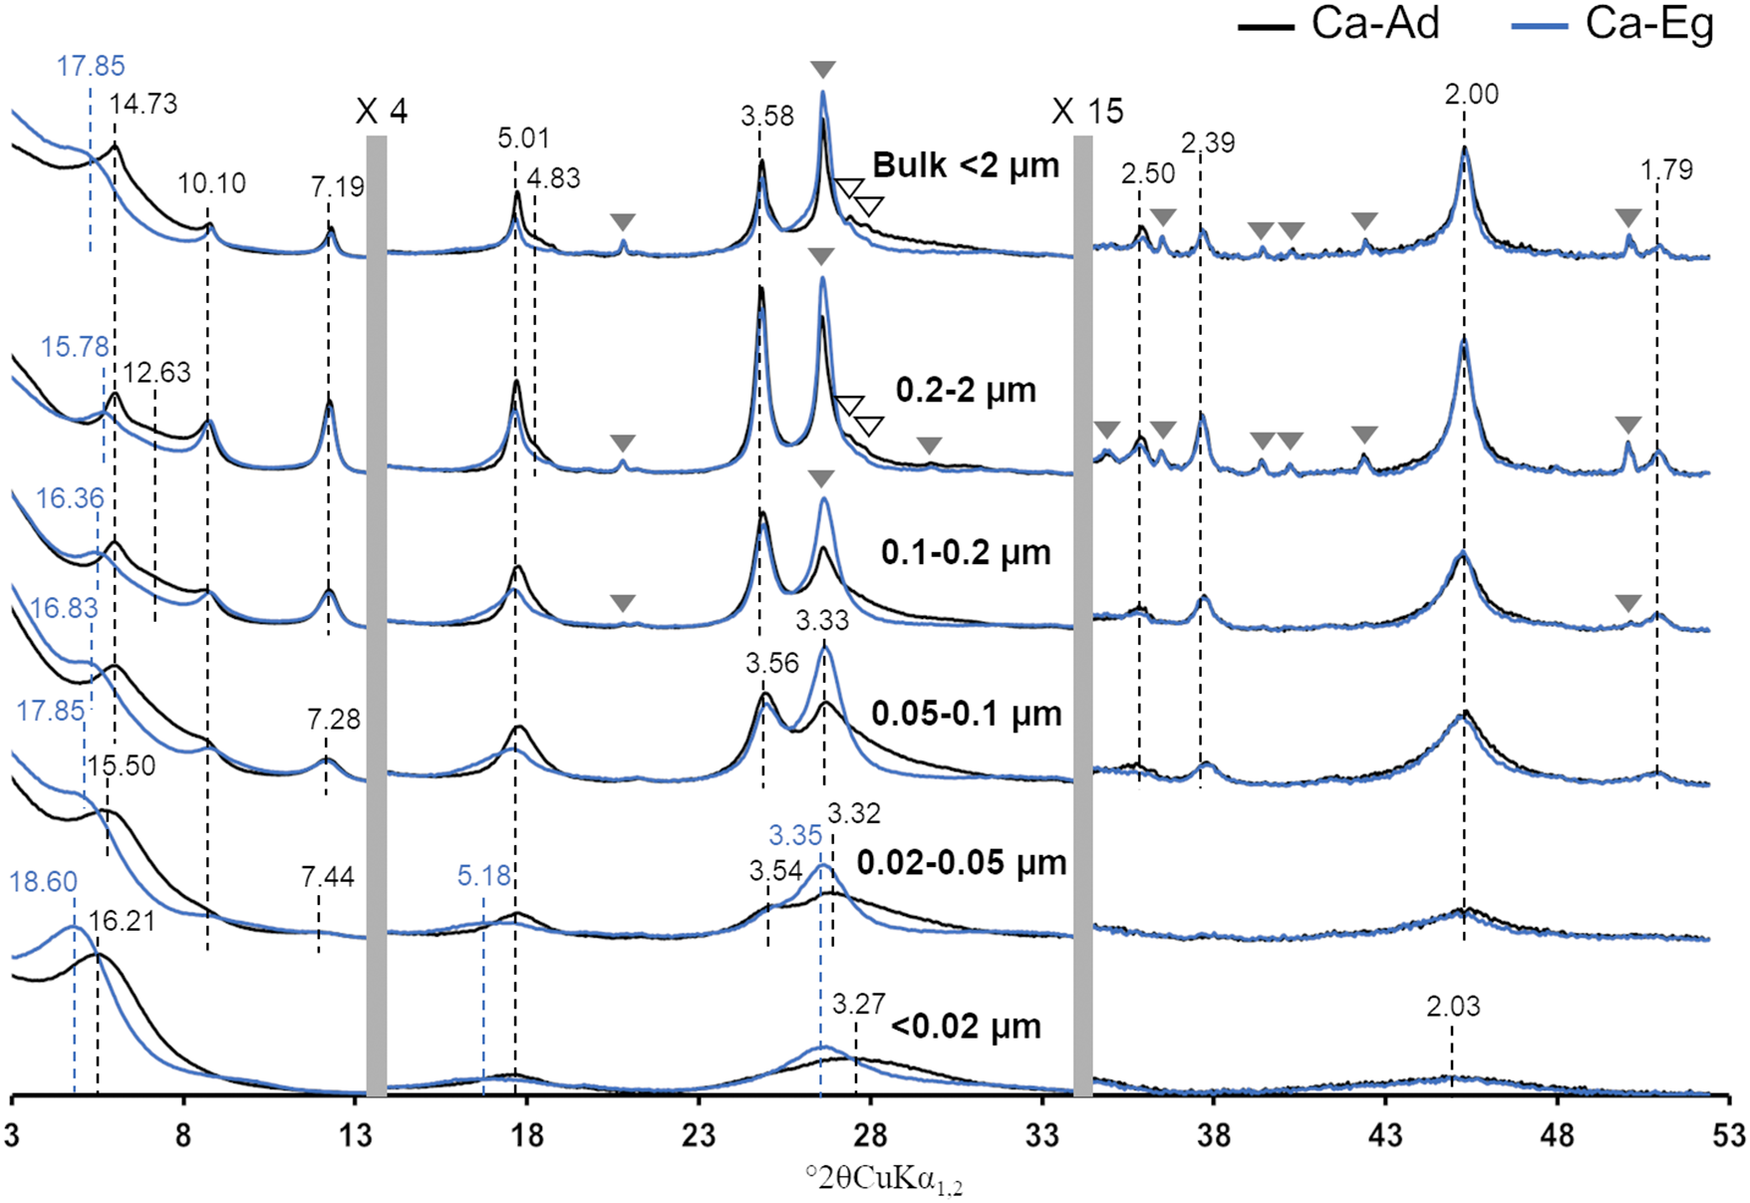
The XRD patterns of the bulk <2 μm fraction and subsequent sub-fractions obtained for the Ca-Ad and Ca-Eg treatments exhibited 00ℓ reflections that were typical of clay minerals, as well as additional diffraction peaks that were attributed to quartz and feldspars (shown as gray and open triangles, respectively, in Fig. 1). Discrete illite and kaolinite were identifiable by their characteristic, almost rational, 00ℓ reflections at 10.10, 5.01, 2.50, and 2.00 Å, and at 7.19, 3.58, 2.39, and 1.79 Å, respectively, for the two treatments. As described by Hubert et al. (Reference Hubert, Caner, Meunier and Lanson2009), the irrational peak series at 14.73 Å and 4.83 Å in the Ca-Ad pattern, which shifts toward lower angles and almost disappears following Eg solvation, was characteristic of randomly interstratified R0 chlorite-smectite MLM (~50/50). Consequently, the asymmetry on the low-angle side of the 14.73 Å reflection, which shifts toward lower angles following Eg solvation, probably corresponded to R0 illite-smectite MLM (~60/40). Finally, the 17.85 Å reflection in the Ca-Eg treatment could be attributed to discrete smectite with low CSDS.
Experimental XRD patterns of the bulk <2 μm fraction and subsequent sub-fractions. The continuous black and blue traces represent the XRD patterns recorded in Ad and after Eg solvation, respectively. Open and filled gray triangles indicate the presence of accessory feldspar and quartz reflections, respectively. The black and blue dashed lines indicate the positions of the main 00ℓ (Å) reflections for the XRD patterns in Ad and after Eg solvation, respectively. The vertical gray bars show the modified scale factors for the high-angle regions (×4 for 13.5–34° and ×15 for 34–53°) compared with the 3–13.5°2θ angular range. For an explanation of the color coding used in this figure, please refer to the online version of this article.

Figure 1. Long description
The X R D patterns are stacked vertically for six fractions: Bulk less than 2 micrometers, 0.2 to 2 micrometers, 0.1 to 0.2 micrometers, 0.05 to 0.1 micrometers, 0.02 to 0.05 micrometers, and less than 0.02 micrometers. The x-axis represents degrees 2 theta C u K alpha sub 1,2 ranging from 3 to 53. The y-axis represents intensity.
Each panel contains two traces: a black line for Ca-Ad and a blue line for Ca-Eg. Vertical gray bars divide the x-axis into three regions with different scale factors: the first region is 3 to 13.5 degrees, the second is 13.5 to 34 degrees (scaled by 4), and the third is 34 to 53 degrees (scaled by 15).
Key features include:
* In the Bulk and larger fractions, sharp peaks are labeled with Angstrom values such as 14.73, 10.10, 7.19, 5.01, 3.58, 3.33, and 2.00.
* Blue dashed lines indicate shifts after Eg solvation, notably at the low-angle region where peaks shift from approximately 14.73 to 17.85 Angstroms in the Bulk fraction.
* As particle size decreases (moving down the panels), the peaks become broader and lower in intensity, particularly the accessory mineral reflections marked by triangles.
* Filled gray triangles indicate quartz and open triangles indicate feldspar, which are most prominent in the top two panels and nearly absent in the bottom two panels.
* In the finest fraction (less than 0.02 micrometers), the pattern is characterized by very broad, low-intensity humps rather than sharp peaks, with a notable broad feature around 18.60 Angstroms in the blue trace.
The experimental XRD patterns of the sub-fractions provided further insight into the composition of the <2 μm bulk fraction and how the minerals were distributed among the sub-fractions. In agreement with previous studies (Hubert et al., Reference Hubert, Caner, Meunier and Ferrage2012; Viennet et al., Reference Viennet, Hubert, Ferrage, Tertre, Legout and Turpault2015; Bakker et al., Reference Bakker, Hubert, Wander and Lanson2018), the following occurred as particle size decreased: quartz and feldspar disappeared while remaining concentrated in the coarser sub-fractions (>0.1 μm; Fig. 1); the 00ℓ reflections of clay minerals became more asymmetric and broader, suggesting a decrease in CSDS and/or an increase in mixed layering; the differences between the Ca-Ad and Ca-Eg XRD profiles became more striking, indicating an increase in the contribution of smectite layers.
The Ca-Ad XRD profiles of the two coarser sub-fractions exhibited a broad band centered on 12.63 Å, confirming the presence of an MLM composed of illite and smectite layers. The persistence of this band in the finer sub-fraction (<0.1 μm) suggested that diffracted intensity remained present in this angular domain. Sequential fractionation also enabled discrimination of the 001 reflections of the R0 chlorite-smectite MLM and the smectitic phase. In the 0.2–2 μm fraction, the shift to 15.78 Å after Eg solvation of the 14.73 Å reflection in the Ad state confirmed the presence of the R0 chlorite-smectite MLM. These 001 positions were consistent with the calculated XRD profiles of the R0 chlorite-smectite MLM (50/50) as proposed by Hubert et al. (Reference Hubert, Caner, Meunier and Lanson2009) (14.73 Å for Ca-Ad and 15.92 Å for Ca-Eg). In contrast, the finest sub-fraction exhibited the 001 reflection of the smectitic phase at 16.21 Å in the Ca-Ad state, shifting toward 18.60 Å after Eg solvation. The other broad, asymmetric 00ℓ reflections of the <0.02 μm fraction were irrational (16.21, 5.01, 3.27, and 2.03 Å for Ca-Ad, and 18.60, 5.18, 3.35, and 2.02 Å for Ca-Eg), suggesting mixed layering of the smectitic phase and/or the presence of additional clay phases.
For the intermediate sub-fractions (0.02–0.2 μm), the progressive shifts in the 001 reflections of Ca-Eg from 16.36 to 17.85 Å as particle size decreased may be attributed to variable contributions from the two clay phases and/or a decrease in their CSDS. Regarding the kaolinitic phase, the three coarser sub-fractions exhibited a rational series of discrete kaolinite peaks. However, the 00ℓ reflections series was irrational in the 0.02–0.05 μm (7.28, 3.56, 2.39, and 1.79 Å) and 0.05–0.1 μm (7.44, 3.54, 2.39, and 1.79 Å) fractions and did not shift after Eg solvation (see Fig. 1). This suggested the presence of mixed-layered structures dominated by kaolinite layers with illite and/or chlorite layers. Note that the reflection series of the kaolinitic phase was absent in the finest sub-fraction.
The clay mineralogy described for the <2 μm bulk fraction was globally consistent with that described previously for a similar soil profile (Hubert et al., Reference Hubert, Caner, Meunier and Lanson2009), showing the presence of discrete kaolinite and illite, as well as R0 chlorite-smectite and R0 illite-smectite MLMs. However, analysis of the experimental XRD patterns of the sub-fractions revealed more heterogeneous and poorly crystallized MLMs for the smectitic and kaolinitic phases. In order to determine the crystal structures of all the clay phases present and their distribution among the sub-fractions, full-profile XRD modeling was performed on the bulk <2 μm fraction and subsequent sub-fractions.
XRD full-profile modeling of 00ℓ reflections
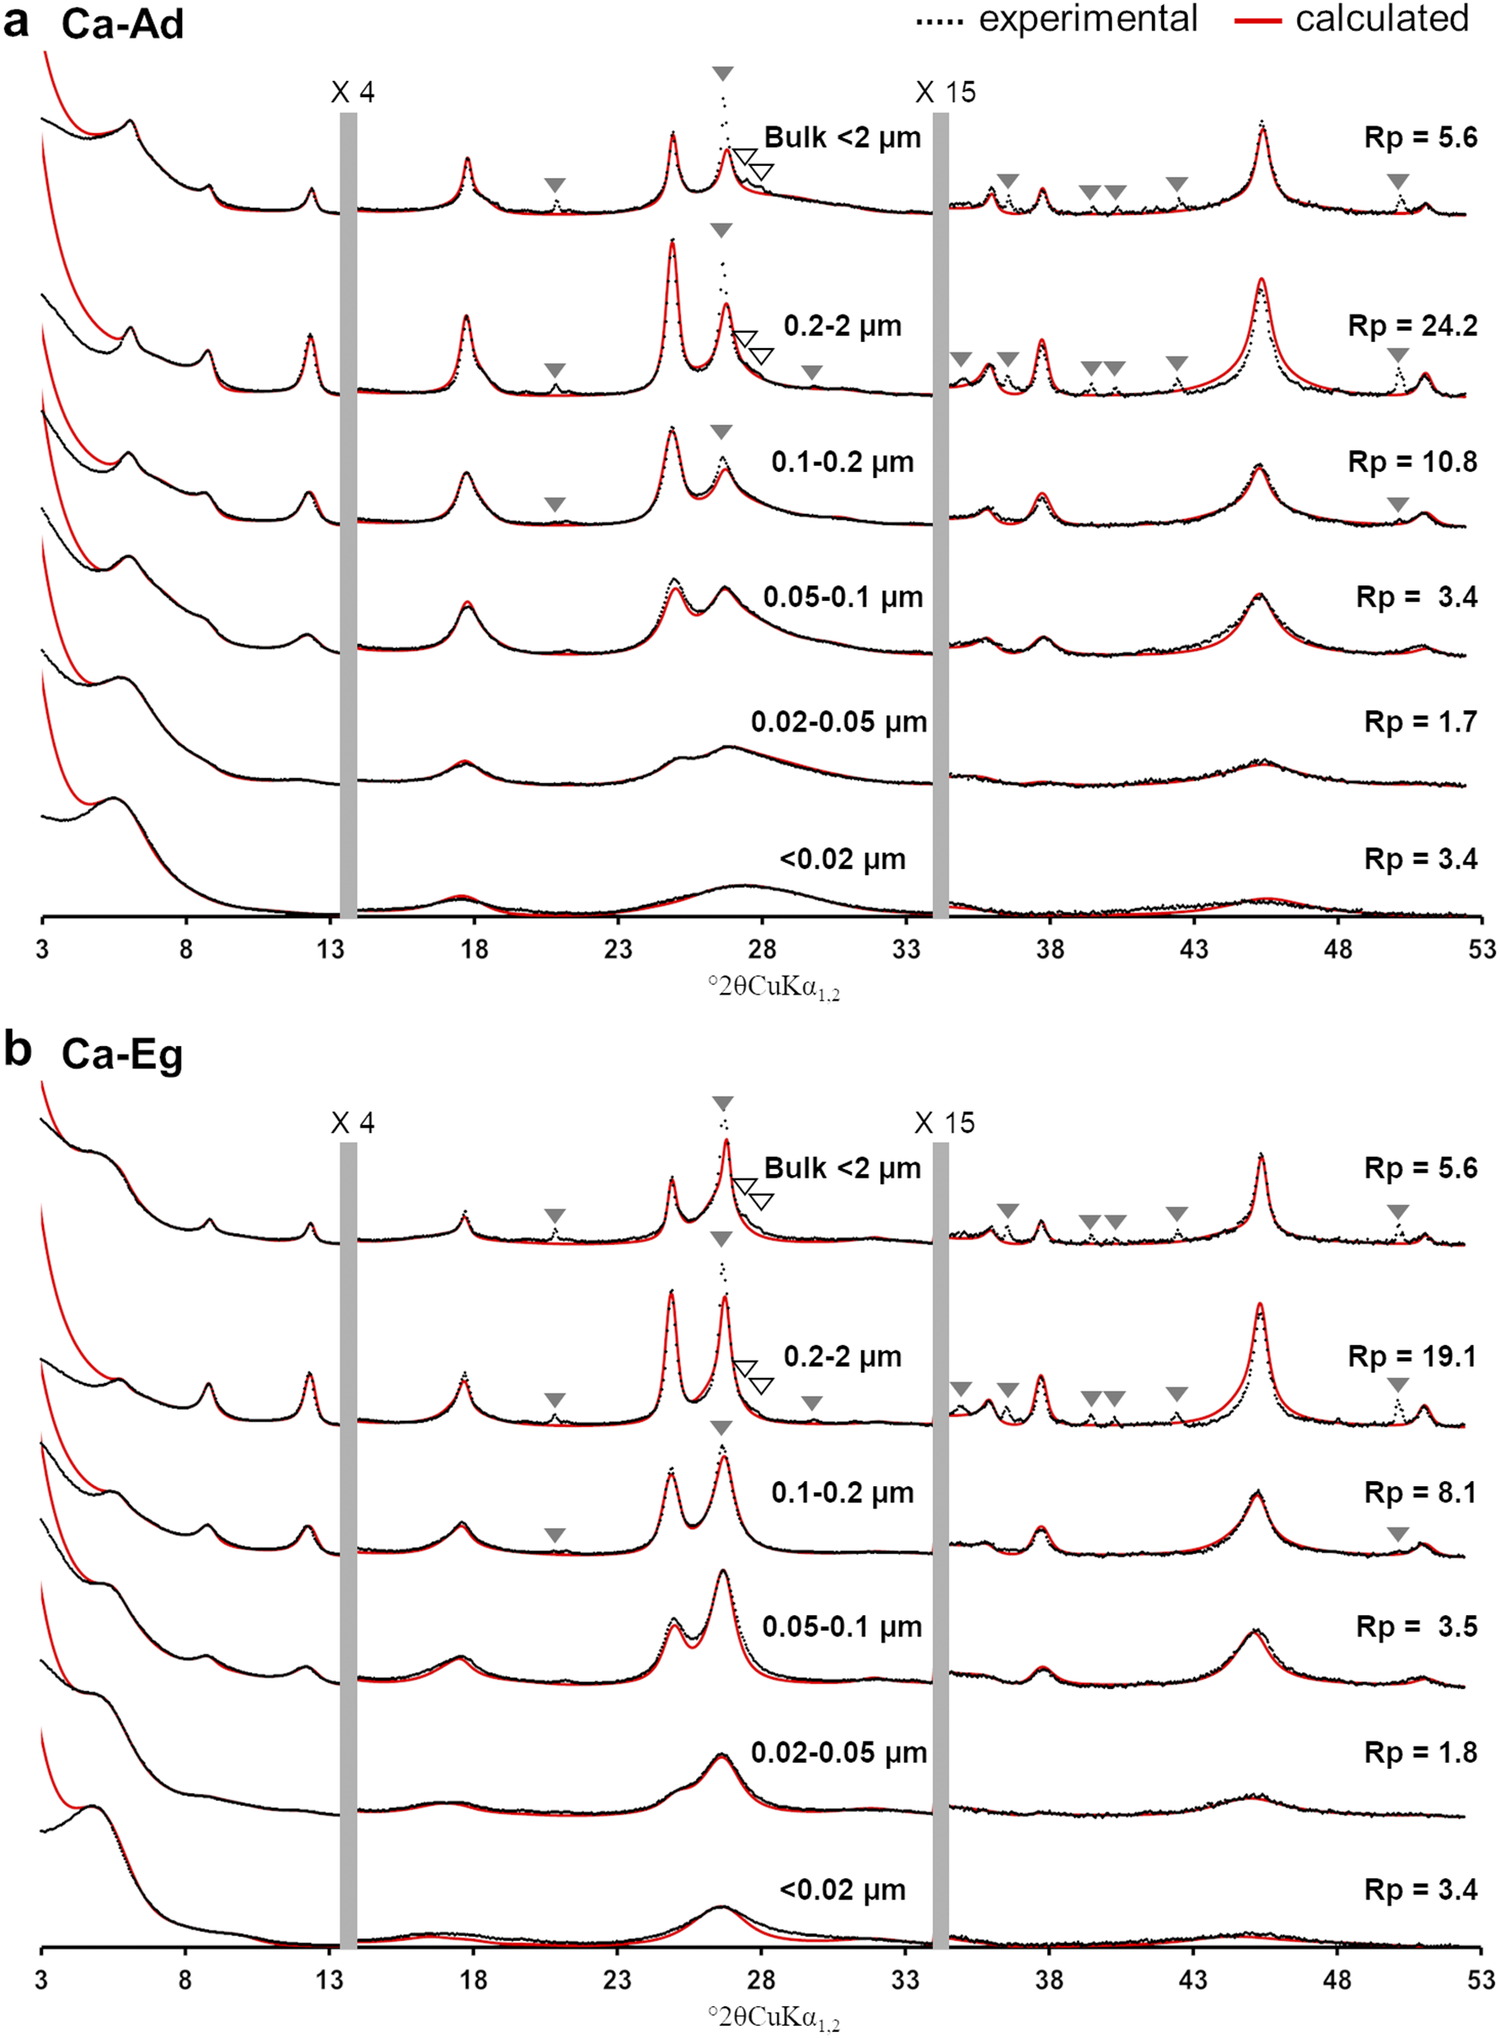
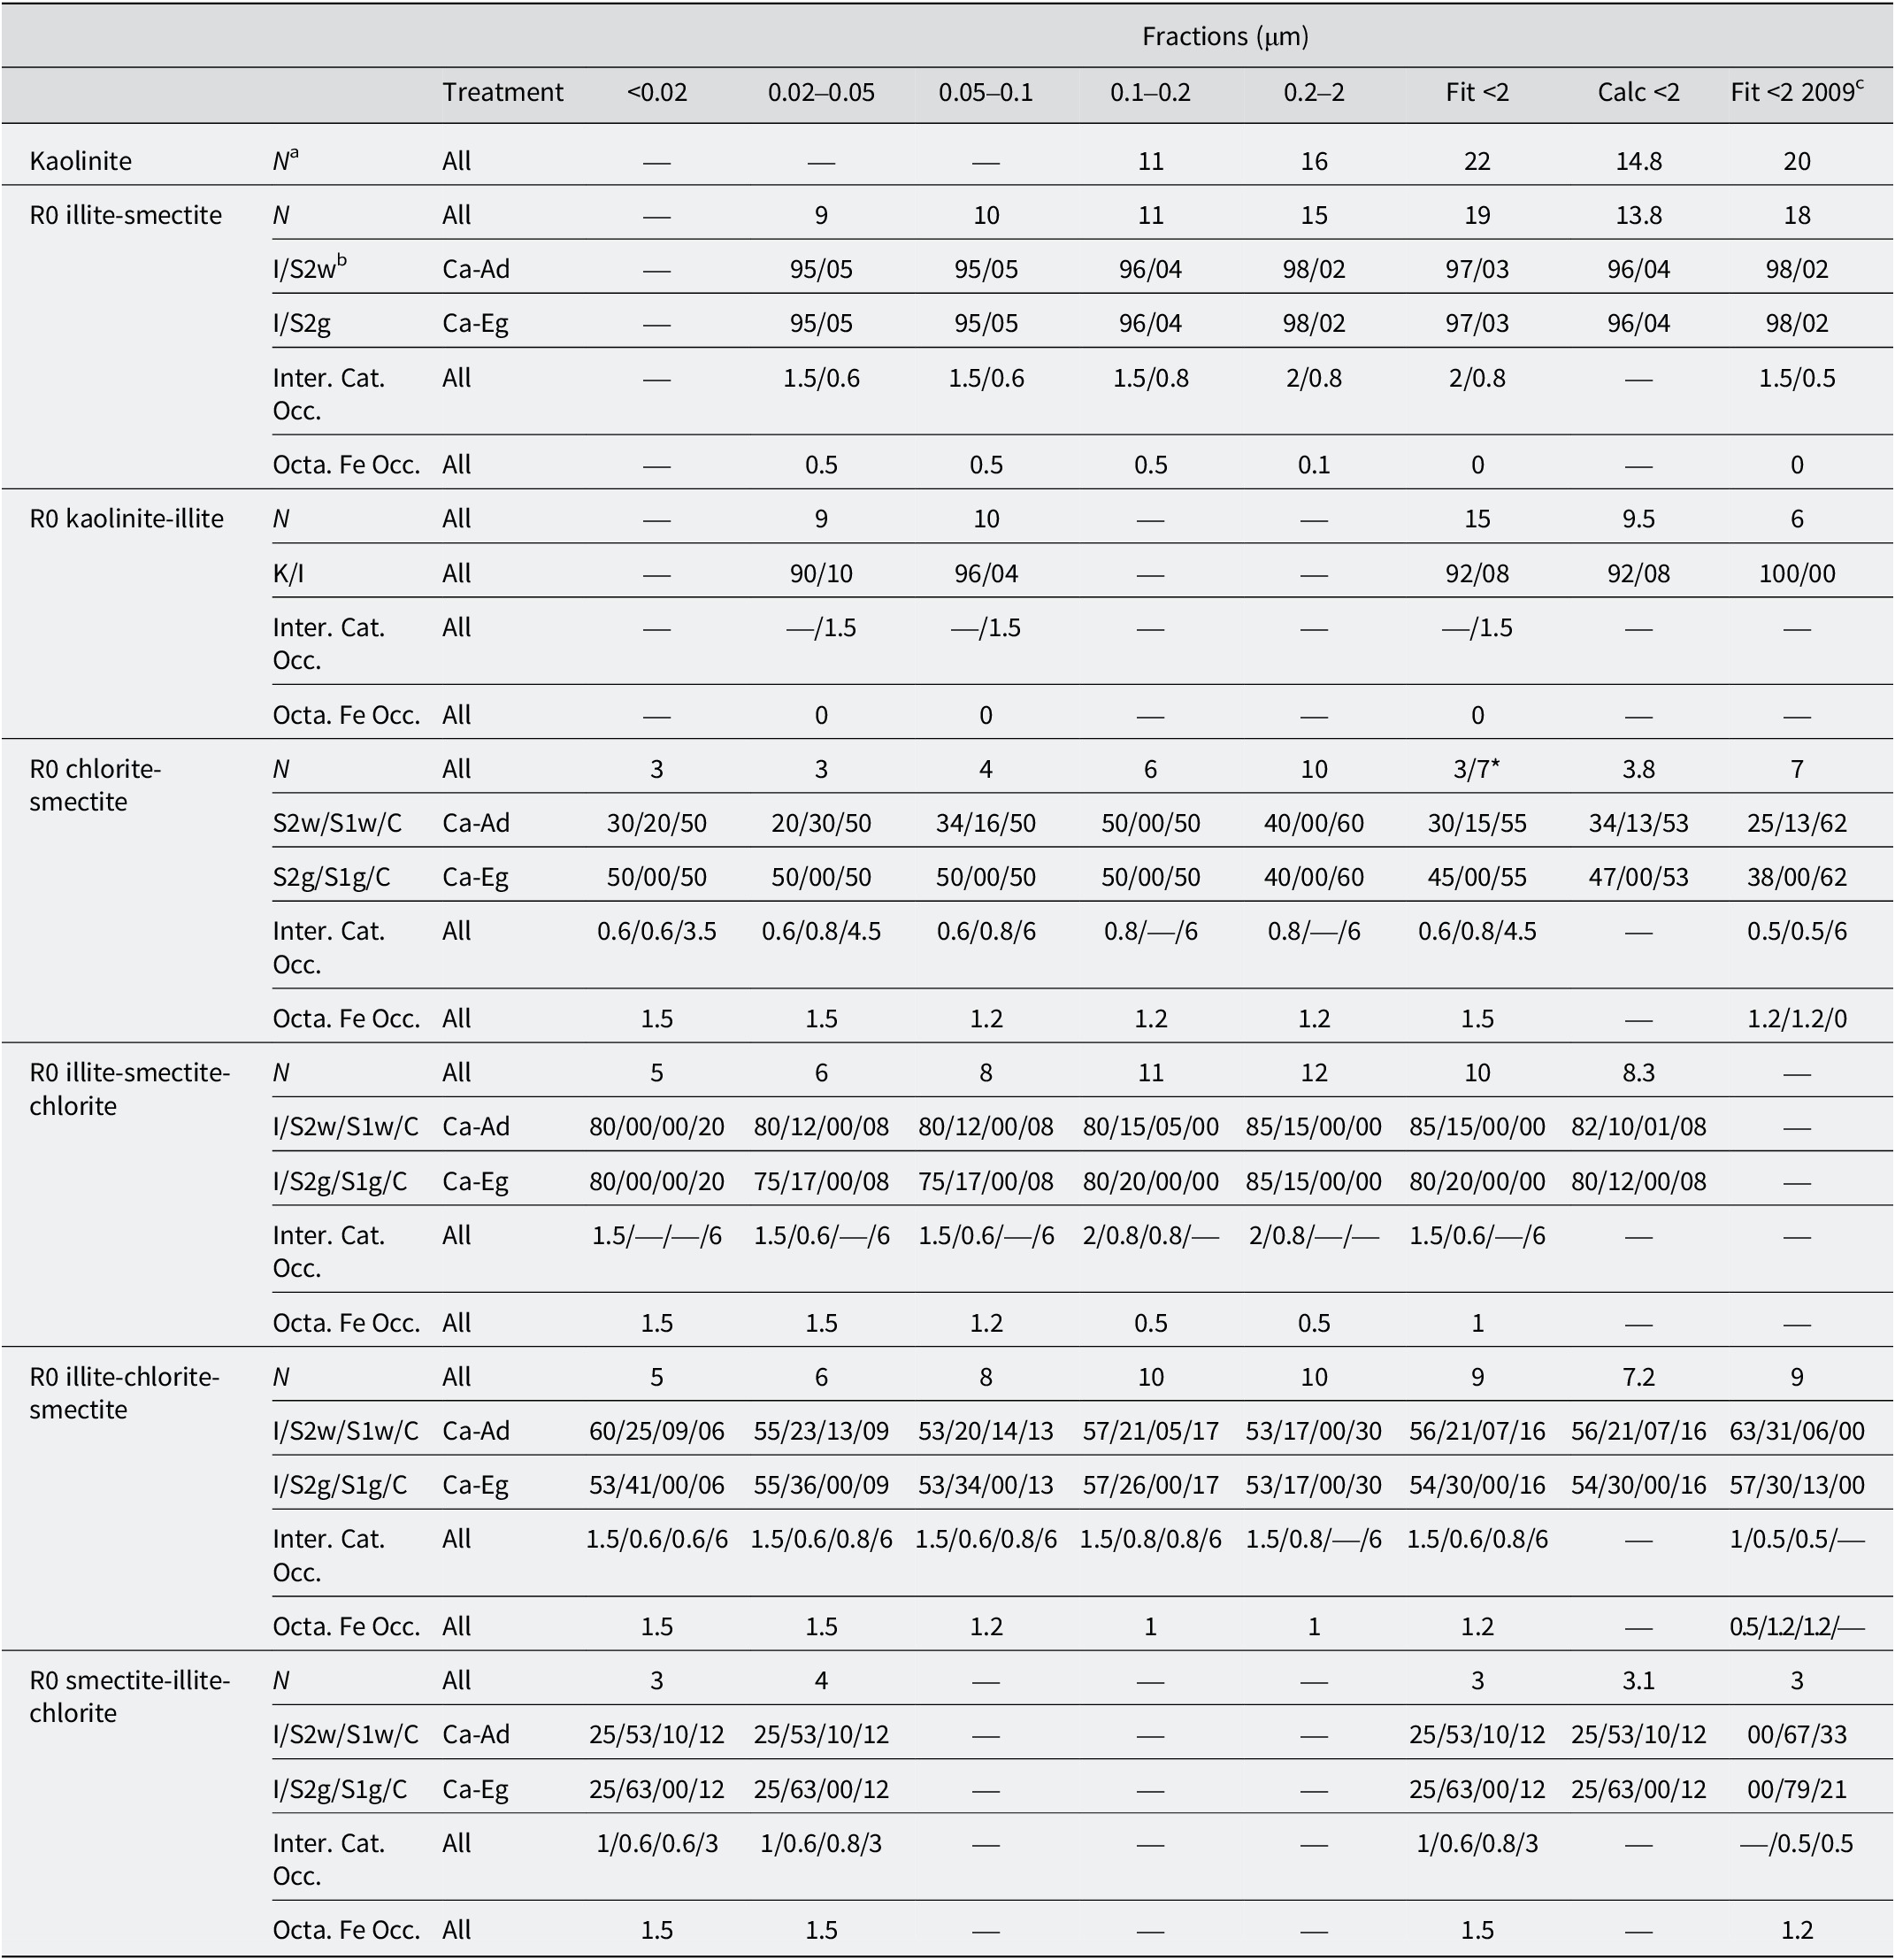
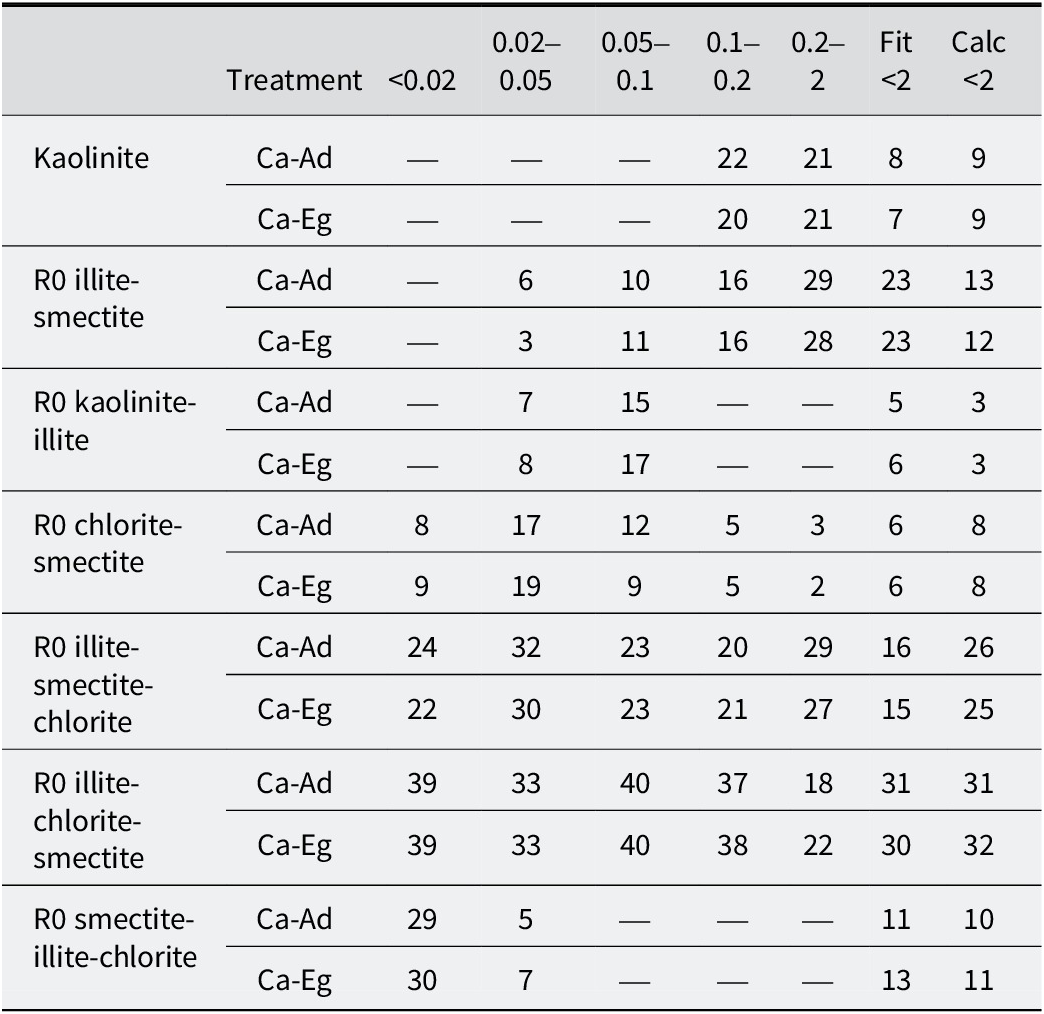
The calculated XRD profiles of the bulk <2 μm and subsequent sub-fractions were compared with the experimental profiles for the Ca-Ad (Fig. 2a) and Ca-Eg (Fig. 2b) treatments. The structure models, which accounted for the structural parameters (the number of layers N in coherent scattering domains, the relative abundances of layer types, junction probabilities, interlayer cation occupancy, and octahedral iron occupancy), as well as the relative proportions of different clay minerals, are reported in Tables 3 and 4, respectively. Seven different clay minerals, including one discrete kaolinite and one quasi-discrete illite (with a dominance of >95%), as well as five MLMs, were considered during the modeling exercise. The calculated XRD profile of each MLM was presented in the sub-fraction to which it made a significant contribution (Fig. 3; Table 4). For discrete kaolinite and quasi-discrete illite, the sums of their relative contributions were presented in the bulk <2 μm fraction (Fig. 3). These two minerals accounted for the well-resolved, close-to-rational series of reflections at 7.19, 3.58, 2.39, and 1.79 Å, and at 10.10, 5.01, 2.50, and 2.00 Å, respectively, in the bulk <2 μm fraction. Small amounts of smectite layers were included in the quasi-illite to replicate the slight shift in the 001 reflection from 10.10 to 10.04 Å following the Ca-Eg treatment (Fig. 3b; Table 3).
Comparison between calculated and experimental XRD patterns obtained after: (a) the Ca-Ad; and (b) the Ca-Eg treatments for the bulk <2 μm fraction and its subsequent sub-fractions. The experimental and calculated XRD patterns are represented by black crosses and red traces, respectively. The vertical gray bars indicate modified scale factors for the high-angle regions (×4 for 13.5–34°; ×15 for 34–53°) compared with the 3–13.5°2θ angular range. The accessory mineral reflections are labeled as in Fig. 1 and were excluded when calculating the goodness-of-fit Rp factors. For an explanation of the colour coding used in this figure, please refer to the online version of this article.

Figure 2. Long description
The multi-panel line graph displays X-ray diffraction (X R D) patterns. The x-axis represents the diffraction angle in degrees 2 theta C u K alpha sub 1, 2, ranging from 3 to 53. The y-axis represents intensity.
Panel a, labeled Ca-Ad, and Panel b, labeled Ca-Eg, both contain six vertically stacked diffraction patterns corresponding to size fractions: Bulk less than 2 micrometers, 0.2 to 2 micrometers, 0.1 to 0.2 micrometers, 0.05 to 0.1 micrometers, 0.02 to 0.05 micrometers, and less than 0.02 micrometers.
In all plots, experimental data are shown as black dotted lines and calculated data as solid red lines. Two vertical gray bars divide each plot into three angular regions with different scale factors: the first region is 3 to 13.5 degrees, the second is 13.5 to 34 degrees (scaled by 4), and the third is 34 to 53 degrees (scaled by 15).
Composition and structural parameters of the different clay phases obtained from the simulations of the experimental XRD patterns after Ca-Ad and Ca-Eg treatments
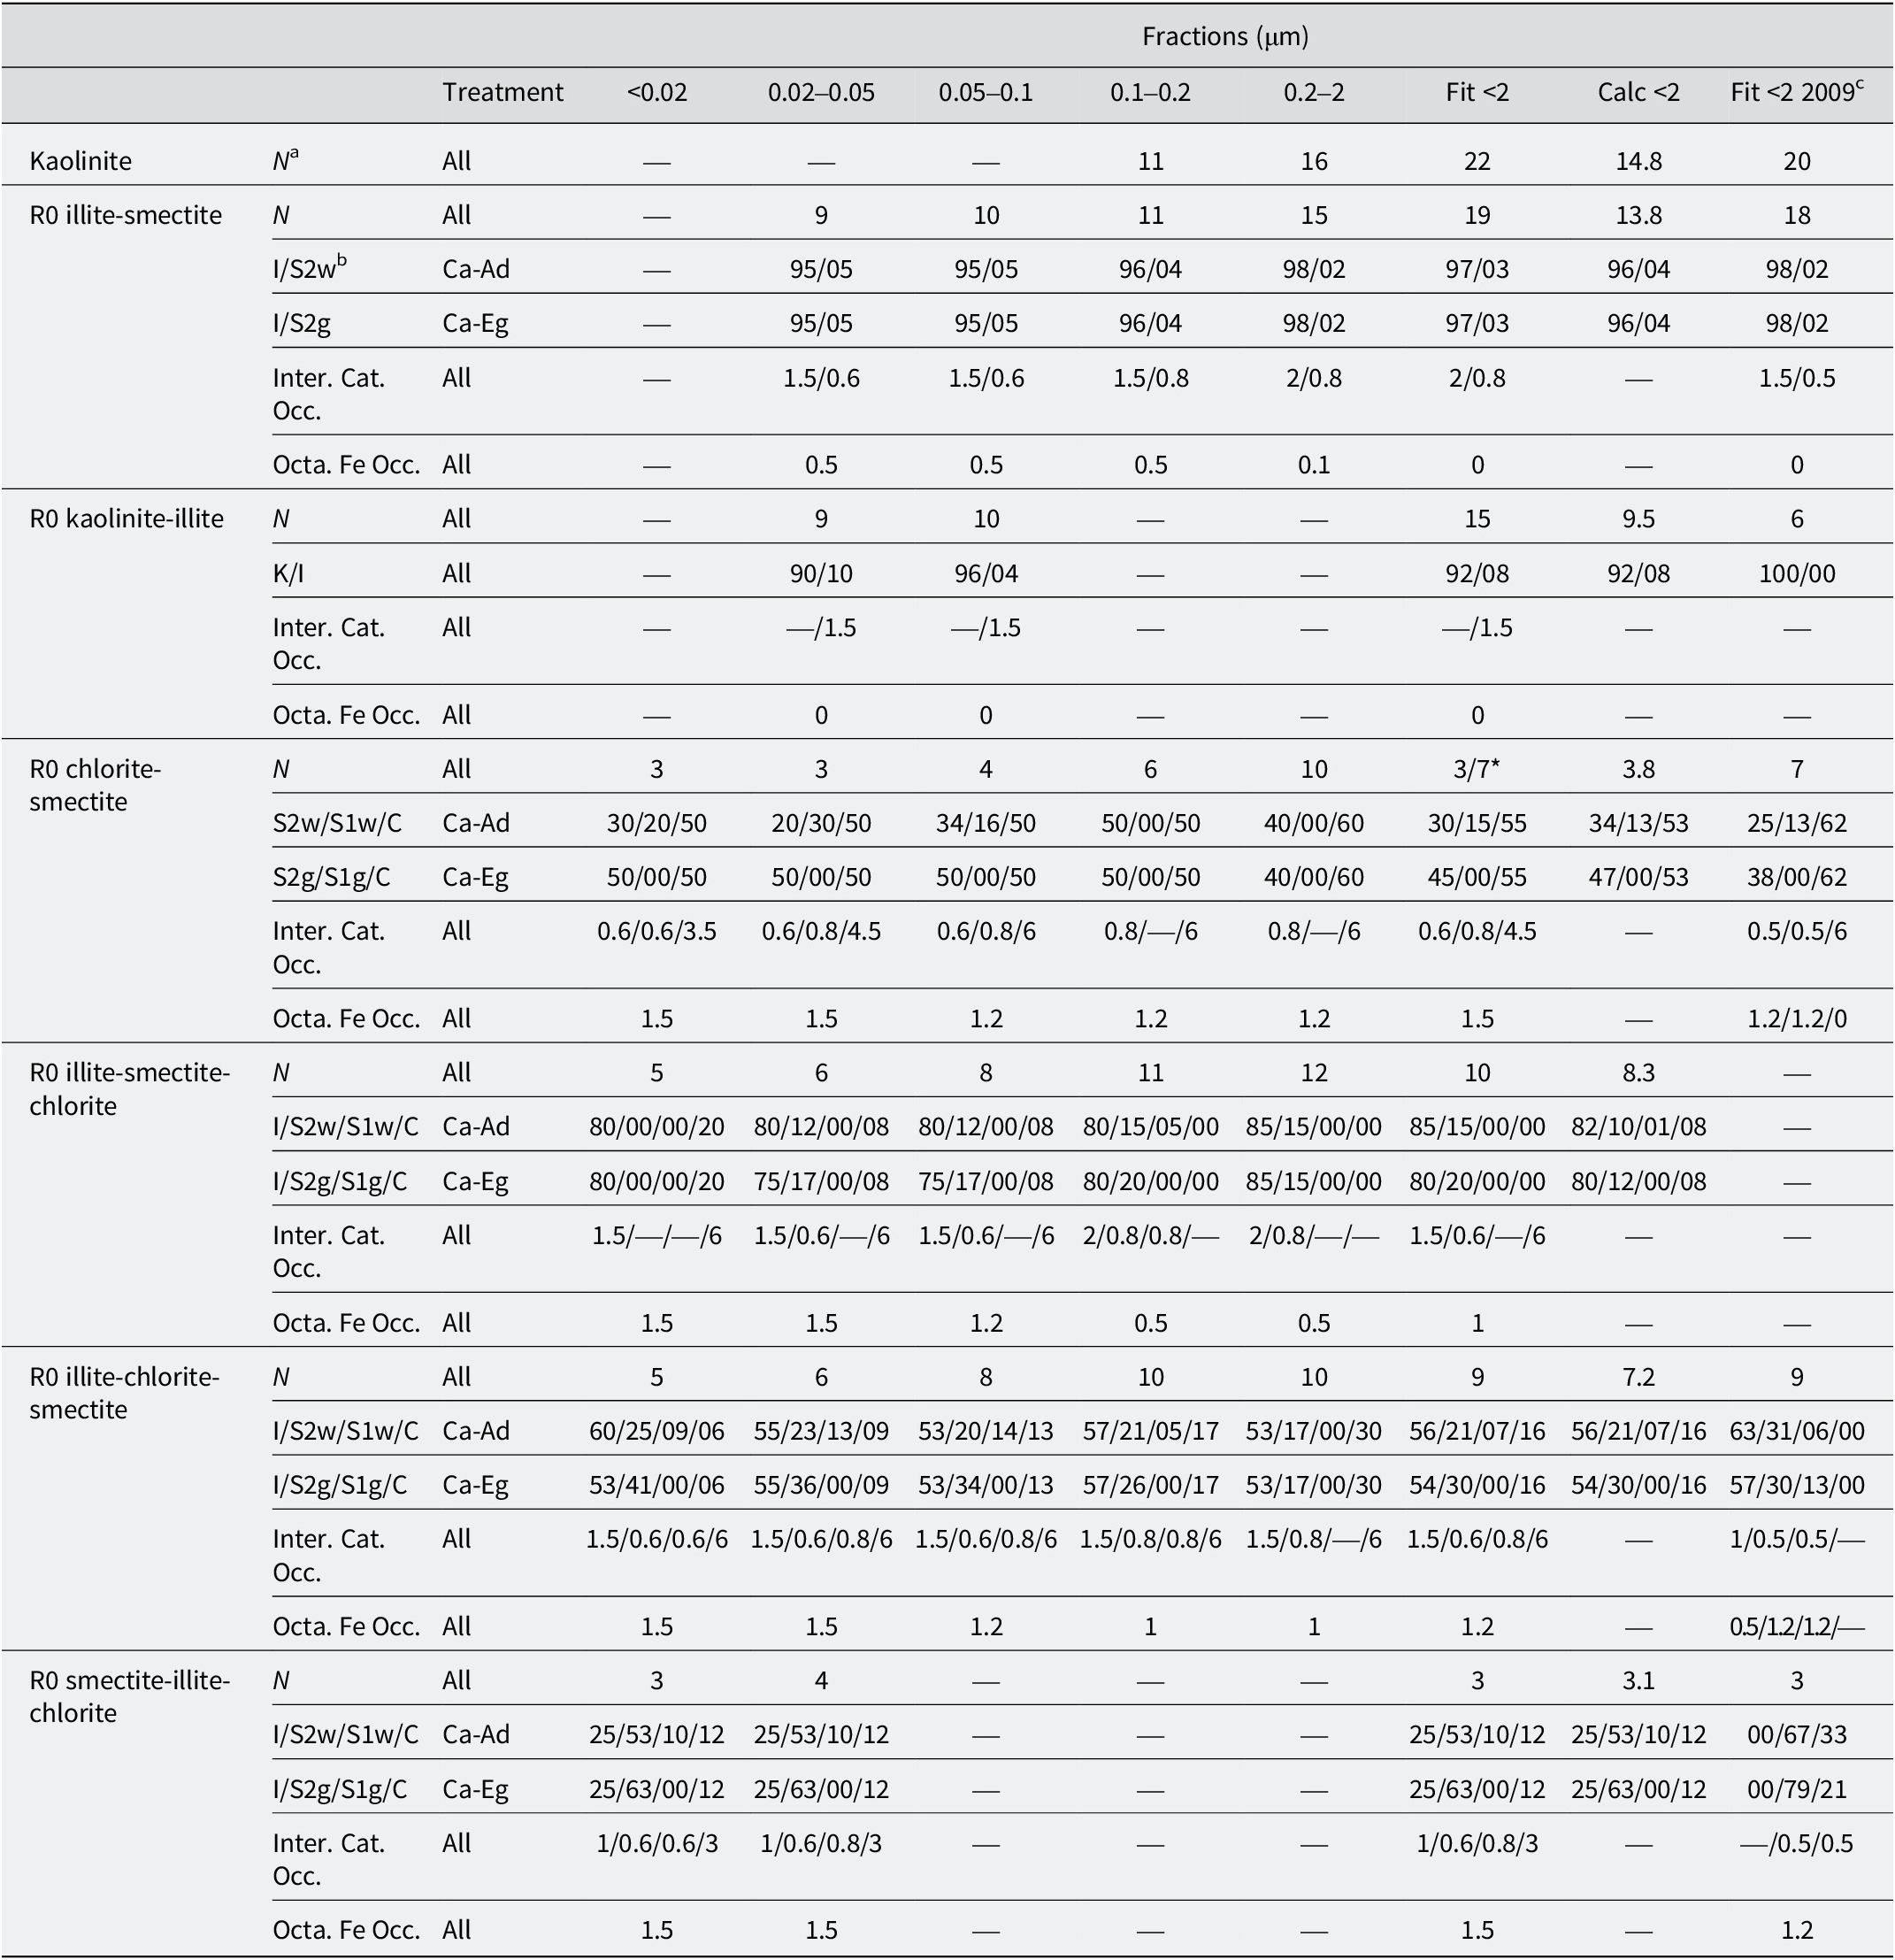
Table 3. Long description
The table is organized into columns representing size fractions in micrometers: less than 0.02, 0.02 to 0.05, 0.05 to 0.1, 0.1 to 0.2, 0.2 to 2, and three summary columns (Fit less than 2, Calc less than 2, and Fit less than 2 2009).
Key clay phases and their parameters include:
* Kaolinite: Average number of layers N ranges from 11 to 22 across fractions.
* R 0 illite-smectite: N ranges from 9 to 19. I / S 2 w and I / S 2 g ratios are consistently around 95/05 to 98/02.
* R 0 kaolinite-illite: N ranges from 9 to 15, with K / I ratios between 90/10 and 96/04.
* R 0 chlorite-smectite: N ranges from 3 to 10. S 2 w / S 1 w / C ratios vary, for example, 30/20/50 in the finest fraction and 40/00/60 in the 0.2 to 2 micrometer fraction.
* R 0 illite-smectite-chlorite: N ranges from 5 to 12. I / S 2 w / S 1 w / C ratios show high illite content, typically 80 to 85 percent.
* R 0 illite-chlorite-smectite: N ranges from 5 to 10. I / S 2 w / S 1 w / C ratios show illite between 53 and 60 percent.
* R 0 smectite-illite-chlorite: N is low, between 3 and 4, with smectite (S 2 w) being the dominant component at 53 percent.
Additional parameters include Interlayer Cation Occupancy and Octahedral Fe Occupancy, which vary by phase and size fraction, with Fe occupancy generally decreasing as particle size increases in the illite-smectite phases.
a N is the average number of layers in the coherent scattering domain size (CSDS). bK, I, C, S2w, S1w, S2g, and S1g represent kaolinite, illite, chlorite, smectite with one or two water sheets, and smectite with one or two ethylene-glycol sheets, respectively. cComposition and structural parameters used by Hubert et al. (Reference Hubert, Caner, Meunier and Lanson2009) for the XRD profile modeling of the bulk <2 μm fraction of similar surface horizon. *1% of the R0 chlorite-smectite is represented by the crystal structure of the 0.2–2 μm sub-fraction.
Relative proportions (%) of the various clay phases to the diffracted intensity from the simulations of the experimental XRD patterns after Ca-Ad and Ca-Eg.

Table 4. Long description
The table details the relative proportions in percent of clay phases based on X R D simulations. The columns are Treatment, size fractions in micrometers (<0.02, 0.02–0.05, 0.05–0.1, 0.1–0.2, 0.2–2), and summary columns Fit <2 and Calc <2.
* Kaolinite: For Ca-Ad and Ca-Eg, proportions are only present in the 0.1–0.2 (22 and 20), 0.2–2 (21 and 21), Fit <2 (8 and 7), and Calc <2 (9 and 9) columns.
* R 0 illite-smectite: Proportions range from 3 to 29 across fractions 0.02 to 2, with Fit <2 at 23 and Calc <2 at 12–13.
* R 0 kaolinite-illite: Present only in 0.02–0.05 (7–8) and 0.05–0.1 (15–17) fractions.
* R 0 chlorite-smectite: Highest in the 0.02–0.05 fraction (17–19) and decreases as size increases.
* R 0 illite-smectite-chlorite: High proportions across all fractions, peaking at 32 in the 0.02–0.05 fraction for Ca-Ad.
* R 0 illite-chlorite-smectite: The most dominant phase, maintaining 31–40 percent across most fractions and summary columns.
* R 0 smectite-illite-chlorite: Concentrated in the smallest fractions, <0.02 (29–30) and 0.02–0.05 (5–7).
The proportions of the various clay phases for the <2 fitted and the <2 calculated were obtained by fitting the bulk <2 μm fraction and by summing the proportion of each clay phase in each sub-fraction, weighted to the relative mass of each sub-fraction, respectively.
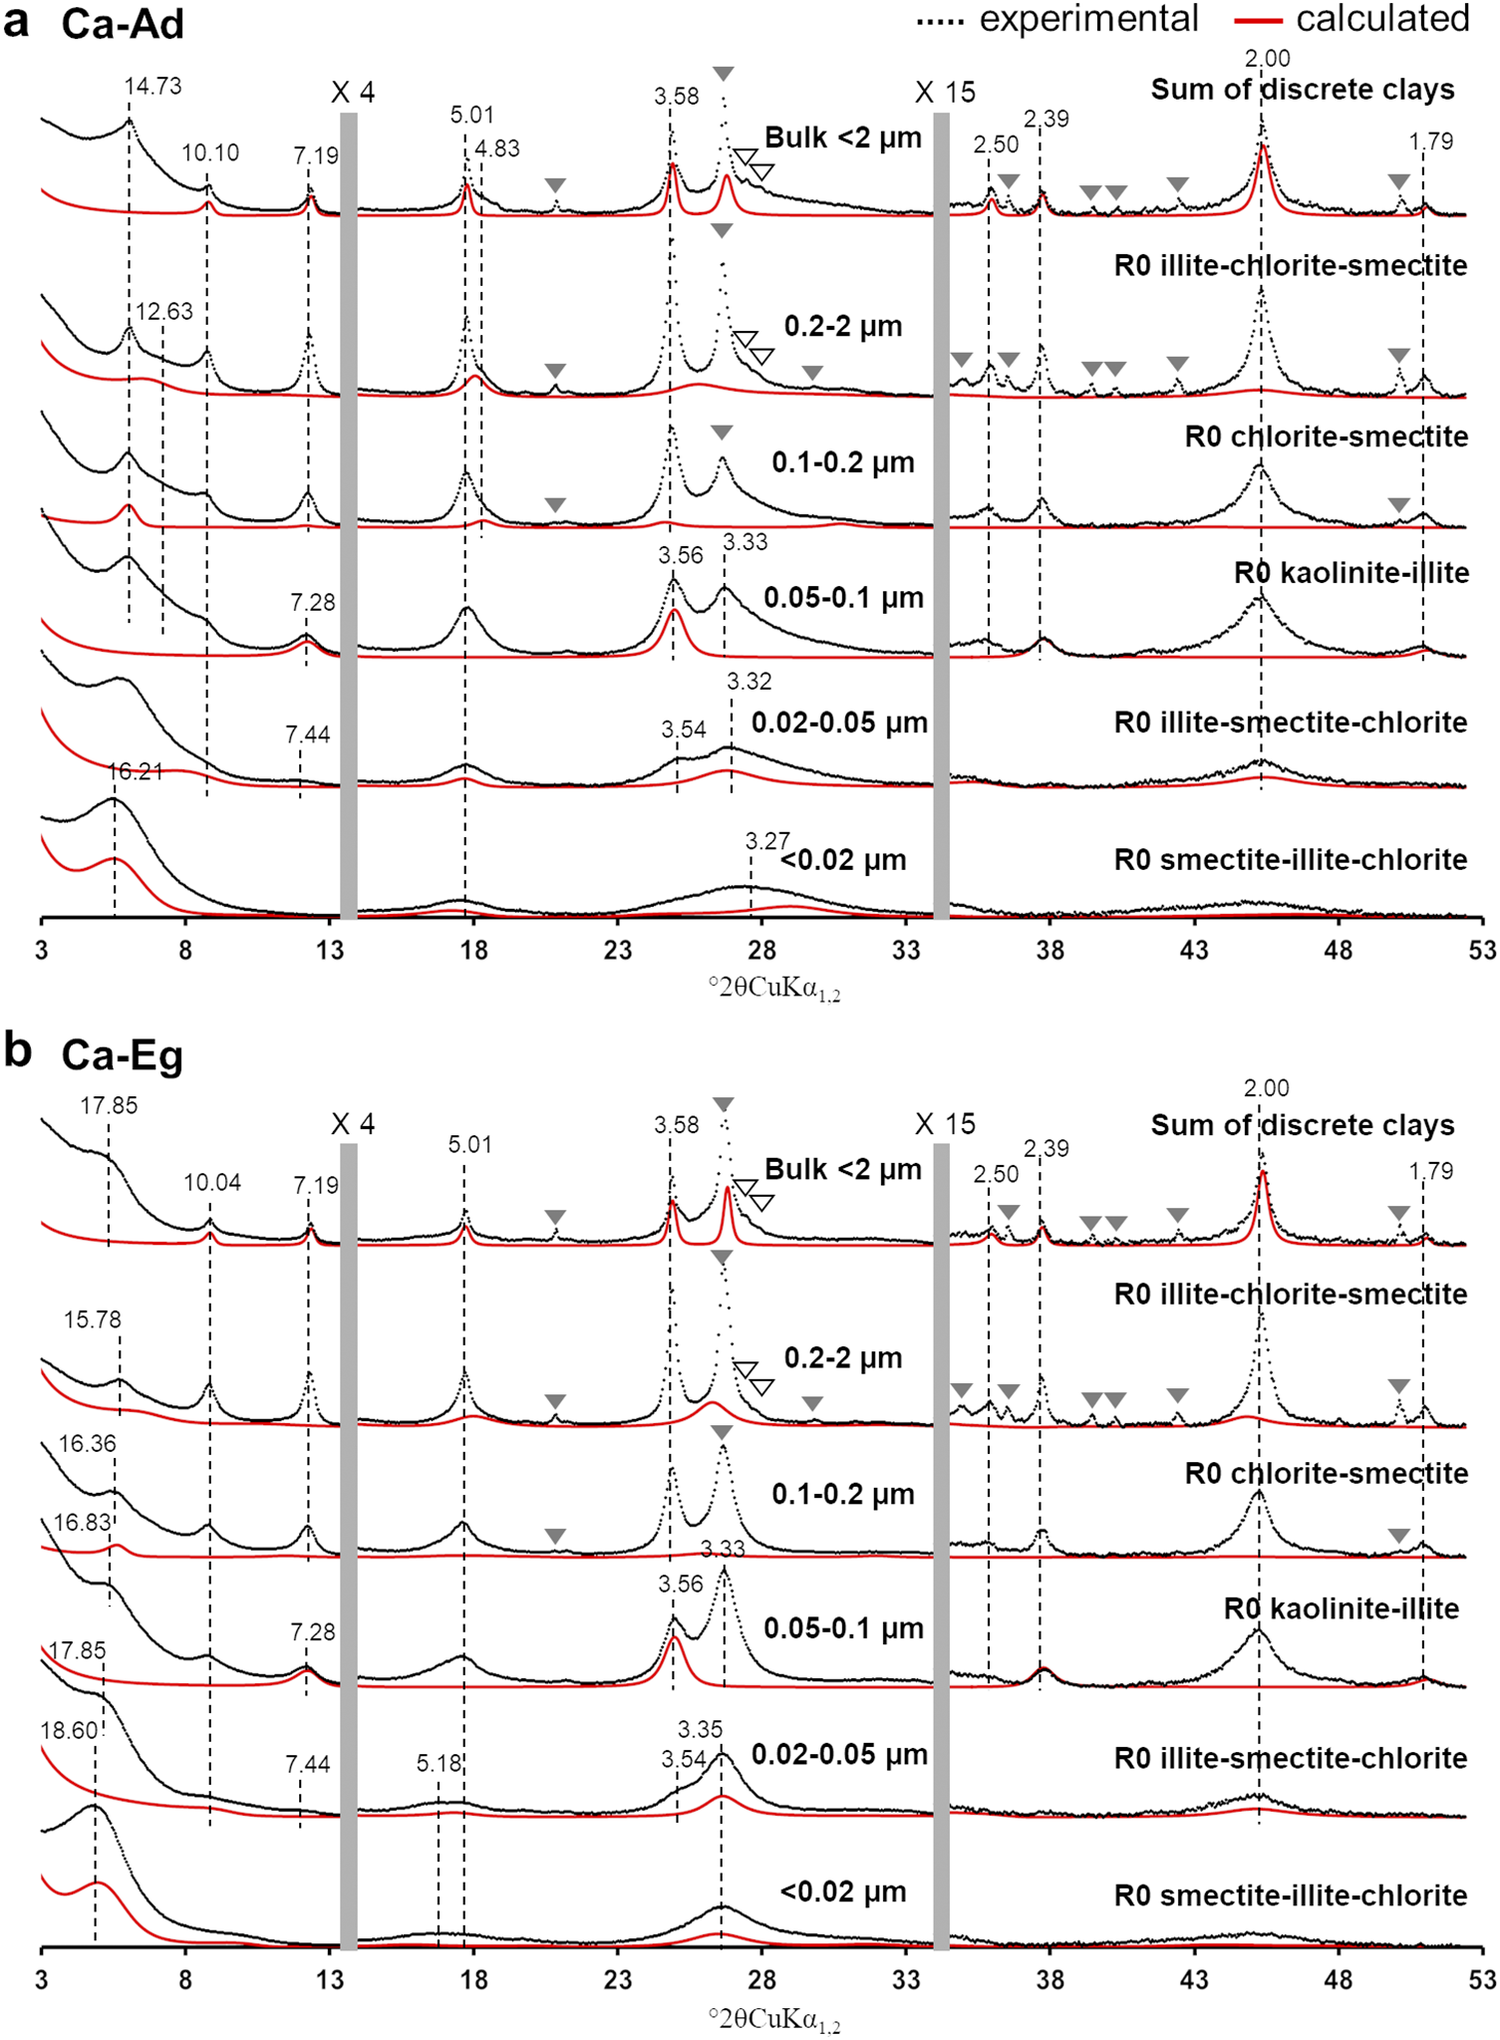
Contributions of the different clay phases to the calculated XRD profiles obtained after (a) Ca-Ad, and (b) Ca-Eg treatments. The experimental and calculated XRD patterns of MLMs are represented by black crosses and red traces, respectively. MLMs are presented in sub-fractions where they make a significant contribution to the overall diffracted intensity. The sum of the discrete clays presented in the bulk <2 μm fraction represents the sum of discrete clays and quasi-discrete clays (the dominant clay layer is >95%). The vertical gray bars indicate modified scale factors for the high-angle regions (×4 for 13.5–34° and ×15 for 34–53°) compared with the 3–13.5°2θ angular range. The black dashed lines indicate the positions of the main 00ℓ (Å) reflections for the experimental XRD patterns. The accessory mineral reflections are labeled as in Fig. 1. For an explanation of the colour coding used in this figure, please refer to the online version of this article.

Figure 3. Long description
The figure consists of two vertical panels, a and b, each containing six stacked X R D profiles. The x-axis represents 2 theta C u K alpha sub 1, 2 from 3 to 53 degrees. The y-axis represents intensity. Each profile shows experimental data as black dotted lines and calculated data as red solid lines.
Panel a Ca-Ad:
* Top trace: Sum of discrete clays in Bulk less than 2 micrometers. Peaks are labeled at 14.73, 10.10, 7.19, 5.01, 4.83, 3.58, and 2.00 Angstroms.
* Second trace: 0.2 to 2 micrometers fraction labeled R 0 illite-chlorite-smectite. Peak at 12.63 Angstroms.
* Third trace: 0.1 to 0.2 micrometers fraction labeled R 0 chlorite-smectite.
* Fourth trace: 0.05 to 0.1 micrometers fraction labeled R 0 kaolinite-illite. Peaks at 7.28, 3.56, and 3.33 Angstroms.
* Fifth trace: 0.02 to 0.05 micrometers fraction labeled R 0 illite-smectite-chlorite. Peaks at 16.21, 7.44, 3.54, and 3.32 Angstroms.
* Bottom trace: Less than 0.02 micrometers fraction labeled R 0 smectite-illite-chlorite. Peak at 3.27 Angstroms.
Panel b Ca-Eg:
* Top trace: Sum of discrete clays in Bulk less than 2 micrometers. Peaks are labeled at 17.85, 10.04, 7.19, 5.01, 3.58, 2.39, 2.00, and 1.79 Angstroms.
* Second trace: 0.2 to 2 micrometers fraction. Peak at 15.78 Angstroms.
* Third trace: 0.1 to 0.2 micrometers fraction. Peaks at 16.36 and 16.83 Angstroms.
* Fourth trace: 0.05 to 0.1 micrometers fraction. Peaks at 17.85, 7.28, 3.56, and 3.33 Angstroms.
* Fifth trace: 0.02 to 0.05 micrometers fraction. Peaks at 18.60, 7.44, 5.18, 3.54, and 3.35 Angstroms.
* Bottom trace: Less than 0.02 micrometers fraction.
Two vertical gray bars indicate scale changes: times 4 for the 13.5 to 34 degree range and times 15 for the 34 to 53 degree range. Solid and hollow triangles indicate accessory mineral reflections.
Regarding the kaolinite phase, the diffraction peak series was less resolved and more irregular in the sub-fractions between 0.02 and 0.1 μm, with notable shifts toward lower and higher angles for the 001 and 002 reflections (7.28 and 3.56 Å for the 0.05–0.1 μm sub-fraction, and 7.44 and 3.54 Å for the 0.02–0.05 μm sub-fraction, as shown in Fig. 3). Such an irrational peak series could not be reproduced using discrete kaolinite. For the 0.05–0.1 μm sub-fraction and in agreement with earlier studies (Hubert et al., Reference Hubert, Caner, Meunier and Ferrage2012; Viennet et al., Reference Viennet, Hubert, Ferrage, Tertre, Legout and Turpault2015; Bakker et al., Reference Bakker, Hubert, Wander and Lanson2018), the kaolinite-illite MLM (K/I) needed to be considered (Fig. 3). Due to the significant irrationality of the 00ℓ reflection series in the 0.02–0.05 μm sub-fraction compared with the 0.05–0.1 μm sub-fraction, a large amount of illite layers was introduced (R0 K/I=96/4 and 90/10 for the 0.05–0.1 μm and 0.02–0.05 μm sub-fractions, respectively; see Table 3).
Four additional MLMs displaying contrasting amounts of 2:1 layers (Table 3) were also necessary to reproduce the XRD profile of the entire set of experimental XRD patterns. The R0 chlorite-smectite MLM (C/S) accounted for the 001 reflection at 14.73 Å in the Ca-Ad sample and at 16.36 Å in the Ca-Eg sample in the 0.1–0.2 μm sub-fraction (Fig. 3). Considering its irrational peak series, the R0 chlorite-smectite contributed mainly to the low-intensity reflection at 4.83 Å in Ca-AD, which lost intensity significantly after Ca-Eg treatment. Adjusting the layer content of the R0 chlorite-smectite led to an equivalent amount of chlorite and smectite layers, except in the coarser sub-fraction, where the contribution of the chlorite layers increased (R0 C/S=60/40), accounting for the limited shift of the 001 reflections after Ca-Eg treatment (15.78 Å). The R0 illite-smectite-chlorite MLM (I/S/C) contributed mainly to the low-angle asymmetry of the illite 001 reflection and the broadening of the correlated 00ℓ reflections. This R0 illite-rich MLM contained >75% illite layers and was present in the four coarsest sub-fractions. The variable amount of smectite and/or chlorite layers (see Table 3) was adjusted to match the profile of the experimental 00ℓ illite reflections in the Ca-Ad and Ca-Eg treatments, regardless of the sub-fraction (e.g. the 0.02–0.05 μm sub-fraction shown in Fig. 3). The R0 illite-chlorite-smectite MLM (I/C/S) was dominated by illite layers to a lesser extent (from 53 to 60%), with smectite and chlorite layers presented in variable proportions, optimized for the different sub-fractions (Table 3). For the 0.2–2 μm subfraction, the R0 illite-chlorite-smectite MLM was responsible for the large XRD band at 12.63 Å and was the main contributor to the asymmetry at the high-angle side of the 002 illite reflection between 5.01 and 4.83 Å following Ca-Ad treatment (Fig. 3). The optimized proportions of smectite and chlorite layers in the relevant sub-fraction (i.e. I/S/C=53/17/30 in the 0.2–2 μm sub-fraction) allowed the slight shifts, broadening and loss of intensity of the experimental 00ℓ reflections after Ca-Eg treatment to be reproduced (Fig. 3b). The last MLM, which was dominated by smectite layers, was modeled with an R0 smectite-illite-chlorite (S/I/C=63/25/12) composition. This was essentially responsible for the low-angle, intense 001 reflection at 16.21 and 18.60 Å for the Ca-Ad and Ca-Eg treatments, respectively. These reflections were clearly visible in the finest fraction (the sub-fraction <0.02 μm in Fig. 3). While these 001 reflections could correspond to discrete smectite, the structure also considered additional illite and chlorite layers to account for marked XRD asymmetries, as well as the irrational 00ℓ reflection series at ~5 and 3.3 Å in the Ca-Ad and Ca-Eg treatments (Fig. 3).
The relative contributions of the various clay phases are reported in Table 4. These were consistent for the Ca-Ad and Ca-Eg treatments, for both the bulk <2 μm fractions and the various sub-fractions. Therefore, the relative contributions of the fitted and calculated bulk <2 μm fractions were also similar for each clay phase and the two treatments. These two constraints enabled the validity of the structural model to be assessed in terms of the composition and the number and relative proportions of the clay phases. The composition and structural parameters of the various clay phases, as reported in Table 3, indicated some general trends with decreasing particle size: (1) a systematic decrease in CSDS for all clay phases (N in Table 3); (2) a concomitant increase in octahedral iron content and a decrease in interlayer occupancy in the 2:1 layers; and (3) the composition of MLMs appeared to be more heterogeneous in Ca-Ad, with an increased proportion of monohydrated smectite layers. Regarding the relative proportions of the clay phases (Table 4), the bulk <2 μm fraction was dominated by three illite-rich clay phases, contributing ~70% to the sample. The R0 illite-chlorite-smectite present in all sub-fractions was the dominant clay phase in the sub-fractions <0.2 μm, accounting for between 33 and 40%. Meanwhile, R0 illite-smectite-chlorite and R0 illite-smectite were the main contributors in the coarsest fractions. The two kaolinite-rich phases and the chlorite-rich and smectite-rich phases exhibited similar contributions of ~10% to the bulk <2 μm fraction. The qualitative description of the experimental XRD patterns mentioned an enrichment in smectitic layers with decreasing sub-fraction size, which was confirmed by the presence of the smectite-rich phase (R0 smectite-illite-chlorite MLM) in the two finer sub-fractions. However, this phase was absent in the coarser sub-fractions. The chlorite-rich phase (R0 chlorite-smectite MLM) was present throughout the sub-fractions, contributing more markedly to those finer than 0.1 μm. In contrast, the contribution of the kaolinite-rich phases (kaolinite and R0 kaolinite-illite MLM) decreased as particle size decreased, becoming null in the finest sub-fraction. The absence of certain clay phases in the sub-fractions resulted in a limited number of coexisting clay phases, ranging from four in the finest sub-fraction to six in the 0.02–0.05 μm sub-fraction, and five in the three coarser sub-fractions (see Table 4).
Discussion
Advanced description of the original clay mineralogy of the 42 plots experiment of Versailles
The original clay mineralogy of the 42 plots experiment of Versailles was first provided by Pernes-Debuyser et al. (Reference Pernes-Debuyser, Pernes, Velde and Tessier2003), who identified five clay phases: discrete chlorite (in the 2–5 μm fraction), discrete kaolinite and discrete illite-mica, as well as two illite-smectite MLMs (R0 50/50) with large and small CSDS. These phases were identified using a qualitative approach that combined XRD pattern decomposition with the comparison of XRD peak positions between the experimental and calculated patterns to determine the composition of the MLMs. However, the proposed clay phases could not be used to reproduce the experimental XRD profiles using XRD full-profile modeling (Hubert et al., Reference Hubert, Caner, Meunier and Lanson2009). Those authors proposed, therefore, an alternative clay mineralogy with six phases based on XRD full-profile modeling of the <2 μm fraction of a nearby soil profile (Table 3). The discrete kaolinite and illite phases, as well as the main characteristics of the high CSDS-illite-smectite MLM, were retained. The main differences concerned the identification of low-CSDS kaolinite, discrete smectite, and chlorite-smectite MLMs (R0 62/38; Table 3). This clay mineralogy correctly reproduced the XRD experimental patterns of the bulk <2 μm fraction in both the Ad and Eg states for the five soil profile horizons. However, some uncertainties remained in determining the smallest clay phases (i.e. low CSDS kaolinite and smectite) because their identification relied primarily on diffracted intensities at the bottom of the 00ℓ reflections in the XRD patterns of the bulk <2 μm fraction. To overcome this limitation in soil samples, Hubert et al. (Reference Hubert, Caner, Meunier and Ferrage2012) developed and applied an advanced approach coupling sequential fractionation and XRD profile modeling.
The clay mineralogy of the bulk <2 μm fraction, as determined by XRD profile modeling of sub-fractions, revealed a slightly more complex composition than that proposed by Hubert et al. (Reference Hubert, Caner, Meunier and Lanson2009), with the presence of an additional illite-rich MLM (R0 illite-smectite-chlorite; see Table 3). Of the seven clay phases identified, XRD profile modeling confirmed the presence of the MLM chlorite-smectite and the discrete illite and kaolinite with high CSDS. Compared with Hubert et al. (Reference Hubert, Caner, Meunier and Lanson2009), the smaller number of chlorite layers in the MLM chlorite-smectite (i.e. 53% vs 62%) illustrated the influence of the coarsest clay phases on XRD profile modeling of the bulk <2 μm fraction, as this higher proportion of chlorite layers (60%) was only significant in the 0.2–2 μm subfraction (Table 3). As previously demonstrated by Hubert et al. (Reference Hubert, Caner, Meunier and Ferrage2012), XRD profile modeling of sub-fractions revealed the crystal structure of clay phases that made significant contributions to the finest sub-fractions. In the present study, these were the low-CSDS kaolinite- and smectite-rich clay phases. The results showed that the discrete clay phases of low-CSDS previously proposed (Hubert et al., Reference Hubert, Caner, Meunier and Lanson2009) were all MLMs: kaolinite-rich MLM kaolinite-illite (R0 92/8) and smectite-rich MLM smectite-illite-chlorite (R0 63/25/12; Table 3). In addition, despite the proportion of illite layers being close to 50%, the MLM illite-smectite common to the two previous studies (Pernes-Debuyser et al., Reference Pernes-Debuyser, Pernes, Velde and Tessier2003; Hubert et al., Reference Hubert, Caner, Meunier and Lanson2009) was a more complex, three-component MLM illite-chlorite-smectite (R0 54/16/30; Table 3).
A comparison of the clay mineralogy in the previous study (Hubert et al., Reference Hubert, Caner, Meunier and Lanson2009) with the current study indicated that one of the clay phases was unidentified and the crystal structures of the other three were misidentified. Consequently, a comparison of their relative contributions was not possible, as quantification first relied on the identification of clay phases. Nevertheless, the main general trends observed previously remained valid (Table 4): (1) illite-rich clay phases represented the majority of clay phases (nearly 70% of the sample); (2) MLM illite-chlorite-smectite was the dominant clay phase (>30% of the bulk <2 μm fraction); (3) discrete kaolinite and MLM chlorite-smectite exhibited similar contributions of ~10%. In addition, the contribution of MLM kaolinite-illite to the bulk <2 μm fraction was weak (<5%), while that of the smectite-rich MLM was ~10%.
Thus, the current description of the clay mineralogy revealed the significant heterogeneity of the crystal structures of the clay phases in the 42 plots experimental site, accounting for two discrete or quasi-discrete kaolinites and illites, and five MLMs, including three with three different 2:1 layer types. An overall view of the clay mineralogy showed that these five MLMs represented >70% of the clay phases presented in the bulk <2 μm fraction (Table 5).
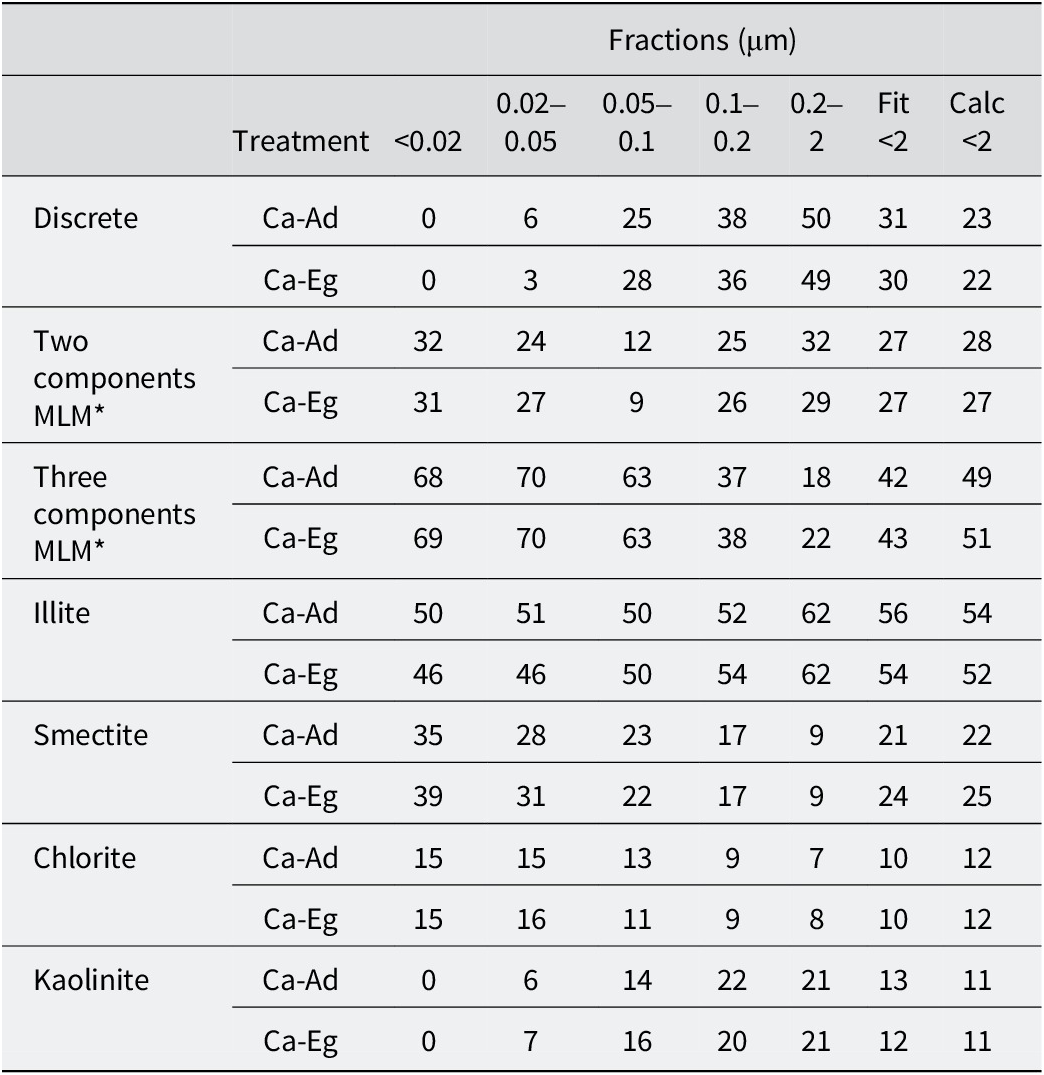
The upper part of the table lists the relative proportions (per cent) of discrete and MLMs (two or three components) and the lower part, the contributions of layers types, for the various sub-fractions to the bulk <2 μm fractions from the simulations of the experimental XRD patterns after Ca-Ad and Ca-Eg, respectively

Table 5. Long description
The table is organized into seven mineral categories, each with two treatment rows: Ca-Ad and Ca-Eg. The columns represent size fractions in micrometers: less than 0.02, 0.02 to 0.05, 0.05 to 0.1, 0.1 to 0.2, 0.2 to 2, Fit less than 2, and Calc less than 2.
* Discrete: Values increase with size, from 0 in the smallest fraction to 50 for Ca-Ad and 49 for Ca-Eg in the 0.2 to 2 micrometer fraction.
* Two components M L M: Proportions are relatively stable across fractions, ranging from 9 to 32.
* Three components M L M: Proportions are highest in the smallest fractions (68 to 70) and decrease as size increases, reaching 18 to 22 in the 0.2 to 2 micrometer fraction.
* Illite: Maintains high proportions across all sizes, generally increasing from 46 to 50 in the smallest fraction to 62 in the 0.2 to 2 micrometer fraction.
* Smectite: Shows a downward trend as size increases, from 35 to 39 in the smallest fraction down to 9 in the 0.2 to 2 micrometer fraction.
* Chlorite: Remains relatively low and stable, ranging from 16 in small fractions to 7 in the largest fraction.
* Kaolinite: Starts at 0 in the smallest fraction and increases to 21 in the 0.2 to 2 micrometer fraction.
The proportions for the <2 fitted and the <2 calculated were obtained by fitting the bulk <2 μm fraction and by summing the proportion of each clay phase in each sub-fraction, weighted to the relative mass of each sub-fraction, respectively. *MLMs represent the proportion of MLMs with a proportion of one layer <95%.
Similarities of MLMs from 42 plots experiment site with those of other temperate soils
The widespread occurrence of MLMs in temperate soils had been recognized for several decades (Millot, Reference Millot1964; MacEwan and Ruiz-Amil, Reference MacEwan, Ruiz-Amil and Gieseking1975; Pédro, Reference Pédro1983). Current results (Table 5), as well as those obtained previously by coupling sequential fractionation with XRD full-profile modeling (Hubert et al., Reference Hubert, Caner, Meunier and Ferrage2012; Viennet et al., Reference Viennet, Hubert, Ferrage, Tertre, Legout and Turpault2015; Bakker et al., Reference Bakker, Hubert, Wander and Lanson2018), provided complementary results showing that MLMs were by far the dominant clay phases in temperate soils. Earlier observations by Jackson et al. (Reference Jackson, Whittig, Vanden Heuvel, Kaufman and Brown1953) suggested that the majority of the finest clay particles (<0.08 μm fraction) were MLMs. This was confirmed here, with MLMs making up the entirety of the <0.02 μm sub-fraction and almost 95% of the 0.02–0.05 μm sub-fraction of the original surface horizon of the 42 plots (Table 5). These results also aligned with recent studies (Hubert et al., Reference Hubert, Caner, Meunier and Ferrage2012; Viennet et al., Reference Viennet, Hubert, Ferrage, Tertre, Legout and Turpault2015; Bakker et al., Reference Bakker, Hubert, Wander and Lanson2018), which found that the <0.05 μm sub-fraction was predominantly composed of MLMs.
Furthermore, despite clearly different pedological contexts, the nature of MLMs exhibited interesting similarities. Mixed layering between kaolinite and illite layers was first reported by Hubert et al. (Reference Hubert, Caner, Meunier and Ferrage2012) in a temperate Cambisol that had developed into a ferralitic paleosol. The large proportion of kaolinite-illite MLMs (~35% of the <2 μm bulk fraction) and the segregated nature of these MLMs led the authors to hypothesize formation in a tropical or subtropical climate. This hypothesis was supported by the description of MLMs in a Vertic Planosol in southwestern Ethiopia (Dumon et al., Reference Dumon, Tolossa, Capon, Detavemier and Van Ranst2014) and an Ultisol in South Carolina, USA (Austin et al., Reference Austin, Perry, Richter and Schroeder2018). The occurrence of kaolinite-illite MLM had also been extended to include moderately acidic soils formed under a temperate climate (e.g. Cambisols with an aluminum content), as proposed by Viennet et al. (Reference Viennet, Hubert, Ferrage, Tertre, Legout and Turpault2015), as well as slightly acidic Luvisol that had developed from carbonated deposits (Bakker et al. (Reference Bakker, Hubert, Wander and Lanson2018); Morrow Plots experimental fields, University of Illinois, USA). The parental material and pedogenesis processes of this Luvisol were similar to those of the 42 plots experimental site, and these two contexts exhibited a similar weak contribution of kaolinite-illite MLM of ~5% of the bulk <2 μm fraction. Current results suggested that mixed layering between kaolinite and illite layers was prevalent in fine clay particles measuring <0.1 μm, albeit with a limited size range due to its absence in the sub-fraction measuring <0.02 μm (Tables 3 and 4). This kaolinite-illite MLM, which had been described only occasionally in the past, thus appeared to be much more widespread in temperate soils than previously thought. In light of its presence in the various soils studied, the abundance of kaolinite-illite seemed to correlate with soil weathering intensity and natural acidification processes, i.e. its contribution increased with soil weathering and acidification. This was consistent with the neoformation of discrete kaolinite in soils (Dixon and Weed, Reference Dixon and Weed1989), which could be tentatively attributed to the pedological origin of the kaolinite-illite MLM.
The clay mineralogy of the 42 plots experimental site was dominated not only by MLMs, but above all by 2:1 MLMs with three components (Table 5). The present results showed that these MLMs were concentrated in the finest sub-fractions <0.1 μm in which they could represent over two-thirds of the clay phases (Table 5). Conversely, their contribution decreased in sub-fractions >0.1 μm, where they were present in small amounts compared with discrete and two-component MLMs in the coarsest sub-fraction. The increasing heterogeneity of 2:1 mixed-layer structures with decreasing particle size had been observed previously in temperate soils using sequential fractionation (Jackson et al., Reference Jackson, Whittig, Vanden Heuvel, Kaufman and Brown1953; Viennet et al., Reference Viennet, Hubert, Ferrage, Tertre, Legout and Turpault2015; Bakker et al., Reference Bakker, Hubert, Wander and Lanson2018), a method first developed by Jackson et al. (Reference Jackson, Whittig and Pennington1950). These results highlighted the importance of sequential fractionation for describing the complex clay mineralogy of temperate soils, which could currently be quantified by coupling it with XRD profile modeling.
A further detailed comparison of clay mineralogy in temperate soils highlighted similarities in the crystal structures of 2:1 MLMs with three components. Previous analyses of clay mineralogy from temperate soils (Viennet et al., Reference Viennet, Hubert, Ferrage, Tertre, Legout and Turpault2015; Bakker et al., Reference Bakker, Hubert, Wander and Lanson2018) reported three 2:1 MLMs with three components, comparable to those currently described for the 42 plots experimental site (Table 3): (1) smectite-rich MLMs with significant amounts of illite layers and chlorite or hydroxyl-interlayered layers (HI); (2) illite-rich MLMs constituted by ~80% illite layers with smectite, chlorite, or HI layers; and (3) other illite-rich MLMs consisting of 50–60% illite layers with significant amounts of smectite and chlorite or HI layers. The proportions of the second and third types of layers that constituted the MLMs, as well as their mean CSDS, varied according to the main weathering process active in the temperate soils studied, e.g. leaching (Bakker et al., Reference Bakker, Hubert, Wander and Lanson2018) or aluminization (Viennet et al., Reference Viennet, Hubert, Ferrage, Tertre, Legout and Turpault2015). However, the crystal structures of the three components of 2:1 MLMs remained notably consistent.
This comparison initially emphasized the significant heterogeneity of clay mineralogy in temperate soils, but also indicated that the most complex MLMs may have notable similarities in their crystal structures. These similarities were mainly due to the similar proportions of illite layers in MLMs from different temperate soils, despite the fact that the parental materials or weathering processes may differ.
Thus, focusing on the crystal structures of illitic clay phases, a comparison between the current results based on XRD analyses and previous ones obtained from other techniques and temperate soils, i.e. transmission electron microscopy (TEM) and/or chemical analyses (Laird et al., Reference Laird, Barak, Natar and Dowdy1991; Robert et al., Reference Robert, Hardy and Elsass1991; Laird and Nater, Reference Laird and Nater1993), may provide further insights in order to better understand the clay mineralogy of temperate soils.
Confirmation of the observed panel of illitic clay phases in temperate soils
The original bulk fraction of the 42 plots experiment (<2 μm) was predominantly made up of illite layers (>50%), followed by ~25% smectite layers, and smaller contributions of chlorite and kaolinite layers (~10%; see Table 5). Illite layers remained the dominant layer type regardless of particle size, accounting for ~50% of all sub-fractions <0.2 μm (Table 5). This confirmed the significant contribution of fine particles to the total amount of illite layers, as previously demonstrated by Laird et al. (Reference Laird, Barak, Natar and Dowdy1991) and Laird and Nater (Reference Laird and Nater1993). In addition, XRD profile modeling results suggested that the majority of these illite layers belong to randomly stacked MLMs (Tables 3 and 4). Assuming Markovian distributions for layer stacking in R0 MLMs, convoluted by the lognormal distribution of the CSDSs, the degree of heterogeneity in the compositions of particles containing illite layers can be calculated (Drits and Tchoubar, Reference Drits and Tchoubar1990). Results from the 42 plots experiment on the bulk <2 μm fraction indicated that 83% of illite layers exhibited mixed-layered structures; the remaining illite layers were pure illitic crystals. These findings were consistent with previous results obtained through elemental analysis of fine fractions (Laird et al., Reference Laird, Barak, Natar and Dowdy1991) or TEM observations (Robert et al., Reference Robert, Hardy and Elsass1991; Laird and Nater, Reference Laird and Nater1993), which identified random illite-smectite MLMs as the most prevalent clay phases in the temperate soils studied.
Using XRD full-profile modeling, four illitic 2:1 clay phases were identified in the bulk <2 μm fraction of the 42 plots experimental site of Versailles (Tables 3 and 4). Similarly, Robert et al. (Reference Robert, Hardy and Elsass1991) identified four types of illitic clay phase in 15 clayey temperate soils using TEM observations. Despite the difficulty of making a direct comparison between XRD and TEM observations, earlier work by Altaner et al. (Reference Altaner, Weiss and Kirkpatrick1988) showed a high degree of agreement in the description of randomly MLMs obtained by TEM observations and XRD profile modeling. As the similarity of the results from both approaches was assessed, a comparison can be made. Robert et al. (Reference Robert, Hardy and Elsass1991) used TEM to identify coarse micrometric particles named micromicas, which had >10 layers per particle and a layer charge of >1.8e–, as well as some smectite layers on the border of the particles. In the present study, coarse, illite-rich clay phases exhibited features similar to those with a layer charge of >1.8e–, i.e. R0 illite-smectite and R0 illite-smectite-chlorite in the 0.2–2 μm subfraction, as well as R0 illite-smectite-chlorite in the 0.1–0.2 μm subfraction. These phases exhibited a CSDS of >10 layers (mean CSDS of 13.2 layers) and may contain a small number of smectite layers. The second illitic clay phases previously described by Robert et al. (Reference Robert, Hardy and Elsass1991) as illite sensu stricto corresponded to small nanometric particles (~50 nm) with a lower layer charge of >1.2e– and a mean value of five layers per particle. Smectite layers were systematically present in these particles. The illite-rich clay phases presented in the study, with a layer charge between 1.8e– and 1.2e–, i.e. R0 illite-smectite and R0 illite-smectite-chlorite in sub-fractions of 0.02–0.05 μm and 0.05–0.1 μm, as well as R0 illite-smectite-chlorite in the sub-fraction of <0.02 μm, were fine particles encountered in the sub-fraction of <0.1 μm and had a mean CSDS of 6.6. The third one identified by Robert et al. (Reference Robert, Hardy and Elsass1991) was the ‘structure’ MLMs formed of stacks of 1 nm layers (illite layers) periodically separated by swelling spaces (smectite layer) with variable particle sizes from nanometric to micrometric. The present R0 illite-chlorite-smectite MLM had a similar crystal structure, consisting of 53% illite layers and 47% smectite or chlorite layers, with a wide range of particle sizes (from sub-fractions of <0.02 to 0.2–2 μm). The fourth illitic clay phase identified was ‘textural’ MLMs composed of monolayers, bilayers and stacks of 3–5 layers of illite or smectite. This latter type of illitic MLM was also observed using TEM by Laird and Nater (Reference Laird and Nater1993) in the 0.02–0.06 μm sub-fraction of the temperate studied and the authors confirmed the low charge below 1.2e– of the illite in illitic MLMs (Laird et al., Reference Laird, Barak, Natar and Dowdy1991). In the present study, the R0 smectite-illite-chlorite MLM had a very low mean CSDS of 3.1, with a high proportion of randomly stacked smectite layers (63%), which were stacked with low-charge illite and chlorite layers.
The similarities between the illitic clay phases described in this study and those in previous studies paved the way for identifying general trends concerning the range of clay minerals that could be found in temperate soils. In a temperate climate, the present results confirmed that clay mineralogy was primarily composed of 2:1 clay minerals (Pédro, Reference Pédro1983), which were predominantly R0 2:1 MLMs. The complexity of the crystal structure increased as particle size decreased (Jackson et al., Reference Jackson, Whittig, Vanden Heuvel, Kaufman and Brown1953). As previously observed, illitic MLMs were the main contributors among these R0 2:1 MLMs (Robert et al., Reference Robert, Hardy and Elsass1991; Laird and Nater, Reference Laird and Nater1993). In addition to the quasi-discrete illite phase, three illitic clay MLMs were generally present, differing according to their mean particle size, layer-charge content, and principally their proportion of illite layers (~80%, ~50–60%, and less than 30%, respectively). Consequently, the illite layer was the dominant layer type, even in the finest size fractions. The proportion of smectite, chlorite or HI layers was more indicative of the parent material and active weathering processes.
Conclusions
The original clay mineralogy of the 42 plots experimental site of Versailles was determined using an approach that coupled sequential fractionation and XRD profile modeling. The clay mineralogy consisted of seven clay phases including two discrete or quasi-discrete kaolinite and illite, and five randomly MLMs including three MLMs with three different 2:1 layer types. The clay phases identified could be classified according to their contribution to the bulk <2 μm fraction: R0 illite-smectite-chlorite (57/30/13–32%), R0 illite-smectite-chlorite (80/12/8–25%), R0 illite-smectite (96/4–12%), R0 smectite-illite-chlorite (63/25/12–11%), kaolinite (9%), R0 chlorite-smectite (47/53–8%) and R0 kaolinite-illite (92/8–3%). This reinterpretation of the clay mineralogy at the start of the 42-plot experiment in Versailles in 1929 provided a new basis for studying the effect of agricultural practices on the evolution of soil properties in greater detail through the transformation of clay minerals, of which MLMs were the main indicators.
The results revealed that MLMs represented >70% of the clay phases that in turn allowed us to assess the predominance of MLMs with 2:1 layers in temperate soils, particularly for fine clay particles (<0.1 μm in size). The widespread occurrence of kaolinite-illite MLM and three 2:1 components MLMs in temperate soils was also confirmed. For the latter, comparisons with previous descriptions of clay mineralogy from temperate soils highlighted that despite the complexity of their crystal structures, three 2:1 components MLMs exhibited similar relative contributions of their constitutive layers, particularly for illite layers. The large contributions of these illitic clay phases in temperate soils, which had already been observed and quantified in the present work, suggested that these clay minerals should be considered as markers of soils from sedimentary rocks or deposits formed under temperate conditions.
Data availability statement
Data will be made available on request.
Acknowledgments
This study’s results were partly obtained using the IC2MP’s ‘environmental mineralogy’ platform, which is part of the RéGEF national network run by the CNRS. The authors thank INRAE for granting them access to the sample collection from the 42 plots in Versailles.
Author contributions
F. Hubert: Funding acquisition, Project administration, Conceptualization, Supervision, Formal analysis, Validation, Methodology, Data curation, Writing – original draft, Writing – review and editing; B. Dazas: Investigation, Formal analysis, Validation, Methodology, Writing – original draft, Writing – review and editing; E. Le Gouguec: Investigation, Methodology, Writing – original draft, Writing – review and editing; E. Ferrage: Investigation, Formal analysis, Validation, Methodology, Writing – original draft, Writing – review and editing’ P. Barré: Investigation, Writing – original draft, Writing – review and editing; C. Boissard: Investigation, Methodology; C. Chenu: Investigation, Writing – original draft, Writing – review and editing; B. Grégoire: Investigation, Writing – review and editing; E. Tertre: Investigation, Writing – original draft, Writing – review and editing; F. van Oort: Investigation, Methodology, Writing – original draft, Writing – review and editing.
Financial support
The authors are grateful to the CNRS interdisciplinary ‘défi Needs’ program (Project DARIUS), the French government program ‘Investissements d’Avenir’ (EUR INTREE, reference ANR-18-EURE-0010), and the European Union (ERDF) and ‘Région Nouvelle Aquitaine’ for providing financial support for this study.
Competing interests
The authors declare that they have no known competing financial interests or personal relationships that could have appeared to influence the work reported in this paper.
Declaration of AI use
We have not used AI-assisted technologies in creating this article. AI was used to improve the English after the article was written.